Iraq Contactor Market (2026-2032) | Growth, Industry, Outlook, Share, Companies, Forecast, Analysis, Size, Trends, Value & Revenue
Market Forecast By Type (Solid-State Contactor, Magnetic Contactor, Vacuum Contactor, Lighting Contactor), By Product (DC Contactor, AC Contactor), By Poles (2-Pole, 3-Pole, 4-Pole, Others), By Voltage (Low Voltage (Up To 1 KV), Medium Voltage (1 KV – 7.2 KV), High Voltage (Above 7.2 KV)), By End-users (Automotive, Power, Oil & Gas, Food & Beverage, Construction, Data Centers, FA Robots , Others) And Competitive Landscape
| Product Code: ETC014045 | Publication Date: Oct 2020 | Updated Date: Jun 2026 | Product Type: Report | |
| Publisher: 6Wresearch | Author: Shubham Padhi | No. of Pages: 70 | No. of Figures: 35 | No. of Tables: 5 |
Iraq Contactor Market Summary
The iraq contactor market was estimated at USD 309 Million in 2025 and is projected to reach USD 418 Million by 2032, growing at a CAGR of 5.5% from 2026 to 2032.
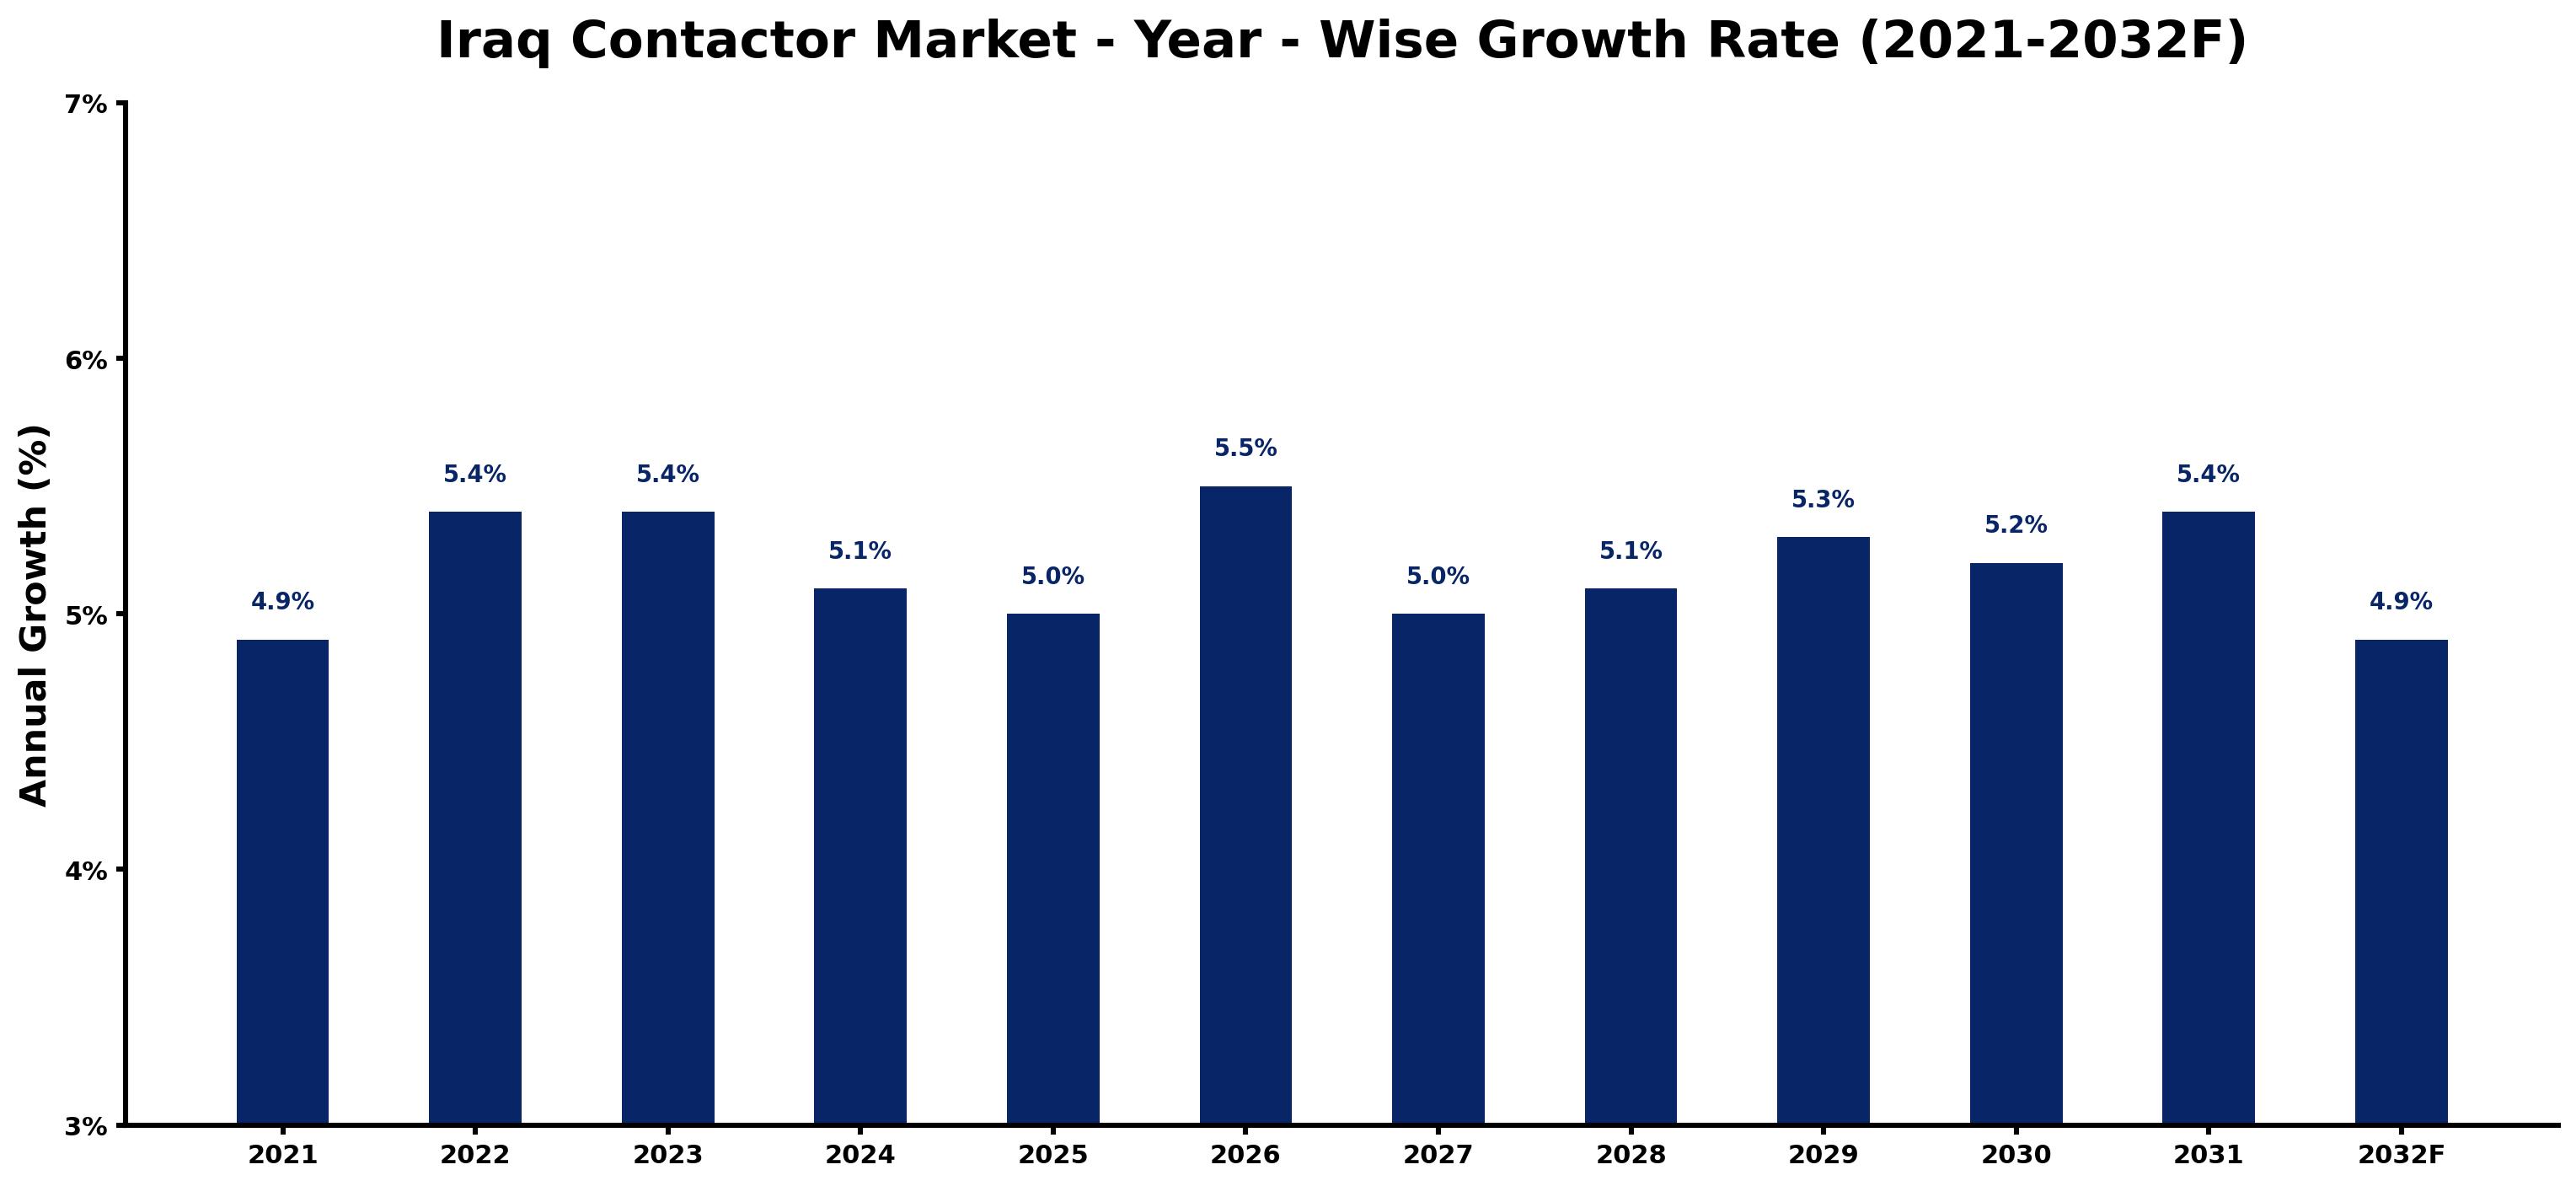
Iraq Contactor Market Growth Rate Analysis (2021-2032)
The Iraq contractor market has shown stable growth, witnessing rates of 4.9% in 2021 and 5.4% in both 2022 and 2023. This upward trend can be attributed to significant investments in infrastructure and energy projects, driven by government initiatives aimed at revamping the country's dilapidated facilities. As the nation continues to recover and modernize, the demand for contracting services remains robust, sustaining growth even amidst slight fluctuations. For instance, a dip to 5.1% in 2024 can be linked to temporary supply chain disruptions, while a rebound to 5.5% in 2026 reflects renewed consumer demand and increasing infrastructure projects. Overall, the market is expected to stabilize around the 5% mark through 2032, as Iraq benefits from ongoing digitalization and industrial advancements.
Iraq Contactor Market Year-wise Growth Rate and Key Drivers
This graph highlights how the Iraq Contactor Market has steadily grown over the past five years, supported by major growth factors.
The table below presents the year wise growth rates along with the key drivers influencing the market
| Year | Growth Rate | Major Drivers |
| 2021 | 4.9% | Reconstruction efforts saw a surge in demand for construction and engineering services. |
| 2022 | 5.4% | Local firms began forming partnerships with international contractors for large-scale projects. |
| 2023 | 5.4% | Infrastructure investments from the private sector fueled opportunities in urban development. |
| 2024 | 5.1% | Increased foreign interest led to enhanced competition among domestic contractors. |
| 2025 | 5.0% | Oil price stabilization supported additional funding for public infrastructure initiatives. |
| 2026 | 5.5% | Post-conflict recovery projects attracted international NGOs and investment funds into Iraq. |
| 2027 | 5.0% | Upgrades to utilities and transportation networks became critical for economic growth. |
| 2028 | 5.1% | Digital transformation in project management improved efficiency and reduced overhead costs. |
| 2029 | 5.3% | Sustainable building practices gained traction, aligning with global environmental standards. |
| 2030 | 5.2% | Renewed focus on renewable energy opened new avenues for contractors and suppliers. |
| 2031 | 5.4% | Government infrastructure priorities began shifting toward technology-driven smart cities. |
| 2032 | 4.9% | Emerging trends in modular construction minimized timelines and improved project feasibility. |
Note - Market size estimations and growth projections presented in this report are based on 6Wresearch's advanced forecasting approach, validated with industry datasets as of June 2026.
Iraq Contactor Market Synopsis
The Iraq Contactor Market is projected to reach 5.5% and witness significant growth during the forecast period (2026-2032). This burgeoning market is driven by an escalating demand for construction and infrastructure development, stemming from the urgent need for reconstruction following years of conflict. The landscape is characterized by both local firms and international entities bringing much-needed expertise and advanced technology to the region.
Iraq Contactor Market Growth Drivers
The Iraq Contactor Market is experiencing robust growth fueled by several key drivers:
- The growing demand for infrastructure projects, particularly in transportation and housing, driven by the government's long-term development plans.
- The urgent need for reconstruction after years of instability, particularly in areas heavily affected by conflict.
- An increase in government spending on public services and infrastructure, stemming from oil revenue, which plays a crucial role in Iraq's economy.
- The adoption of innovative construction practices, including sustainable techniques that align with global standards, enhancing competitiveness.
- The increasing involvement of international contractors seeking to invest and tap into the developing markets, introducing new technologies and management practices.
Iraq Contactor Market Trends and Opportunities
The Iraq Contactor Market is witnessing dynamic trends that highlight both opportunities and transformations within the industry:
- A notable shift towards sustainable construction practices is observable, with contractors focusing on environmentally friendly materials and processes.
- The incorporation of digital technologies such as Building Information Modeling (BIM) is improving project efficiency and collaboration among stakeholders.
- There is an increasing emphasis on local partnerships, facilitating knowledge transfer and enhancing the capabilities of local firms.
- Rising public-private partnerships are expected to play a vital role in funding and executing large-scale infrastructure projects.
- The demand for specialized contractors in sectors like healthcare and telecommunications is growing as the government seeks to modernize essential services.
Iraq Contactor Market Challenges and Restraints
The Iraq Contactor Market, while promising, faces several challenges that contractors must navigate:
- Security concerns arising from ongoing political instability and terrorism, which can threaten both personnel and project timelines.
- The complex regulatory framework presents difficulties in securing necessary permits and licenses, creating delays.
- Infrastructure limitations, including inadequate transportation networks and inconsistent power supply, complicate operations for contractors.
- Corruption and bureaucratic inefficiencies can significantly increase project costs and hinder timely execution.
- Fluctuations in global oil prices can adversely impact government budgets, influencing the demand for construction projects.
Iraq Contactor Market Government Investment and Initiatives
Government policies regarding investment in the Iraq Contactor Market are key to its development and sustainability:
- The Iraqi government has implemented various initiatives aimed at enhancing infrastructure, including substantial allocations for public works and housing projects.
- Regulatory reforms are set to encourage foreign investment, particularly in sectors where modernization is critical, such as telecommunications and energy.
- Public spending has been prioritized in essential services, creating an environment ripe for contractors to engage in significant projects.
- Incentives for local and international partnerships are being promoted to facilitate the transfer of technology and skills to the local workforce.
- Ongoing evaluation and enhancement of procurement guidelines by the government aim to promote transparency and efficiency in project execution.
Iraq Contactor Market Latest Developments (May 2025 - June 2026)
Recent developments in the Iraq Contactor Market from May 2025 to June 2026 reflect its evolving landscape:
- The government announced new initiatives aimed at accelerating infrastructure projects to bolster economic growth and recovery.
- Several international firms have entered into partnerships with local contractors under government incentives to enhance capacity and innovation.
- Technology adoption is becoming increasingly prevalent, with a focus on integrating digital solutions such as AI and project management software.
- Security conditions have shown slight improvements in select regions, leading to renewed interest from foreign investors in various construction sectors.
- New regulatory measures aimed at streamlining project approvals have been introduced, enhancing the overall ease of doing business for contractors.
Iraq Contactor Market - Key Attractiveness of the Report
- 10 Years of Market Numbers
- Historical Data Starting from 2022 to 2025
- Base Year: 2025
- Forecast Data until 2032
- Key Performance Indicators Impacting the Market
- Major Upcoming Developments and Projects
Key Highlights of the Report:
- Iraq Contactor Market Outlook
- Market Size of Iraq Contactor Market, 2025
- Forecast of Iraq Contactor Market, 2032F
- Historical Data and Forecast of Iraq Contactor Revenues & Volume for the Period 2022-2032F
- Iraq Contactor Market Trend Evolution
- Iraq Contactor Market Drivers and Challenges
- Iraq Contactor Price Trends
- Iraq Contactor Porter's Five Forces
- Iraq Contactor Industry Life Cycle
- Historical Data and Forecast of Iraq Contactor Market Revenues & Volume By Type for the Period 2022-2032F
- Historical Data and Forecast of Iraq Contactor Market Revenues & Volume By Solid-State Contactor for the Period 2022-2032F
- Historical Data and Forecast of Iraq Contactor Market Revenues & Volume By Magnetic Contactor for the Period 2022-2032F
- Historical Data and Forecast of Iraq Contactor Market Revenues & Volume By Vacuum Contactor for the Period 2022-2032F
- Historical Data and Forecast of Iraq Contactor Market Revenues & Volume By Lighting Contactor for the Period 2022-2032F
- Historical Data and Forecast of Iraq Contactor Market Revenues & Volume By Product for the Period 2022-2032F
- Historical Data and Forecast of Iraq Contactor Market Revenues & Volume By DC Contactor for the Period 2022-2032F
- Historical Data and Forecast of Iraq Contactor Market Revenues & Volume By AC Contactor for the Period 2022-2032F
- Historical Data and Forecast of Iraq Contactor Market Revenues & Volume By Poles for the Period 2022-2032F
- Historical Data and Forecast of Iraq Contactor Market Revenues & Volume By 2-Pole for the Period 2022-2032F
- Historical Data and Forecast of Iraq Contactor Market Revenues & Volume By 3-Pole for the Period 2022-2032F
- Historical Data and Forecast of Iraq Contactor Market Revenues & Volume By 4-Pole for the Period 2022-2032F
- Historical Data and Forecast of Iraq Contactor Market Revenues & Volume By Others for the Period 2022-2032F
- Historical Data and Forecast of Iraq Contactor Market Revenues & Volume By Voltage for the Period 2022-2032F
- Historical Data and Forecast of Iraq Contactor Market Revenues & Volume By Low Voltage (Up To 1 KV) for the Period 2022-2032F
- Historical Data and Forecast of Iraq Contactor Market Revenues & Volume By Medium Voltage (1 KV ? 7.2 KV) for the Period 2022-2032F
- Historical Data and Forecast of Iraq Contactor Market Revenues & Volume By High Voltage (Above 7.2 KV) for the Period 2022-2032F
- Historical Data and Forecast of Iraq Contactor Market Revenues & Volume By End-users for the Period 2022-2032F
- Historical Data and Forecast of Iraq Contactor Market Revenues & Volume By Automotive for the Period 2022-2032F
- Historical Data and Forecast of Iraq Contactor Market Revenues & Volume By Power for the Period 2022-2032F
- Historical Data and Forecast of Iraq Contactor Market Revenues & Volume By Oil & Gas for the Period 2022-2032F
- Historical Data and Forecast of Iraq Contactor Market Revenues & Volume By Food & Beverage for the Period 2022-2032F
- Historical Data and Forecast of Iraq Contactor Market Revenues & Volume By Construction for the Period 2022-2032F
- Historical Data and Forecast of Iraq Contactor Market Revenues & Volume By Data Centers for the Period 2022-2032F
- Historical Data and Forecast of Iraq Contactor Market Revenues & Volume By FA Robots for the Period 2022-2032F
- Historical Data and Forecast of Iraq Contactor Market Revenues & Volume By Others for the Period 2022-2032F
- Iraq Contactor Import Export Trade Statistics
- Market Opportunity Assessment By Type
- Market Opportunity Assessment By Product
- Market Opportunity Assessment By Poles
- Market Opportunity Assessment By Voltage
- Market Opportunity Assessment By End-users
- Iraq Contactor Top Companies Market Share
- Iraq Contactor Competitive Benchmarking By Technical and Operational Parameters
- Iraq Contactor Company Profiles
- Iraq Contactor Key Strategic Recommendations
Frequently Asked Questions About the Market Study (FAQs):
The growth is largely driven by government spending on infrastructure, the demand for reconstruction post-conflict, and increased foreign investment.
Contractors face security threats, regulatory complexities, infrastructure shortages, and corruption, which impact project timelines and costs.
The government is implementing reforms to encourage foreign investment, enhancing procurement processes, and prioritizing public spending on essential projects.
The outlook appears positive, with ongoing infrastructure demands and government initiatives expected to drive growth throughout the forecast period.
6Wresearch actively monitors the Iraq Contactor Market and publishes its comprehensive annual report, highlighting emerging trends, growth drivers, revenue analysis, and forecast outlook. Our insights help businesses to make data-backed strategic decisions with ongoing market dynamics. Our analysts track relevent industries related to the Iraq Contactor Market, allowing our clients with actionable intelligence and reliable forecasts tailored to emerging regional needs.
Yes, we provide customisation as per your requirements. To learn more, feel free to contact us on sales@6wresearch.com
1 Executive Summary |
2 Introduction |
2.1 Key Highlights of the Report |
2.2 Report Description |
2.3 Market Scope & Segmentation |
2.4 Research Methodology |
2.5 Assumptions |
3 Iraq Contactor Market Overview |
3.1 Iraq Country Macro Economic Indicators |
3.2 Iraq Contactor Market Revenues & Volume, 2022 & 2032F |
3.3 Iraq Contactor Market - Industry Life Cycle |
3.4 Iraq Contactor Market - Porter's Five Forces |
3.5 Iraq Contactor Market Revenues & Volume Share, By Type, 2022 & 2032F |
3.6 Iraq Contactor Market Revenues & Volume Share, By Product, 2022 & 2032F |
3.7 Iraq Contactor Market Revenues & Volume Share, By Poles, 2022 & 2032F |
3.8 Iraq Contactor Market Revenues & Volume Share, By Voltage, 2022 & 2032F |
3.9 Iraq Contactor Market Revenues & Volume Share, By End-users, 2022 & 2032F |
4 Iraq Contactor Market Dynamics |
4.1 Impact Analysis |
4.2 Market Drivers |
4.3 Market Restraints |
5 Iraq Contactor Market Trends |
6 Iraq Contactor Market, By Types |
6.1 Iraq Contactor Market, By Type |
6.1.1 Overview and Analysis |
6.1.2 Iraq Contactor Market Revenues & Volume, By Type, 2022-2032F |
6.1.3 Iraq Contactor Market Revenues & Volume, By Solid-State Contactor, 2022-2032F |
6.1.4 Iraq Contactor Market Revenues & Volume, By Magnetic Contactor, 2022-2032F |
6.1.5 Iraq Contactor Market Revenues & Volume, By Vacuum Contactor, 2022-2032F |
6.1.6 Iraq Contactor Market Revenues & Volume, By Lighting Contactor, 2022-2032F |
6.2 Iraq Contactor Market, By Product |
6.2.1 Overview and Analysis |
6.2.2 Iraq Contactor Market Revenues & Volume, By DC Contactor, 2022-2032F |
6.2.3 Iraq Contactor Market Revenues & Volume, By AC Contactor, 2022-2032F |
6.3 Iraq Contactor Market, By Poles |
6.3.1 Overview and Analysis |
6.3.2 Iraq Contactor Market Revenues & Volume, By 2-Pole, 2022-2032F |
6.3.3 Iraq Contactor Market Revenues & Volume, By 3-Pole, 2022-2032F |
6.3.4 Iraq Contactor Market Revenues & Volume, By 4-Pole, 2022-2032F |
6.3.5 Iraq Contactor Market Revenues & Volume, By Others, 2022-2032F |
6.4 Iraq Contactor Market, By Voltage |
6.4.1 Overview and Analysis |
6.4.2 Iraq Contactor Market Revenues & Volume, By Low Voltage (Up To 1 KV), 2022-2032F |
6.4.3 Iraq Contactor Market Revenues & Volume, By Medium Voltage (1 KV ? 7.2 KV), 2022-2032F |
6.4.4 Iraq Contactor Market Revenues & Volume, By High Voltage (Above 7.2 KV), 2022-2032F |
6.5 Iraq Contactor Market, By End-users |
6.5.1 Overview and Analysis |
6.5.2 Iraq Contactor Market Revenues & Volume, By Automotive, 2022-2032F |
6.5.3 Iraq Contactor Market Revenues & Volume, By Power, 2022-2032F |
6.5.4 Iraq Contactor Market Revenues & Volume, By Oil & Gas, 2022-2032F |
6.5.5 Iraq Contactor Market Revenues & Volume, By Food & Beverage, 2022-2032F |
6.5.6 Iraq Contactor Market Revenues & Volume, By Construction, 2022-2032F |
6.5.7 Iraq Contactor Market Revenues & Volume, By Data Centers, 2022-2032F |
6.5.8 Iraq Contactor Market Revenues & Volume, By Others, 2022-2032F |
6.5.9 Iraq Contactor Market Revenues & Volume, By Others, 2022-2032F |
7 Iraq Contactor Market Import-Export Trade Statistics |
7.1 Iraq Contactor Market Export to Major Countries |
7.2 Iraq Contactor Market Imports from Major Countries |
8 Iraq Contactor Market Key Performance Indicators |
9 Iraq Contactor Market - Opportunity Assessment |
9.1 Iraq Contactor Market Opportunity Assessment, By Type, 2022 & 2032F |
9.2 Iraq Contactor Market Opportunity Assessment, By Product, 2022 & 2032F |
9.3 Iraq Contactor Market Opportunity Assessment, By Poles, 2022 & 2032F |
9.4 Iraq Contactor Market Opportunity Assessment, By Voltage, 2022 & 2032F |
9.5 Iraq Contactor Market Opportunity Assessment, By End-users, 2022 & 2032F |
10 Iraq Contactor Market - Competitive Landscape |
10.1 Iraq Contactor Market Revenue Share, By Companies, 2025 |
10.2 Iraq Contactor Market Competitive Benchmarking, By Operating and Technical Parameters |
11 Company Profiles |
12 Recommendations |
13 Disclaimer |
Global Go To Market Strategy - 2030
Export potential enables firms to identify high-growth global markets with greater confidence by combining advanced trade intelligence with a structured quantitative methodology. The framework analyzes emerging demand trends and country-level import patterns while integrating macroeconomic and trade datasets such as GDP and population forecasts, bilateral import–export flows, tariff structures, elasticity differentials between developed and developing economies, geographic distance, and import demand projections. Using weighted trade values from 2020–2024 as the base period to project country-to-country export potential for 2030, these inputs are operationalized through calculated drivers such as gravity model parameters, tariff impact factors, and projected GDP per-capita growth. Through an analysis of hidden potentials, demand hotspots, and market conditions that are most favorable to success, this method enables firms to focus on target countries, maximize returns, and global expansion with data, backed by accuracy.
By factoring in the projected importer demand gap that is currently unmet and could be potential opportunity, it identifies the potential for the Exporter (Country) among 190 countries, against the general trade analysis, which identifies the biggest importer or exporter.
To discover high-growth global markets and optimize your business strategy:
Click Here
Pricing
- Single User License$ 1,995
- Department License$ 2,400
- Site License$ 3,120
- Global License$ 3,795

Leadership Perspectives from Industry Events
Search
Thought Leadership and Analyst Meet


Our Clients
6WResearch In News
- India Air Conditioner Market Set for Strong Rebound in 2026 After Weather-Led Correction and GST-Driven Recovery: 6Wresearch
- ADAS in India: How Automatic Emergency Braking, Blind Spot Detection & Driver Monitoring are Transforming Road Safety
- Doha a strategic location for EV manufacturing hub: IPA Qatar
- Demand for luxury TVs surging in the GCC, says Samsung
- Empowering Growth: The Thriving Journey of Bangladesh’s Cable Industry
- Demand for luxury TVs surging in the GCC, says Samsung
Latest Reports
- Nicaragua RPG Gaming Market (2026-2032)
- New Zealand RPG Gaming Market (2026-2032)
- Netherlands RPG Gaming Market (2026-2032)
- Nauru RPG Gaming Market (2026-2032)
- Namibia RPG Gaming Market (2026-2032)
- Mozambique RPG Gaming Market (2026-2032)
- Montenegro RPG Gaming Market (2026-2032)
- Mongolia RPG Gaming Market (2026-2032)
- Monaco RPG Gaming Market (2026-2032)
- Micronesia RPG Gaming Market (2026-2032)
Industry Events and Analyst Meet

HIMTEX 2026

India Refining Summit 2026

India EV Show 2026

EV tech India Expo 2026

Auto Tech Asia 2026
Whitepaper
- Middle East & Africa Commercial Security Market Click here to view more.
- Middle East & Africa Fire Safety Systems & Equipment Market Click here to view more.
- GCC Drone Market Click here to view more.
- Middle East Lighting Fixture Market Click here to view more.
- GCC Physical & Perimeter Security Market Click here to view more.