Ireland Driving Metal Chain Market (2026-2032) | Trends, Industry, Value, Analysis, Share, Revenue, Segmentation, Forecast, Size, Growth, Companies & Outlook
Market Forecast By Type (Stainless Steel Chain, Carbon Steel Chain, Alloy Chain, Copper Chain, Others), By Application (Automobile, Agricultural, Construction, Others) And Competitive Landscape
| Product Code: ETC4924505 | Publication Date: Nov 2023 | Updated Date: Apr 2026 | Product Type: Market Research Report | |
| Publisher: 6Wresearch | Author: Shubham Padhi | No. of Pages: 60 | No. of Figures: 30 | No. of Tables: 5 |
Ireland Driving Metal Chain Market Size (2020-2030)
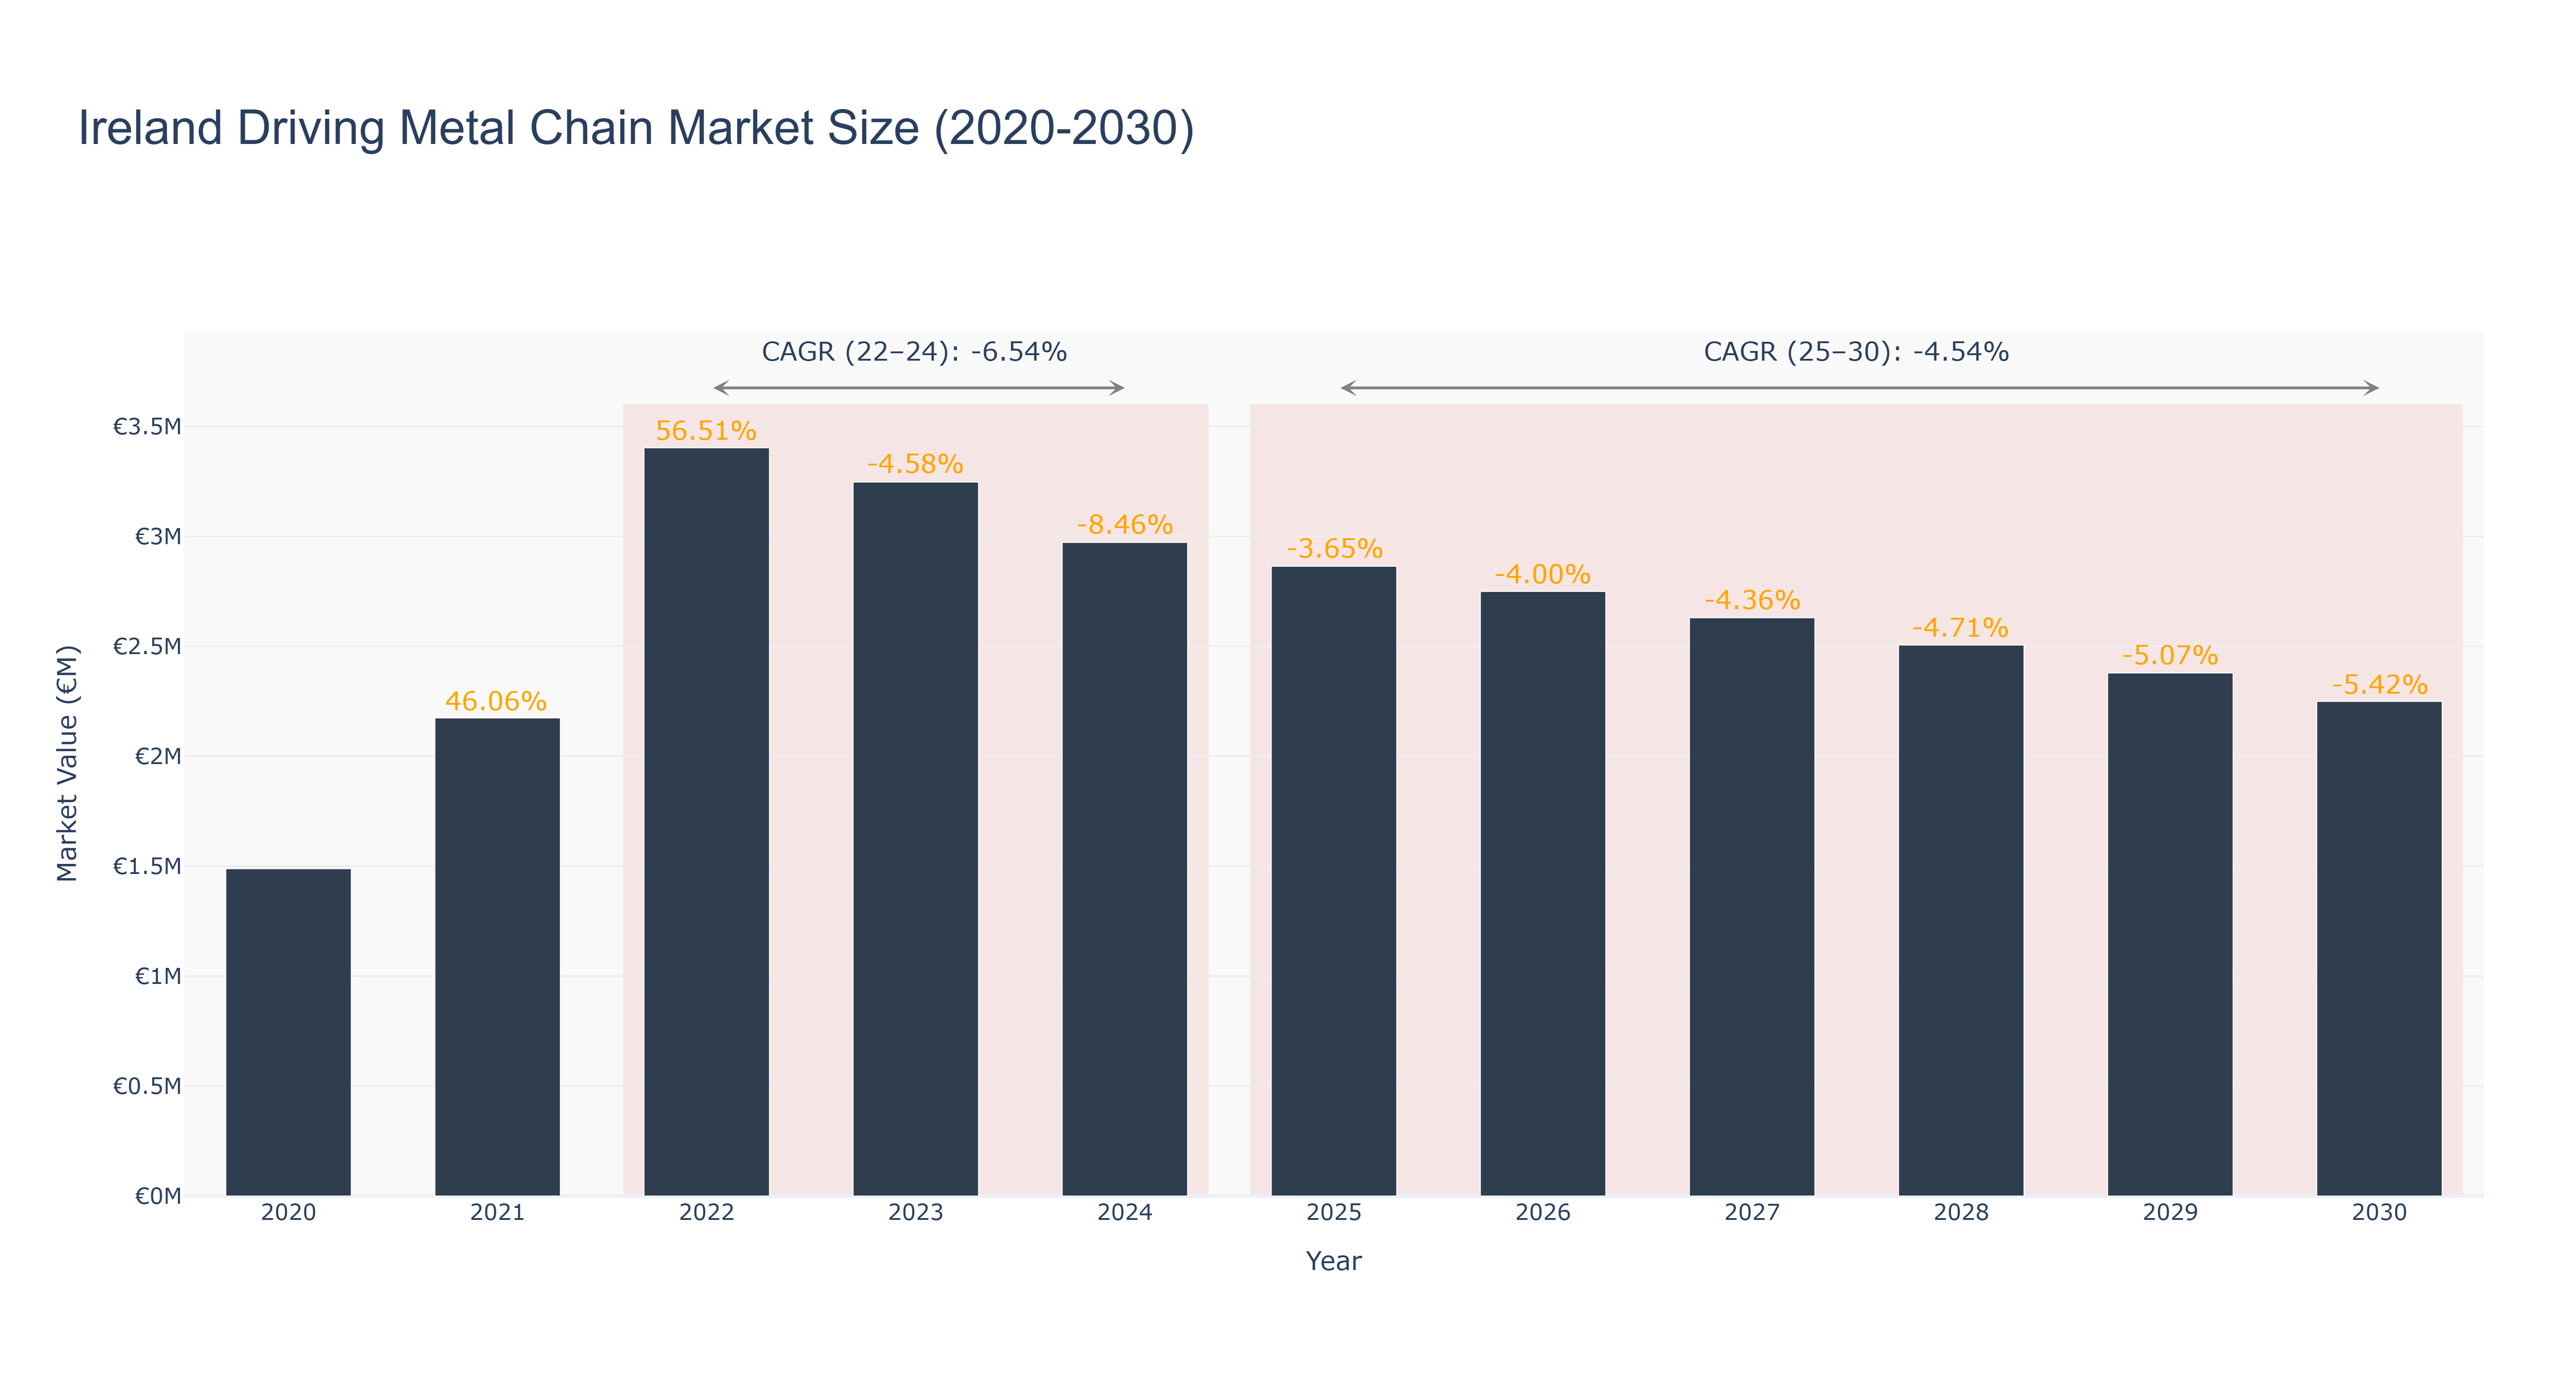
The Ireland Driving Metal Chain Market experienced significant growth from 2020 to 2022, peaking at €3.40 million in 2022 with an impressive growth rate of 56.51% from 2021. However, the subsequent years have shown a decline, with actual market sizes decreasing to €2.97 million by 2024, reflecting a negative CAGR of -6.54%. The projected outlook for 2025 to 2030 indicates a continued contraction, with forecasted market sizes declining from €2.86 million in 2025 to €2.25 million by 2030, resulting in a CAGR of -4.54%. This downturn can be attributed to various factors, including shifts in automotive manufacturing practices, increased competition from alternative materials, and potential economic uncertainties. Future developments in the market may hinge on advancements in technology and sustainability initiatives, which could reshape demand dynamics in the driving metal chain sector.
Ireland Driving Metal Chain Market: Production & Trade Performance (2019-2025)
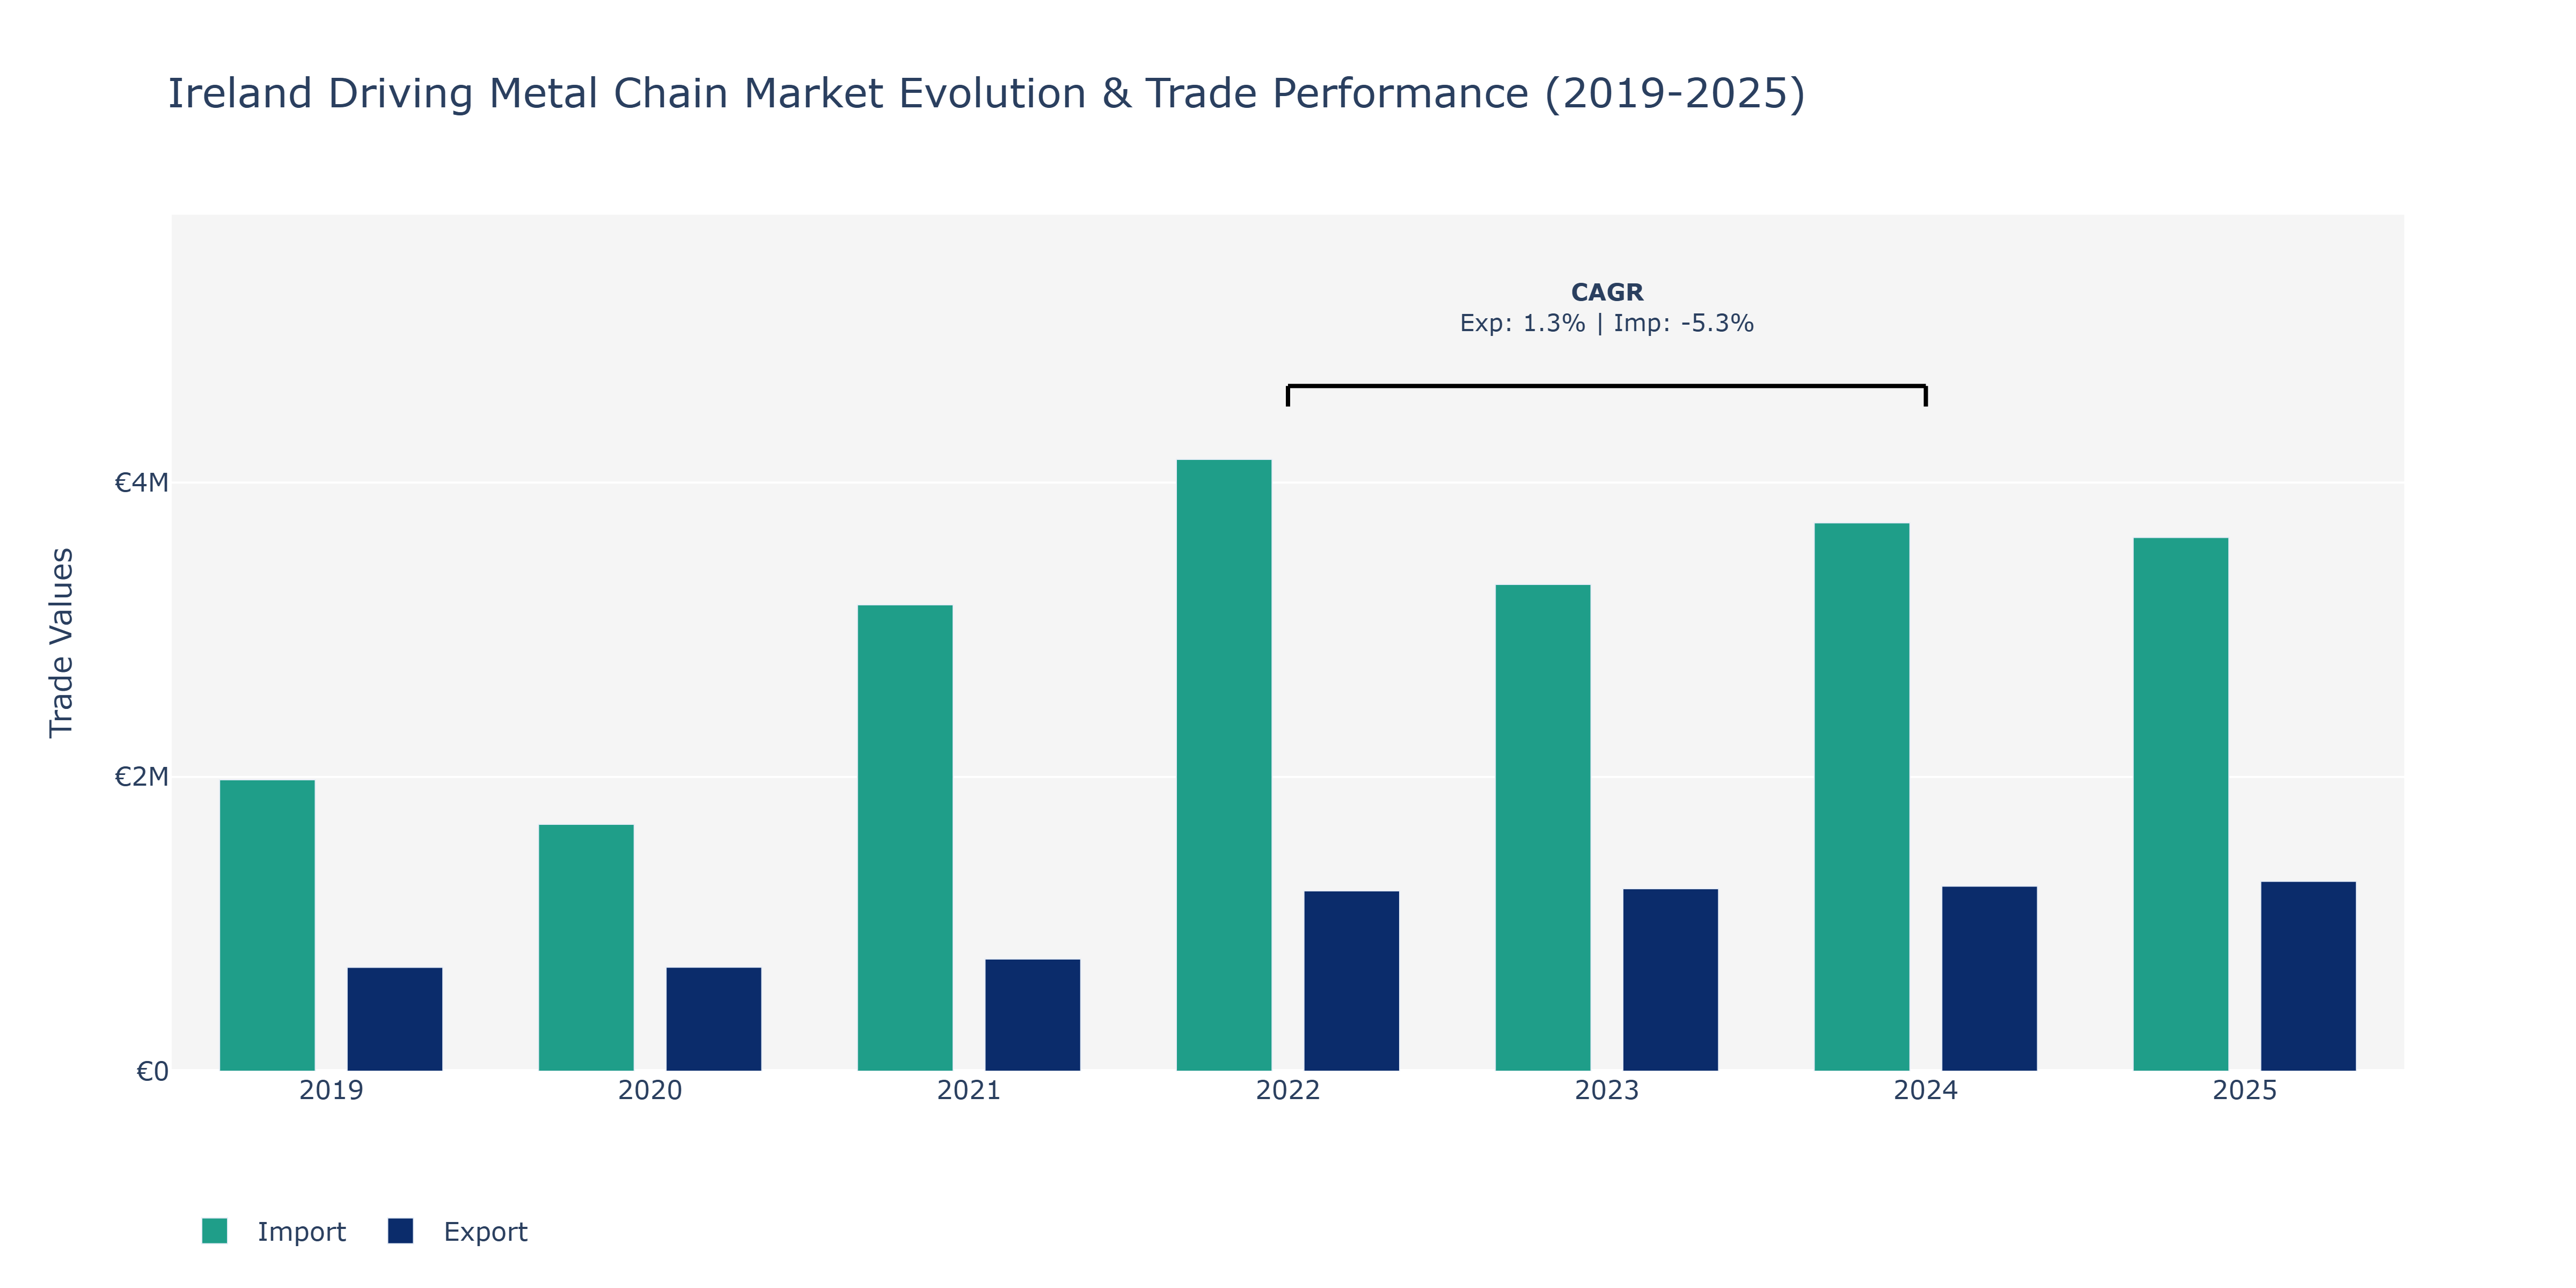
The data reveals fluctuations in Ireland's Driving Metal Chain Market exports and imports over the years. From 2019 to 2025, exports saw a steady increase from €706.16 thousand to €1.29 million, indicating a consistent growth trajectory. Conversely, imports witnessed fluctuations, reaching a peak of €4.16 million in 2022 before declining to €3.31 million in 2023 and then stabilizing around €3.63 million in 2025. The surge in exports can be attributed to Ireland's strong manufacturing sector, driving demand for metal chains globally. In contrast, the fluctuating imports may reflect varying demand for raw materials or cost fluctuations impacting inbound shipments. The decline in imports from 2022 to 2023 might be indicative of supply chain disruptions or shifting sourcing strategies within the industry. These trends emphasize the market's resilience and adaptability to external factors, showcasing Ireland's position in the global metal chain market.
Key Highlights of the Report:
- Ireland Driving Metal Chain Market Outlook
- Market Size of Ireland Driving Metal Chain Market, 2025
- Forecast of Ireland Driving Metal Chain Market, 2032
- Historical Data and Forecast of Ireland Driving Metal Chain Revenues & Volume for the Period 2022 - 2032F
- Ireland Driving Metal Chain Market Trend Evolution
- Ireland Driving Metal Chain Market Drivers and Challenges
- Ireland Driving Metal Chain Price Trends
- Ireland Driving Metal Chain Porter`s Five Forces
- Ireland Driving Metal Chain Industry Life Cycle
- Historical Data and Forecast of Ireland Driving Metal Chain Market Revenues & Volume By Type for the Period 2022 - 2032F
- Historical Data and Forecast of Ireland Driving Metal Chain Market Revenues & Volume By Stainless Steel Chain for the Period 2022 - 2032F
- Historical Data and Forecast of Ireland Driving Metal Chain Market Revenues & Volume By Carbon Steel Chain for the Period 2022 - 2032F
- Historical Data and Forecast of Ireland Driving Metal Chain Market Revenues & Volume By Alloy Chain for the Period 2022 - 2032F
- Historical Data and Forecast of Ireland Driving Metal Chain Market Revenues & Volume By Copper Chain for the Period 2022 - 2032F
- Historical Data and Forecast of Ireland Driving Metal Chain Market Revenues & Volume By Others for the Period 2022 - 2032F
- Historical Data and Forecast of Ireland Driving Metal Chain Market Revenues & Volume By Application for the Period 2022 - 2032F
- Historical Data and Forecast of Ireland Driving Metal Chain Market Revenues & Volume By Automobile for the Period 2022 - 2032F
- Historical Data and Forecast of Ireland Driving Metal Chain Market Revenues & Volume By Agricultural for the Period 2022 - 2032F
- Historical Data and Forecast of Ireland Driving Metal Chain Market Revenues & Volume By Construction for the Period 2022 - 2032F
- Historical Data and Forecast of Ireland Driving Metal Chain Market Revenues & Volume By Others for the Period 2022 - 2032F
- Ireland Driving Metal Chain Import Export Trade Statistics
- Market Opportunity Assessment By Type
- Market Opportunity Assessment By Application
- Ireland Driving Metal Chain Top Companies Market Share
- Ireland Driving Metal Chain Competitive Benchmarking By Technical and Operational Parameters
- Ireland Driving Metal Chain Company Profiles
- Ireland Driving Metal Chain Key Strategic Recommendations
Frequently Asked Questions About the Market Study (FAQs):
6Wresearch actively monitors the Ireland Driving Metal Chain Market and publishes its comprehensive annual report, highlighting emerging trends, growth drivers, revenue analysis, and forecast outlook. Our insights help businesses to make data-backed strategic decisions with ongoing market dynamics. Our analysts track relevent industries related to the Ireland Driving Metal Chain Market, allowing our clients with actionable intelligence and reliable forecasts tailored to emerging regional needs.
Yes, we provide customisation as per your requirements. To learn more, feel free to contact us on sales@6wresearch.com
1 Executive Summary |
2 Introduction |
2.1 Key Highlights of the Report |
2.2 Report Description |
2.3 Market Scope & Segmentation |
2.4 Research Methodology |
2.5 Assumptions |
3 Ireland Driving Metal Chain Market Overview |
3.1 Ireland Country Macro Economic Indicators |
3.2 Ireland Driving Metal Chain Market Revenues & Volume, 2022 & 2032F |
3.3 Ireland Driving Metal Chain Market - Industry Life Cycle |
3.4 Ireland Driving Metal Chain Market - Porter's Five Forces |
3.5 Ireland Driving Metal Chain Market Revenues & Volume Share, By Type, 2022 & 2032F |
3.6 Ireland Driving Metal Chain Market Revenues & Volume Share, By Application, 2022 & 2032F |
4 Ireland Driving Metal Chain Market Dynamics |
4.1 Impact Analysis |
4.2 Market Drivers |
4.2.1 Growth in the automotive industry in Ireland leading to increased demand for metal chains. |
4.2.2 Expansion of the construction sector in Ireland driving the need for metal chains for machinery and equipment. |
4.2.3 Increasing focus on industrial safety regulations in Ireland boosting the demand for high-quality metal chains. |
4.3 Market Restraints |
4.3.1 Fluctuations in raw material prices impacting the production costs of metal chains. |
4.3.2 Competition from alternative materials like synthetic chains affecting the market share of metal chains. |
4.3.3 Economic uncertainties and Brexit implications leading to market volatility and uncertainty. |
5 Ireland Driving Metal Chain Market Trends |
6 Ireland Driving Metal Chain Market Segmentations |
6.1 Ireland Driving Metal Chain Market, By Type |
6.1.1 Overview and Analysis |
6.1.2 Ireland Driving Metal Chain Market Revenues & Volume, By Stainless Steel Chain, 2022 - 2032F |
6.1.3 Ireland Driving Metal Chain Market Revenues & Volume, By Carbon Steel Chain, 2022 - 2032F |
6.1.4 Ireland Driving Metal Chain Market Revenues & Volume, By Alloy Chain, 2022 - 2032F |
6.1.5 Ireland Driving Metal Chain Market Revenues & Volume, By Copper Chain, 2022 - 2032F |
6.1.6 Ireland Driving Metal Chain Market Revenues & Volume, By Others, 2022 - 2032F |
6.2 Ireland Driving Metal Chain Market, By Application |
6.2.1 Overview and Analysis |
6.2.2 Ireland Driving Metal Chain Market Revenues & Volume, By Automobile, 2022 - 2032F |
6.2.3 Ireland Driving Metal Chain Market Revenues & Volume, By Agricultural, 2022 - 2032F |
6.2.4 Ireland Driving Metal Chain Market Revenues & Volume, By Construction, 2022 - 2032F |
6.2.5 Ireland Driving Metal Chain Market Revenues & Volume, By Others, 2022 - 2032F |
7 Ireland Driving Metal Chain Market Import-Export Trade Statistics |
7.1 Ireland Driving Metal Chain Market Export to Major Countries |
7.2 Ireland Driving Metal Chain Market Imports from Major Countries |
8 Ireland Driving Metal Chain Market Key Performance Indicators |
8.1 Average order value per customer for metal chains. |
8.2 Rate of new product development and innovation in metal chain offerings. |
8.3 Percentage of market share held by Ireland driving metal chain manufacturers. |
8.4 Customer satisfaction and retention rates for metal chains. |
8.5 Number of industrial accidents involving the failure of metal chains. |
9 Ireland Driving Metal Chain Market - Opportunity Assessment |
9.1 Ireland Driving Metal Chain Market Opportunity Assessment, By Type, 2022 & 2032F |
9.2 Ireland Driving Metal Chain Market Opportunity Assessment, By Application, 2022 & 2032F |
10 Ireland Driving Metal Chain Market - Competitive Landscape |
10.1 Ireland Driving Metal Chain Market Revenue Share, By Companies, 2025 |
10.2 Ireland Driving Metal Chain Market Competitive Benchmarking, By Operating and Technical Parameters |
11 Company Profiles |
12 Recommendations | 13 Disclaimer |
Global Go To Market Strategy - 2030
Export potential enables firms to identify high-growth global markets with greater confidence by combining advanced trade intelligence with a structured quantitative methodology. The framework analyzes emerging demand trends and country-level import patterns while integrating macroeconomic and trade datasets such as GDP and population forecasts, bilateral import–export flows, tariff structures, elasticity differentials between developed and developing economies, geographic distance, and import demand projections. Using weighted trade values from 2020–2024 as the base period to project country-to-country export potential for 2030, these inputs are operationalized through calculated drivers such as gravity model parameters, tariff impact factors, and projected GDP per-capita growth. Through an analysis of hidden potentials, demand hotspots, and market conditions that are most favorable to success, this method enables firms to focus on target countries, maximize returns, and global expansion with data, backed by accuracy.
By factoring in the projected importer demand gap that is currently unmet and could be potential opportunity, it identifies the potential for the Exporter (Country) among 190 countries, against the general trade analysis, which identifies the biggest importer or exporter.
To discover high-growth global markets and optimize your business strategy:
Click Here
Pricing
- Single User License$ 1,995
- Department License$ 2,400
- Site License$ 3,120
- Global License$ 3,795

Leadership Perspectives from Industry Events
Search
Thought Leadership and Analyst Meet


Our Clients
6WResearch In News
- India Air Conditioner Market Set for Strong Rebound in 2026 After Weather-Led Correction and GST-Driven Recovery: 6Wresearch
- ADAS in India: How Automatic Emergency Braking, Blind Spot Detection & Driver Monitoring are Transforming Road Safety
- Doha a strategic location for EV manufacturing hub: IPA Qatar
- Demand for luxury TVs surging in the GCC, says Samsung
- Empowering Growth: The Thriving Journey of Bangladesh’s Cable Industry
- Demand for luxury TVs surging in the GCC, says Samsung
Latest Reports
- Nicaragua RPG Gaming Market (2026-2032)
- New Zealand RPG Gaming Market (2026-2032)
- Netherlands RPG Gaming Market (2026-2032)
- Nauru RPG Gaming Market (2026-2032)
- Namibia RPG Gaming Market (2026-2032)
- Mozambique RPG Gaming Market (2026-2032)
- Montenegro RPG Gaming Market (2026-2032)
- Mongolia RPG Gaming Market (2026-2032)
- Monaco RPG Gaming Market (2026-2032)
- Micronesia RPG Gaming Market (2026-2032)
Industry Events and Analyst Meet

EV India Expo 2026

HIMTEX 2026

India Refining Summit 2026

India EV Show 2026

EV tech India Expo 2026
Whitepaper
- Middle East & Africa Commercial Security Market Click here to view more.
- Middle East & Africa Fire Safety Systems & Equipment Market Click here to view more.
- GCC Drone Market Click here to view more.
- Middle East Lighting Fixture Market Click here to view more.
- GCC Physical & Perimeter Security Market Click here to view more.