Ireland Magnesia Carbon Bricks Market (2026-2032) | Consumer Insights, Supply, Size, Competitive, Competition, Forecast, Growth, Strategy, Restraints, Segmentation, Demand, Opportunities, Analysis, Challenges, Companies, Segments, Trends, Industry, Value, Share, Outlook, Pricing Analysis, Investment Trends, Drivers, Strategic Insights, Revenue
Market Forecast By Type (High-Carbon, Low-Carbon, Ultra-Low Carbon), By Application (Steelmaking, Electric Arc Furnace, Ladle Furnaces), By End User (Steel Industry, Foundries, Non-Ferrous Metal Industry), By Sales Channel (Direct Sales, Distributors, Online) And Competitive Landscape
| Product Code: ETC12894510 | Publication Date: Apr 2025 | Updated Date: Apr 2026 | Product Type: Market Research Report | |
| Publisher: 6Wresearch | Author: Sachin Kumar Rai | No. of Pages: 65 | No. of Figures: 34 | No. of Tables: 19 |
Ireland Magnesia Carbon Bricks Market Size (2020-2030)
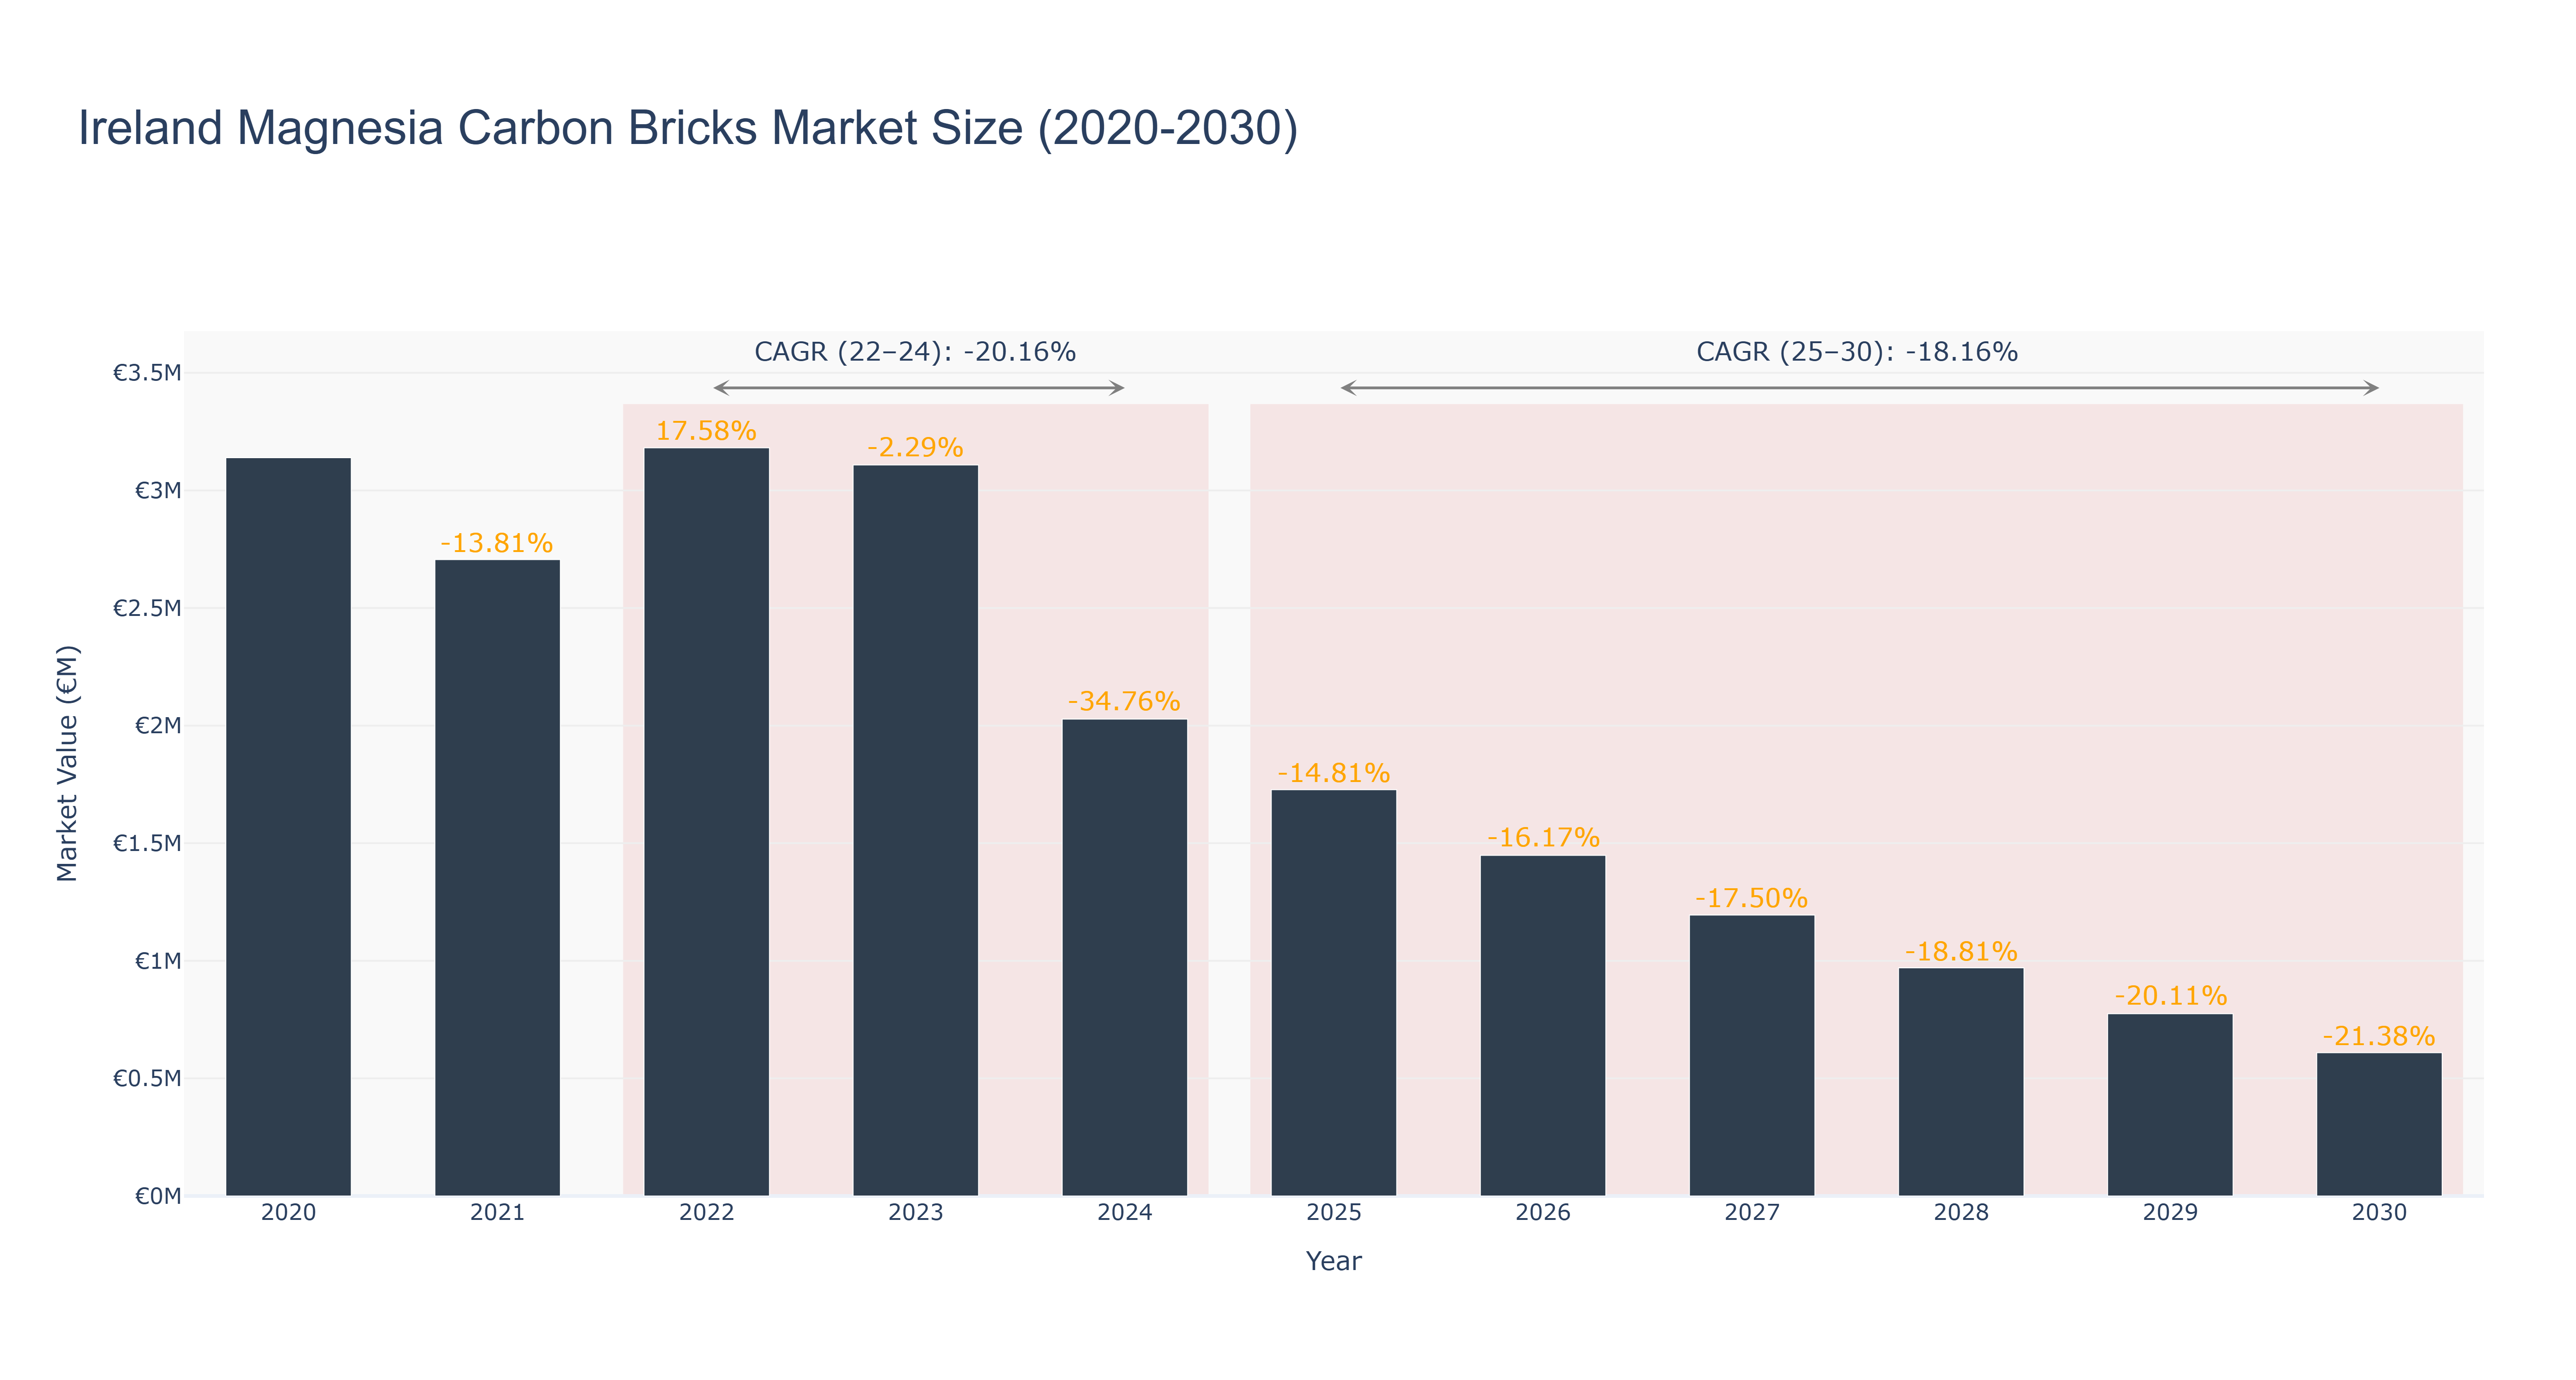
Ireland's Magnesia Carbon Bricks Market experienced a peak market size of €3.18 million in 2022, followed by a decline to €2.03 million in 2024. The market is forecasted to continue shrinking, reaching €0.61 million by 2030, with a CAGR of -18.16% from 2025 to 2030. The downward trend can be attributed to factors such as reduced demand in key industries and increasing competition from alternative materials. However, recent developments indicate a shift towards sustainable production methods and innovative applications in the construction sector, which could potentially drive market growth in the future. As of 2026, industry players are focusing on enhancing product quality and exploring new export opportunities to revitalize the market amidst challenging conditions.
Ireland Magnesia Carbon Bricks Market: Production & Trade Performance (2019-2025)
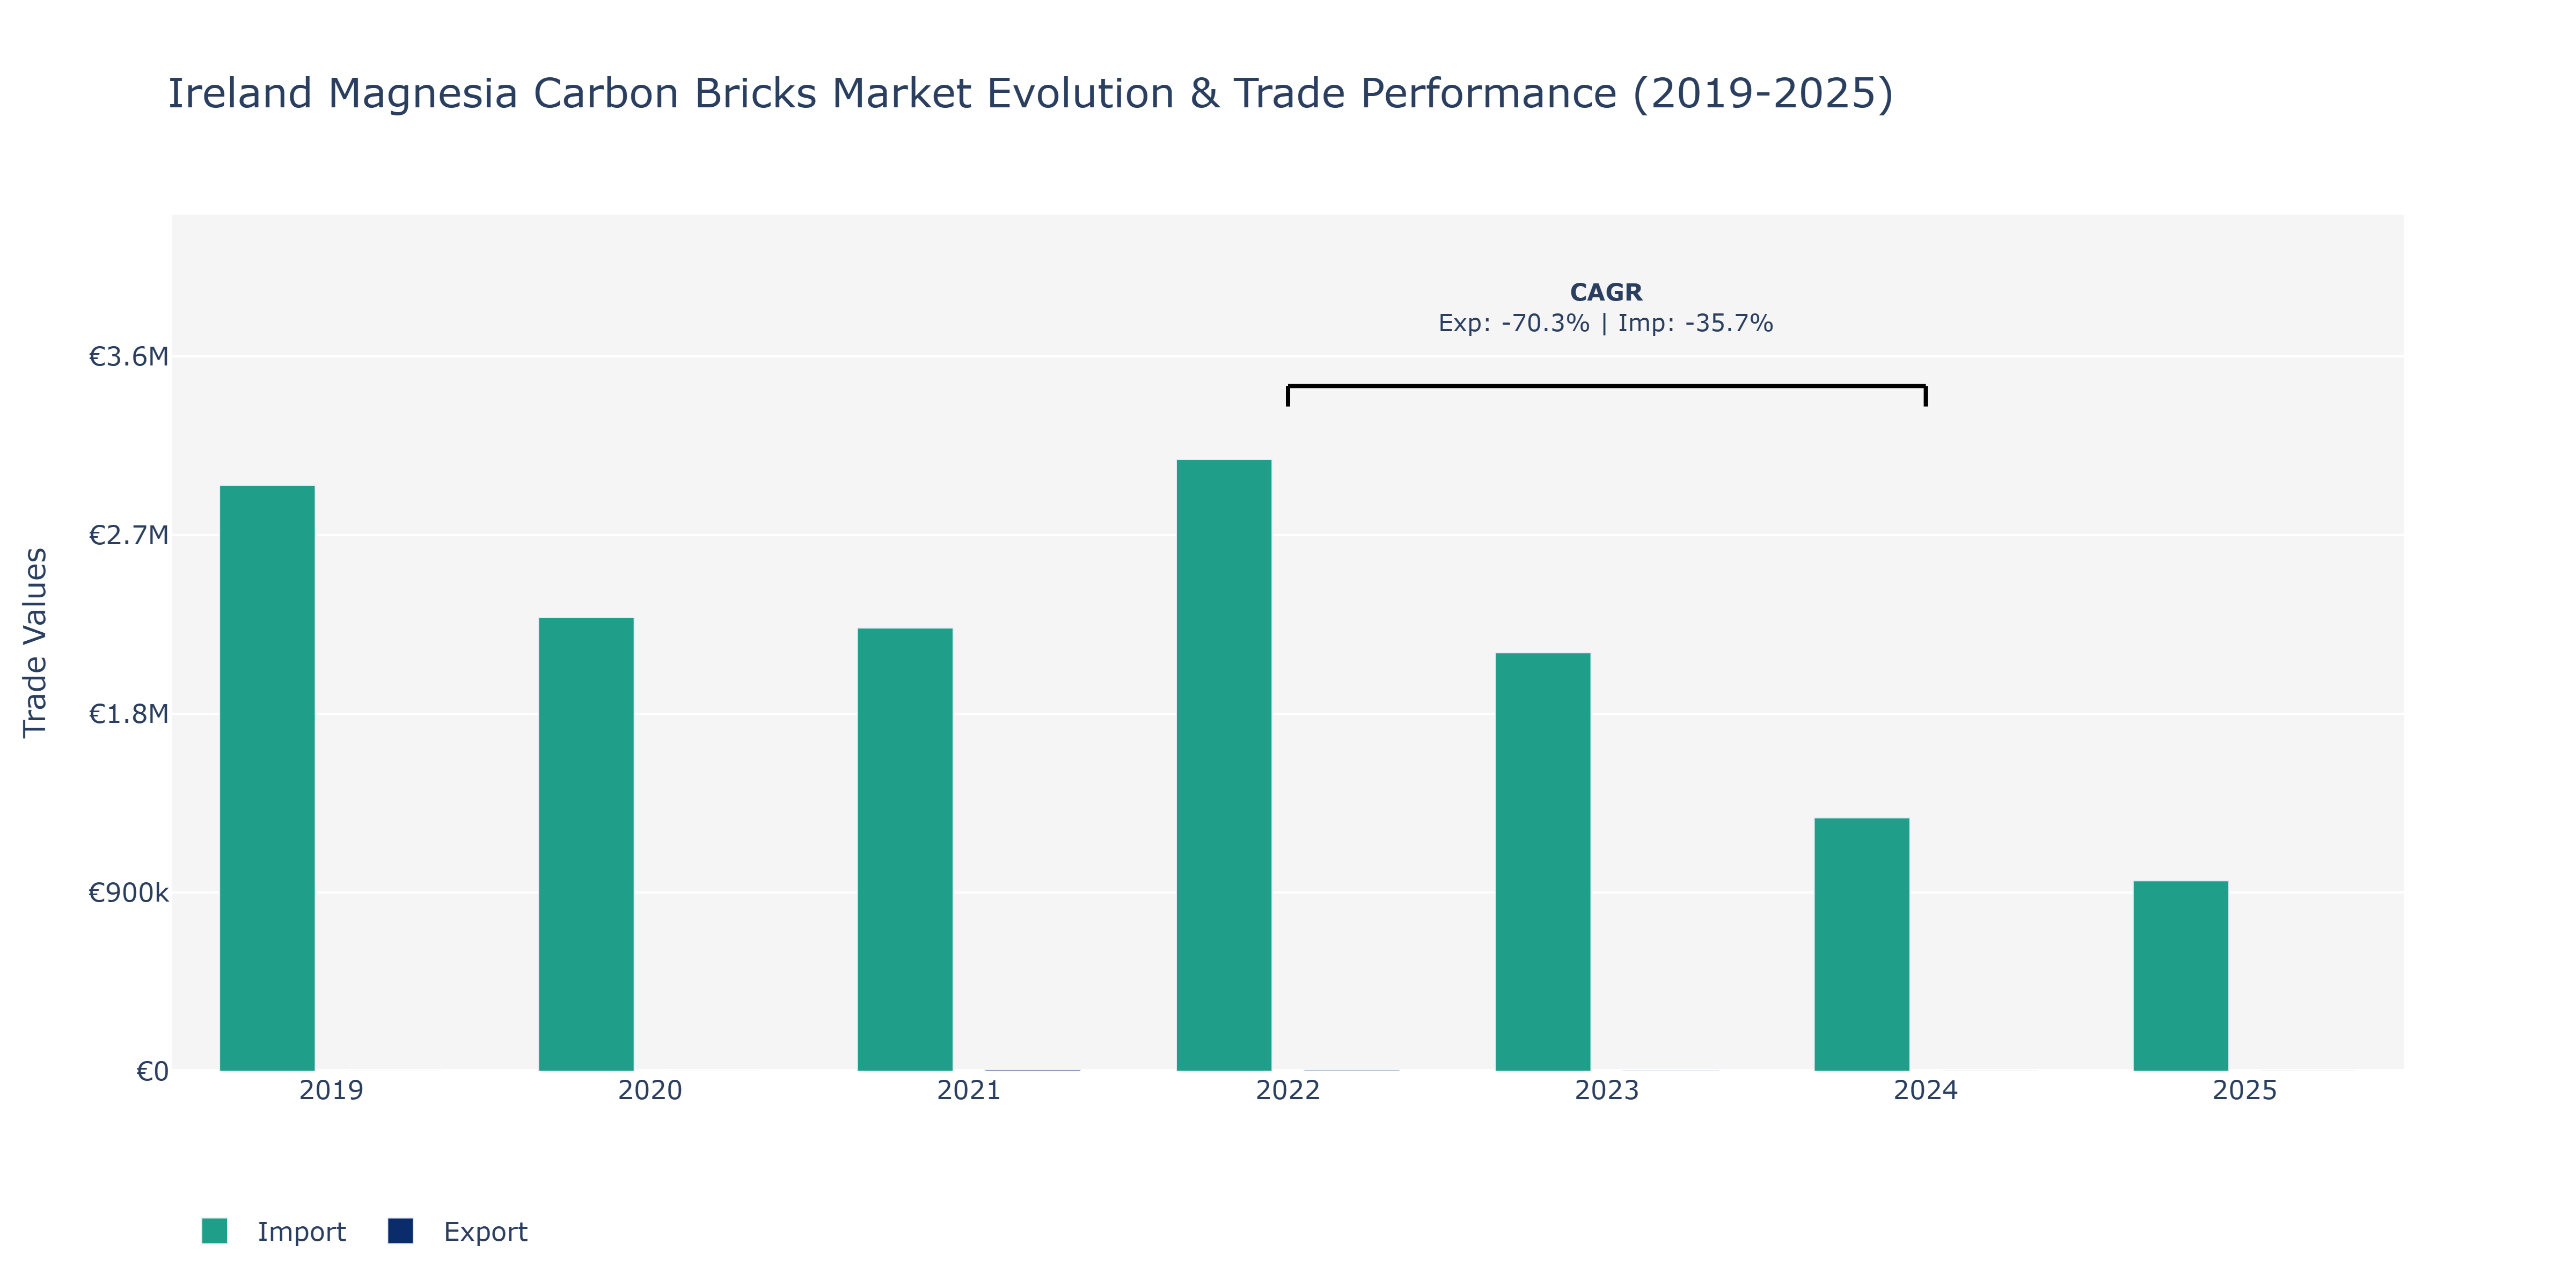
In the Ireland Magnesia Carbon Bricks Market, Imports experienced fluctuations over the years. In 2019, imports amounted to approximately €2.95 million, decreasing to around €2.28 million in 2020. The trend continued in 2021, with a slight decrease to €2.23 million. However, in 2022, imports peaked at €3.08 million before declining in the following years. Exports, on the other hand, showed a different pattern. Starting at €6.69 thousand in 2021, the value dropped significantly to €0.52 million in 2024, before slightly rebounding to approximately €0.39 million in 2025. The market might have experienced these shifts due to changes in global demand for magnesia carbon bricks, influenced by factors such as shifts in construction projects, advancements in competing materials, and fluctuations in prices of raw materials like magnesia and carbon. These trends suggest the need for market players to adapt to changing market dynamics and innovate to stay competitive.
Key Highlights of the Report:
- Ireland Magnesia Carbon Bricks Market Outlook
- Market Size of Ireland Magnesia Carbon Bricks Market, 2025
- Forecast of Ireland Magnesia Carbon Bricks Market, 2032
- Historical Data and Forecast of Ireland Magnesia Carbon Bricks Revenues & Volume for the Period 2022 - 2032F
- Ireland Magnesia Carbon Bricks Market Trend Evolution
- Ireland Magnesia Carbon Bricks Market Drivers and Challenges
- Ireland Magnesia Carbon Bricks Price Trends
- Ireland Magnesia Carbon Bricks Porter's Five Forces
- Ireland Magnesia Carbon Bricks Industry Life Cycle
- Historical Data and Forecast of Ireland Magnesia Carbon Bricks Market Revenues & Volume By Type for the Period 2022 - 2032F
- Historical Data and Forecast of Ireland Magnesia Carbon Bricks Market Revenues & Volume By High-Carbon for the Period 2022 - 2032F
- Historical Data and Forecast of Ireland Magnesia Carbon Bricks Market Revenues & Volume By Low-Carbon for the Period 2022 - 2032F
- Historical Data and Forecast of Ireland Magnesia Carbon Bricks Market Revenues & Volume By Ultra-Low Carbon for the Period 2022 - 2032F
- Historical Data and Forecast of Ireland Magnesia Carbon Bricks Market Revenues & Volume By Application for the Period 2022 - 2032F
- Historical Data and Forecast of Ireland Magnesia Carbon Bricks Market Revenues & Volume By Steelmaking for the Period 2022 - 2032F
- Historical Data and Forecast of Ireland Magnesia Carbon Bricks Market Revenues & Volume By Electric Arc Furnace for the Period 2022 - 2032F
- Historical Data and Forecast of Ireland Magnesia Carbon Bricks Market Revenues & Volume By Ladle Furnaces for the Period 2022 - 2032F
- Historical Data and Forecast of Ireland Magnesia Carbon Bricks Market Revenues & Volume By End User for the Period 2022 - 2032F
- Historical Data and Forecast of Ireland Magnesia Carbon Bricks Market Revenues & Volume By Steel Industry for the Period 2022 - 2032F
- Historical Data and Forecast of Ireland Magnesia Carbon Bricks Market Revenues & Volume By Foundries for the Period 2022 - 2032F
- Historical Data and Forecast of Ireland Magnesia Carbon Bricks Market Revenues & Volume By Non-Ferrous Metal Industry for the Period 2022 - 2032F
- Historical Data and Forecast of Ireland Magnesia Carbon Bricks Market Revenues & Volume By Sales Channel for the Period 2022 - 2032F
- Historical Data and Forecast of Ireland Magnesia Carbon Bricks Market Revenues & Volume By Direct Sales for the Period 2022 - 2032F
- Historical Data and Forecast of Ireland Magnesia Carbon Bricks Market Revenues & Volume By Distributors for the Period 2022 - 2032F
- Historical Data and Forecast of Ireland Magnesia Carbon Bricks Market Revenues & Volume By Online for the Period 2022 - 2032F
- Ireland Magnesia Carbon Bricks Import Export Trade Statistics
- Market Opportunity Assessment By Type
- Market Opportunity Assessment By Application
- Market Opportunity Assessment By End User
- Market Opportunity Assessment By Sales Channel
- Ireland Magnesia Carbon Bricks Top Companies Market Share
- Ireland Magnesia Carbon Bricks Competitive Benchmarking By Technical and Operational Parameters
- Ireland Magnesia Carbon Bricks Company Profiles
- Ireland Magnesia Carbon Bricks Key Strategic Recommendations
Frequently Asked Questions About the Market Study (FAQs):
6Wresearch actively monitors the Ireland Magnesia Carbon Bricks Market and publishes its comprehensive annual report, highlighting emerging trends, growth drivers, revenue analysis, and forecast outlook. Our insights help businesses to make data-backed strategic decisions with ongoing market dynamics. Our analysts track relevent industries related to the Ireland Magnesia Carbon Bricks Market, allowing our clients with actionable intelligence and reliable forecasts tailored to emerging regional needs.
Yes, we provide customisation as per your requirements. To learn more, feel free to contact us on sales@6wresearch.com
1 Executive Summary |
2 Introduction |
2.1 Key Highlights of the Report |
2.2 Report Description |
2.3 Market Scope & Segmentation |
2.4 Research Methodology |
2.5 Assumptions |
3 Ireland Magnesia Carbon Bricks Market Overview |
3.1 Ireland Country Macro Economic Indicators |
3.2 Ireland Magnesia Carbon Bricks Market Revenues & Volume, 2022 & 2032F |
3.3 Ireland Magnesia Carbon Bricks Market - Industry Life Cycle |
3.4 Ireland Magnesia Carbon Bricks Market - Porter's Five Forces |
3.5 Ireland Magnesia Carbon Bricks Market Revenues & Volume Share, By Type, 2022 & 2032F |
3.6 Ireland Magnesia Carbon Bricks Market Revenues & Volume Share, By Application, 2022 & 2032F |
3.7 Ireland Magnesia Carbon Bricks Market Revenues & Volume Share, By End User, 2022 & 2032F |
3.8 Ireland Magnesia Carbon Bricks Market Revenues & Volume Share, By Sales Channel, 2022 & 2032F |
4 Ireland Magnesia Carbon Bricks Market Dynamics |
4.1 Impact Analysis |
4.2 Market Drivers |
4.2.1 Increasing demand for refractories in industries such as steel, cement, and glass, which are major users of magnesia carbon bricks. |
4.2.2 Growing focus on energy efficiency and sustainability, leading to the adoption of advanced refractory materials like magnesia carbon bricks. |
4.2.3 Ongoing infrastructure development projects in Ireland, driving the demand for magnesia carbon bricks in construction and maintenance. |
4.3 Market Restraints |
4.3.1 Price volatility of raw materials used in magnesia carbon bricks production, affecting the overall cost and pricing strategy. |
4.3.2 Intense competition from alternative refractory materials like alumina carbon bricks or silica bricks, challenging the market share of magnesia carbon bricks. |
4.3.3 Environmental regulations and sustainability concerns impacting the manufacturing processes of magnesia carbon bricks. |
5 Ireland Magnesia Carbon Bricks Market Trends |
6 Ireland Magnesia Carbon Bricks Market, By Types |
6.1 Ireland Magnesia Carbon Bricks Market, By Type |
6.1.1 Overview and Analysis |
6.1.2 Ireland Magnesia Carbon Bricks Market Revenues & Volume, By Type, 2022 - 2032F |
6.1.3 Ireland Magnesia Carbon Bricks Market Revenues & Volume, By High-Carbon, 2022 - 2032F |
6.1.4 Ireland Magnesia Carbon Bricks Market Revenues & Volume, By Low-Carbon, 2022 - 2032F |
6.1.5 Ireland Magnesia Carbon Bricks Market Revenues & Volume, By Ultra-Low Carbon, 2022 - 2032F |
6.2 Ireland Magnesia Carbon Bricks Market, By Application |
6.2.1 Overview and Analysis |
6.2.2 Ireland Magnesia Carbon Bricks Market Revenues & Volume, By Steelmaking, 2022 - 2032F |
6.2.3 Ireland Magnesia Carbon Bricks Market Revenues & Volume, By Electric Arc Furnace, 2022 - 2032F |
6.2.4 Ireland Magnesia Carbon Bricks Market Revenues & Volume, By Ladle Furnaces, 2022 - 2032F |
6.3 Ireland Magnesia Carbon Bricks Market, By End User |
6.3.1 Overview and Analysis |
6.3.2 Ireland Magnesia Carbon Bricks Market Revenues & Volume, By Steel Industry, 2022 - 2032F |
6.3.3 Ireland Magnesia Carbon Bricks Market Revenues & Volume, By Foundries, 2022 - 2032F |
6.3.4 Ireland Magnesia Carbon Bricks Market Revenues & Volume, By Non-Ferrous Metal Industry, 2022 - 2032F |
6.4 Ireland Magnesia Carbon Bricks Market, By Sales Channel |
6.4.1 Overview and Analysis |
6.4.2 Ireland Magnesia Carbon Bricks Market Revenues & Volume, By Direct Sales, 2022 - 2032F |
6.4.3 Ireland Magnesia Carbon Bricks Market Revenues & Volume, By Distributors, 2022 - 2032F |
6.4.4 Ireland Magnesia Carbon Bricks Market Revenues & Volume, By Online, 2022 - 2032F |
7 Ireland Magnesia Carbon Bricks Market Import-Export Trade Statistics |
7.1 Ireland Magnesia Carbon Bricks Market Export to Major Countries |
7.2 Ireland Magnesia Carbon Bricks Market Imports from Major Countries |
8 Ireland Magnesia Carbon Bricks Market Key Performance Indicators |
8.1 Energy efficiency improvements in industries using magnesia carbon bricks. |
8.2 Adoption rate of advanced refractory materials in key industries. |
8.3 Number of infrastructure projects using magnesia carbon bricks for construction and maintenance. |
8.4 Percentage of raw material cost in the total production cost of magnesia carbon bricks. |
8.5 Compliance level with environmental regulations in magnesia carbon bricks manufacturing processes. |
9 Ireland Magnesia Carbon Bricks Market - Opportunity Assessment |
9.1 Ireland Magnesia Carbon Bricks Market Opportunity Assessment, By Type, 2022 & 2032F |
9.2 Ireland Magnesia Carbon Bricks Market Opportunity Assessment, By Application, 2022 & 2032F |
9.3 Ireland Magnesia Carbon Bricks Market Opportunity Assessment, By End User, 2022 & 2032F |
9.4 Ireland Magnesia Carbon Bricks Market Opportunity Assessment, By Sales Channel, 2022 & 2032F |
10 Ireland Magnesia Carbon Bricks Market - Competitive Landscape |
10.1 Ireland Magnesia Carbon Bricks Market Revenue Share, By Companies, 2025 |
10.2 Ireland Magnesia Carbon Bricks Market Competitive Benchmarking, By Operating and Technical Parameters |
11 Company Profiles |
12 Recommendations |
13 Disclaimer |
Export potential assessment - trade Analytics for 2030
Export potential enables firms to identify high-growth global markets with greater confidence by combining advanced trade intelligence with a structured quantitative methodology. The framework analyzes emerging demand trends and country-level import patterns while integrating macroeconomic and trade datasets such as GDP and population forecasts, bilateral import–export flows, tariff structures, elasticity differentials between developed and developing economies, geographic distance, and import demand projections. Using weighted trade values from 2020–2024 as the base period to project country-to-country export potential for 2030, these inputs are operationalized through calculated drivers such as gravity model parameters, tariff impact factors, and projected GDP per-capita growth. Through an analysis of hidden potentials, demand hotspots, and market conditions that are most favorable to success, this method enables firms to focus on target countries, maximize returns, and global expansion with data, backed by accuracy.
By factoring in the projected importer demand gap that is currently unmet and could be potential opportunity, it identifies the potential for the Exporter (Country) among 190 countries, against the general trade analysis, which identifies the biggest importer or exporter.
To discover high-growth global markets and optimize your business strategy:
Click Here
Pricing
- Single User License$ 1,995
- Department License$ 2,400
- Site License$ 3,120
- Global License$ 3,795

Search
Thought Leadership and Analyst Meet


Our Clients
Latest Reports
- China Electric Appliance Rental Market (2026-2032) | Trends, Revenue, Growth, Challenges, Size, Value, Outlook, Pricing, Strategy, Insights, Restraints, segmentation, Companies, Investment Opportunities, Analysis, Demand, Drivers, Competition, Forecast, Share
- Chile Electric Appliance Rental Market (2026-2032) | Outlook, Competition, Drivers, Strategy, Revenue, Analysis, Value, Pricing, Restraints, Size, Demand, Share, Growth, Forecast, Challenges, Insights, Investment Opportunities, Companies, Trends, segmentation
- Cambodia Electric Appliance Rental Market (2026-2032) | Companies, Analysis, Restraints, Pricing, Insights, Challenges, Outlook, Strategy, Forecast, Trends, Competition, Value, Revenue, Investment Opportunities, segmentation, Drivers, Size, Demand, Growth, Share
- Brazil Electric Appliance Rental Market (2026-2032) | Revenue, Strategy, Forecast, Companies, segmentation, Competition, Size, Investment Opportunities, Pricing, Restraints, Outlook, Challenges, Analysis, Drivers, Value, Demand, Insights, Trends, Growth, Share
- Bangladesh Electric Appliance Rental Market (2026-2032) | Drivers, Forecast, Investment Opportunities, Strategy, Insights, Demand, Challenges, Outlook, Trends, Competition, Value, Revenue, Size, Pricing, Analysis, Companies, Restraints, segmentation, Share, Growth
- Bahrain Electric Appliance Rental Market (2026-2032) | Outlook, Size, Competition, Restraints, Drivers, Value, Trends, Investment Opportunities, Insights, Forecast, Revenue, Strategy, Growth, Share, Demand, Analysis, Challenges, Companies, segmentation, Pricing
- Azerbaijan Electric Appliance Rental Market (2026-2032) | Trends, Investment Opportunities, Restraints, Insights, Strategy, Competition, Value, Growth, Demand, Drivers, Analysis, Forecast, Size, Share, Outlook, segmentation, Pricing, Challenges, Revenue, Companies
- Australia Electric Appliance Rental Market (2026-2032) | Challenges, Restraints, Forecast, Demand, Size, Competition, Pricing, Investment Opportunities, Revenue, Trends, Drivers, Growth, Outlook, Analysis, Strategy, Value, segmentation, Insights, Companies, Share
- Argentina Electric Appliance Rental Market (2026-2032) | Growth, Trends, Insights, Outlook, Forecast, Size, Drivers, Analysis, Restraints, Challenges, Share, Revenue, Investment Opportunities, Strategy, Demand, Value, Companies, segmentation, Competition, Pricing
- Algeria Electric Appliance Rental Market (2026-2032) | Share, Size, Value, Strategy, Competition, Outlook, Challenges, Companies, Trends, Pricing, Insights, Forecast, Investment Opportunities, Revenue, Growth, Restraints, segmentation, Analysis, Demand, Drivers
Industry Events and Analyst Meet

HIMTEX 2026

India Refining Summit 2026

India EV Show 2026

EV tech India Expo 2026

Auto Tech Asia 2026
Whitepaper
- Middle East & Africa Commercial Security Market Click here to view more.
- Middle East & Africa Fire Safety Systems & Equipment Market Click here to view more.
- GCC Drone Market Click here to view more.
- Middle East Lighting Fixture Market Click here to view more.
- GCC Physical & Perimeter Security Market Click here to view more.
6WResearch In News
- Doha a strategic location for EV manufacturing hub: IPA Qatar
- Demand for luxury TVs surging in the GCC, says Samsung
- Empowering Growth: The Thriving Journey of Bangladesh’s Cable Industry
- Demand for luxury TVs surging in the GCC, says Samsung
- Video call with a traditional healer? Once unthinkable, it’s now common in South Africa
- Intelligent Buildings To Smooth GCC’s Path To Net Zero