Israel Canine Oral Chewable Tablet Market (2026-2032) | Share, Industry, Size & Revenue, Analysis, Companies, Outlook, Trends, Value, Segmentation, Competitive Landscape, Forecast, Growth
Market Forecast By Composition Type (Botanically Synthesized, Chemically Synthesized), By Drug Type (Analgesics, Anti-infective, Anti-ulcers, Vitamins and Minerals), By Applications (Gastrointestinal Diseases, Infectious Diseases), By Mode of Purchase (Prescription, Over the Counter), By Distribution Channel (Veterinary Clinics, Veterinary Pharmacies, Online Veterinary Stores) And Competitive Landscape
| Product Code: ETC7647230 | Publication Date: Sep 2024 | Updated Date: Apr 2026 | Product Type: Market Research Report | |
| Publisher: 6Wresearch | Author: Sumit Sagar | No. of Pages: 75 | No. of Figures: 35 | No. of Tables: 20 |
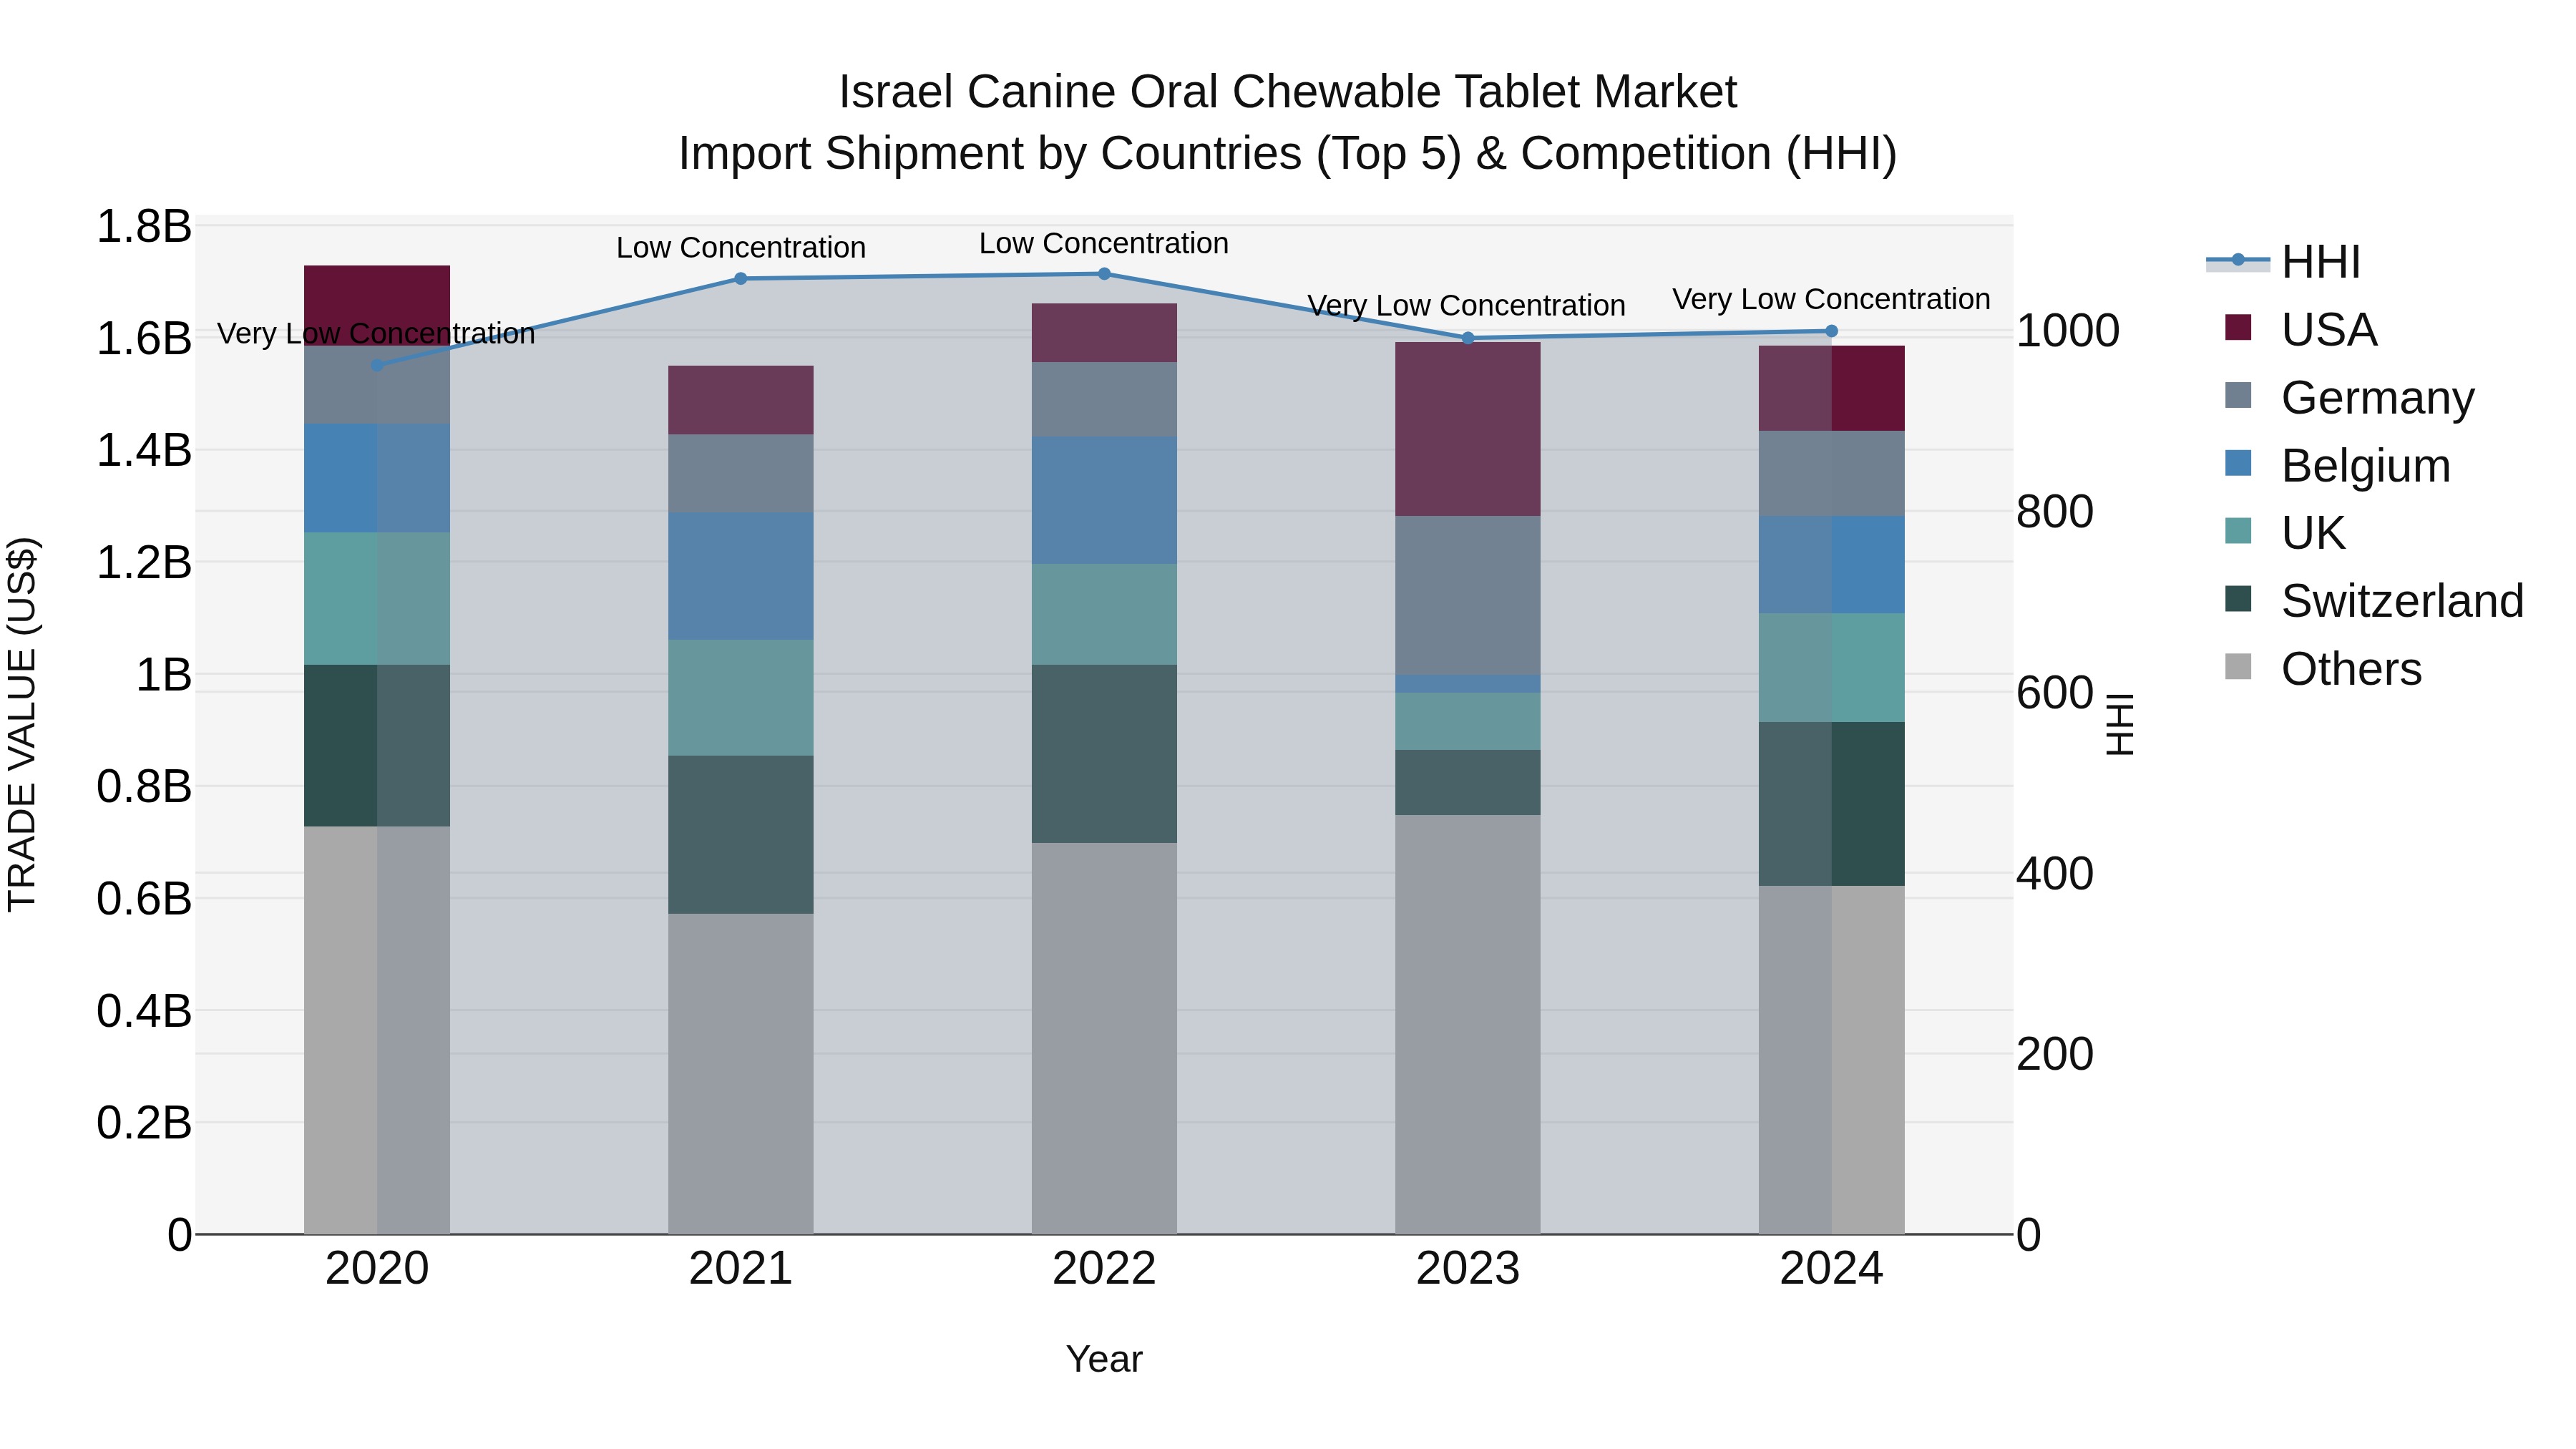
Israel Canine Oral Chewable Tablet Market Top 5 Importing Countries and Market Competition (HHI) Analysis
In 2024, Israel continued to see a diverse range of imports for canine oral chewable tablets, with top suppliers including Switzerland, UK, Belgium, USA, and Germany. Despite the variety of sources, the market concentration, as measured by the HHI, remained low. The compound annual growth rate (CAGR) from 2020 to 2024 was -2.14%, indicating a slight decline in demand over the period. Additionally, the growth rate from 2023 to 2024 was -0.41%, suggesting a further slowdown in the market. Israel`s import market for these products appears stable but with a slight downward trend in recent years.
Key Highlights of the Report:
- Israel Canine Oral Chewable Tablet Market Outlook
- Market Size of Israel Canine Oral Chewable Tablet Market, 2025
- Forecast of Israel Canine Oral Chewable Tablet Market, 2032
- Historical Data and Forecast of Israel Canine Oral Chewable Tablet Revenues & Volume for the Period 2022 - 2032
- Israel Canine Oral Chewable Tablet Market Trend Evolution
- Israel Canine Oral Chewable Tablet Market Drivers and Challenges
- Israel Canine Oral Chewable Tablet Price Trends
- Israel Canine Oral Chewable Tablet Porter's Five Forces
- Israel Canine Oral Chewable Tablet Industry Life Cycle
- Historical Data and Forecast of Israel Canine Oral Chewable Tablet Market Revenues & Volume By Composition Type for the Period 2022 - 2032
- Historical Data and Forecast of Israel Canine Oral Chewable Tablet Market Revenues & Volume By Botanically Synthesized for the Period 2022 - 2032
- Historical Data and Forecast of Israel Canine Oral Chewable Tablet Market Revenues & Volume By Chemically Synthesized for the Period 2022 - 2032
- Historical Data and Forecast of Israel Canine Oral Chewable Tablet Market Revenues & Volume By Drug Type for the Period 2022 - 2032
- Historical Data and Forecast of Israel Canine Oral Chewable Tablet Market Revenues & Volume By Analgesics for the Period 2022 - 2032
- Historical Data and Forecast of Israel Canine Oral Chewable Tablet Market Revenues & Volume By Anti-infective for the Period 2022 - 2032
- Historical Data and Forecast of Israel Canine Oral Chewable Tablet Market Revenues & Volume By Anti-ulcers for the Period 2022 - 2032
- Historical Data and Forecast of Israel Canine Oral Chewable Tablet Market Revenues & Volume By Vitamins and Minerals for the Period 2022 - 2032
- Historical Data and Forecast of Israel Canine Oral Chewable Tablet Market Revenues & Volume By Applications for the Period 2022 - 2032
- Historical Data and Forecast of Israel Canine Oral Chewable Tablet Market Revenues & Volume By Gastrointestinal Diseases for the Period 2022 - 2032
- Historical Data and Forecast of Israel Canine Oral Chewable Tablet Market Revenues & Volume By Infectious Diseases for the Period 2022 - 2032
- Historical Data and Forecast of Israel Canine Oral Chewable Tablet Market Revenues & Volume By Mode of Purchase for the Period 2022 - 2032
- Historical Data and Forecast of Israel Canine Oral Chewable Tablet Market Revenues & Volume By Prescription for the Period 2022 - 2032
- Historical Data and Forecast of Israel Canine Oral Chewable Tablet Market Revenues & Volume By Over the Counter for the Period 2022 - 2032
- Historical Data and Forecast of Israel Canine Oral Chewable Tablet Market Revenues & Volume By Distribution Channel for the Period 2022 - 2032
- Historical Data and Forecast of Israel Canine Oral Chewable Tablet Market Revenues & Volume By Veterinary Clinics for the Period 2022 - 2032
- Historical Data and Forecast of Israel Canine Oral Chewable Tablet Market Revenues & Volume By Veterinary Pharmacies for the Period 2022 - 2032
- Historical Data and Forecast of Israel Canine Oral Chewable Tablet Market Revenues & Volume By Online Veterinary Stores for the Period 2022 - 2032
- Israel Canine Oral Chewable Tablet Import Export Trade Statistics
- Market Opportunity Assessment By Composition Type
- Market Opportunity Assessment By Drug Type
- Market Opportunity Assessment By Applications
- Market Opportunity Assessment By Mode of Purchase
- Market Opportunity Assessment By Distribution Channel
- Israel Canine Oral Chewable Tablet Top Companies Market Share
- Israel Canine Oral Chewable Tablet Competitive Benchmarking By Technical and Operational Parameters
- Israel Canine Oral Chewable Tablet Company Profiles
- Israel Canine Oral Chewable Tablet Key Strategic Recommendations
Frequently Asked Questions About the Market Study (FAQs):
6Wresearch actively monitors the Israel Canine Oral Chewable Tablet Market and publishes its comprehensive annual report, highlighting emerging trends, growth drivers, revenue analysis, and forecast outlook. Our insights help businesses to make data-backed strategic decisions with ongoing market dynamics. Our analysts track relevent industries related to the Israel Canine Oral Chewable Tablet Market, allowing our clients with actionable intelligence and reliable forecasts tailored to emerging regional needs.
Yes, we provide customisation as per your requirements. To learn more, feel free to contact us on sales@6wresearch.com
1 Executive Summary |
2 Introduction |
2.1 Key Highlights of the Report |
2.2 Report Description |
2.3 Market Scope & Segmentation |
2.4 Research Methodology |
2.5 Assumptions |
3 Israel Canine Oral Chewable Tablet Market Overview |
3.1 Israel Country Macro Economic Indicators |
3.2 Israel Canine Oral Chewable Tablet Market Revenues & Volume, 2022 & 2032F |
3.3 Israel Canine Oral Chewable Tablet Market - Industry Life Cycle |
3.4 Israel Canine Oral Chewable Tablet Market - Porter's Five Forces |
3.5 Israel Canine Oral Chewable Tablet Market Revenues & Volume Share, By Composition Type, 2022 & 2032F |
3.6 Israel Canine Oral Chewable Tablet Market Revenues & Volume Share, By Drug Type, 2022 & 2032F |
3.7 Israel Canine Oral Chewable Tablet Market Revenues & Volume Share, By Applications, 2022 & 2032F |
3.8 Israel Canine Oral Chewable Tablet Market Revenues & Volume Share, By Mode of Purchase, 2022 & 2032F |
3.9 Israel Canine Oral Chewable Tablet Market Revenues & Volume Share, By Distribution Channel, 2022 & 2032F |
4 Israel Canine Oral Chewable Tablet Market Dynamics |
4.1 Impact Analysis |
4.2 Market Drivers |
4.2.1 Increasing pet ownership in Israel |
4.2.2 Growing awareness about pet health and wellness |
4.2.3 Rising demand for convenient and easy-to-administer pet medications |
4.3 Market Restraints |
4.3.1 Stringent regulations and approval processes for veterinary products |
4.3.2 Competition from alternative forms of pet medications |
4.3.3 Price sensitivity among pet owners |
5 Israel Canine Oral Chewable Tablet Market Trends |
6 Israel Canine Oral Chewable Tablet Market, By Types |
6.1 Israel Canine Oral Chewable Tablet Market, By Composition Type |
6.1.1 Overview and Analysis |
6.1.2 Israel Canine Oral Chewable Tablet Market Revenues & Volume, By Composition Type, 2022 - 2032F |
6.1.3 Israel Canine Oral Chewable Tablet Market Revenues & Volume, By Botanically Synthesized, 2022 - 2032F |
6.1.4 Israel Canine Oral Chewable Tablet Market Revenues & Volume, By Chemically Synthesized, 2022 - 2032F |
6.2 Israel Canine Oral Chewable Tablet Market, By Drug Type |
6.2.1 Overview and Analysis |
6.2.2 Israel Canine Oral Chewable Tablet Market Revenues & Volume, By Analgesics, 2022 - 2032F |
6.2.3 Israel Canine Oral Chewable Tablet Market Revenues & Volume, By Anti-infective, 2022 - 2032F |
6.2.4 Israel Canine Oral Chewable Tablet Market Revenues & Volume, By Anti-ulcers, 2022 - 2032F |
6.2.5 Israel Canine Oral Chewable Tablet Market Revenues & Volume, By Vitamins and Minerals, 2022 - 2032F |
6.3 Israel Canine Oral Chewable Tablet Market, By Applications |
6.3.1 Overview and Analysis |
6.3.2 Israel Canine Oral Chewable Tablet Market Revenues & Volume, By Gastrointestinal Diseases, 2022 - 2032F |
6.3.3 Israel Canine Oral Chewable Tablet Market Revenues & Volume, By Infectious Diseases, 2022 - 2032F |
6.4 Israel Canine Oral Chewable Tablet Market, By Mode of Purchase |
6.4.1 Overview and Analysis |
6.4.2 Israel Canine Oral Chewable Tablet Market Revenues & Volume, By Prescription, 2022 - 2032F |
6.4.3 Israel Canine Oral Chewable Tablet Market Revenues & Volume, By Over the Counter, 2022 - 2032F |
6.5 Israel Canine Oral Chewable Tablet Market, By Distribution Channel |
6.5.1 Overview and Analysis |
6.5.2 Israel Canine Oral Chewable Tablet Market Revenues & Volume, By Veterinary Clinics, 2022 - 2032F |
6.5.3 Israel Canine Oral Chewable Tablet Market Revenues & Volume, By Veterinary Pharmacies, 2022 - 2032F |
6.5.4 Israel Canine Oral Chewable Tablet Market Revenues & Volume, By Online Veterinary Stores, 2022 - 2032F |
7 Israel Canine Oral Chewable Tablet Market Import-Export Trade Statistics |
7.1 Israel Canine Oral Chewable Tablet Market Export to Major Countries |
7.2 Israel Canine Oral Chewable Tablet Market Imports from Major Countries |
8 Israel Canine Oral Chewable Tablet Market Key Performance Indicators |
8.1 Number of veterinary clinics prescribing canine oral chewable tablets |
8.2 Rate of adoption of new canine oral chewable tablet formulations |
8.3 Customer satisfaction and repeat purchase rate for canine oral chewable tablets |
9 Israel Canine Oral Chewable Tablet Market - Opportunity Assessment |
9.1 Israel Canine Oral Chewable Tablet Market Opportunity Assessment, By Composition Type, 2022 & 2032F |
9.2 Israel Canine Oral Chewable Tablet Market Opportunity Assessment, By Drug Type, 2022 & 2032F |
9.3 Israel Canine Oral Chewable Tablet Market Opportunity Assessment, By Applications, 2022 & 2032F |
9.4 Israel Canine Oral Chewable Tablet Market Opportunity Assessment, By Mode of Purchase, 2022 & 2032F |
9.5 Israel Canine Oral Chewable Tablet Market Opportunity Assessment, By Distribution Channel, 2022 & 2032F |
10 Israel Canine Oral Chewable Tablet Market - Competitive Landscape |
10.1 Israel Canine Oral Chewable Tablet Market Revenue Share, By Companies, 2025 |
10.2 Israel Canine Oral Chewable Tablet Market Competitive Benchmarking, By Operating and Technical Parameters |
11 Company Profiles |
12 Recommendations |
13 Disclaimer |
Export potential assessment - trade Analytics for 2030
Export potential enables firms to identify high-growth global markets with greater confidence by combining advanced trade intelligence with a structured quantitative methodology. The framework analyzes emerging demand trends and country-level import patterns while integrating macroeconomic and trade datasets such as GDP and population forecasts, bilateral import–export flows, tariff structures, elasticity differentials between developed and developing economies, geographic distance, and import demand projections. Using weighted trade values from 2020–2024 as the base period to project country-to-country export potential for 2030, these inputs are operationalized through calculated drivers such as gravity model parameters, tariff impact factors, and projected GDP per-capita growth. Through an analysis of hidden potentials, demand hotspots, and market conditions that are most favorable to success, this method enables firms to focus on target countries, maximize returns, and global expansion with data, backed by accuracy.
By factoring in the projected importer demand gap that is currently unmet and could be potential opportunity, it identifies the potential for the Exporter (Country) among 190 countries, against the general trade analysis, which identifies the biggest importer or exporter.
To discover high-growth global markets and optimize your business strategy:
Click Here
Pricing
- Single User License$ 1,995
- Department License$ 2,400
- Site License$ 3,120
- Global License$ 3,795

Search
Thought Leadership and Analyst Meet


Our Clients
Latest Reports
- China Electric Appliance Rental Market (2026-2032) | Trends, Revenue, Growth, Challenges, Size, Value, Outlook, Pricing, Strategy, Insights, Restraints, segmentation, Companies, Investment Opportunities, Analysis, Demand, Drivers, Competition, Forecast, Share
- Chile Electric Appliance Rental Market (2026-2032) | Outlook, Competition, Drivers, Strategy, Revenue, Analysis, Value, Pricing, Restraints, Size, Demand, Share, Growth, Forecast, Challenges, Insights, Investment Opportunities, Companies, Trends, segmentation
- Cambodia Electric Appliance Rental Market (2026-2032) | Companies, Analysis, Restraints, Pricing, Insights, Challenges, Outlook, Strategy, Forecast, Trends, Competition, Value, Revenue, Investment Opportunities, segmentation, Drivers, Size, Demand, Growth, Share
- Brazil Electric Appliance Rental Market (2026-2032) | Revenue, Strategy, Forecast, Companies, segmentation, Competition, Size, Investment Opportunities, Pricing, Restraints, Outlook, Challenges, Analysis, Drivers, Value, Demand, Insights, Trends, Growth, Share
- Bangladesh Electric Appliance Rental Market (2026-2032) | Drivers, Forecast, Investment Opportunities, Strategy, Insights, Demand, Challenges, Outlook, Trends, Competition, Value, Revenue, Size, Pricing, Analysis, Companies, Restraints, segmentation, Share, Growth
- Bahrain Electric Appliance Rental Market (2026-2032) | Outlook, Size, Competition, Restraints, Drivers, Value, Trends, Investment Opportunities, Insights, Forecast, Revenue, Strategy, Growth, Share, Demand, Analysis, Challenges, Companies, segmentation, Pricing
- Azerbaijan Electric Appliance Rental Market (2026-2032) | Trends, Investment Opportunities, Restraints, Insights, Strategy, Competition, Value, Growth, Demand, Drivers, Analysis, Forecast, Size, Share, Outlook, segmentation, Pricing, Challenges, Revenue, Companies
- Australia Electric Appliance Rental Market (2026-2032) | Challenges, Restraints, Forecast, Demand, Size, Competition, Pricing, Investment Opportunities, Revenue, Trends, Drivers, Growth, Outlook, Analysis, Strategy, Value, segmentation, Insights, Companies, Share
- Argentina Electric Appliance Rental Market (2026-2032) | Growth, Trends, Insights, Outlook, Forecast, Size, Drivers, Analysis, Restraints, Challenges, Share, Revenue, Investment Opportunities, Strategy, Demand, Value, Companies, segmentation, Competition, Pricing
- Algeria Electric Appliance Rental Market (2026-2032) | Share, Size, Value, Strategy, Competition, Outlook, Challenges, Companies, Trends, Pricing, Insights, Forecast, Investment Opportunities, Revenue, Growth, Restraints, segmentation, Analysis, Demand, Drivers
Industry Events and Analyst Meet

HIMTEX 2026

India Refining Summit 2026

India EV Show 2026

EV tech India Expo 2026

Auto Tech Asia 2026
Whitepaper
- Middle East & Africa Commercial Security Market Click here to view more.
- Middle East & Africa Fire Safety Systems & Equipment Market Click here to view more.
- GCC Drone Market Click here to view more.
- Middle East Lighting Fixture Market Click here to view more.
- GCC Physical & Perimeter Security Market Click here to view more.
6WResearch In News
- Doha a strategic location for EV manufacturing hub: IPA Qatar
- Demand for luxury TVs surging in the GCC, says Samsung
- Empowering Growth: The Thriving Journey of Bangladesh’s Cable Industry
- Demand for luxury TVs surging in the GCC, says Samsung
- Video call with a traditional healer? Once unthinkable, it’s now common in South Africa
- Intelligent Buildings To Smooth GCC’s Path To Net Zero