Israel Fruit Pulp Market (2025-2031) | Analysis, Revenue, Segmentation, Industry, Outlook, Trends, Value, Companies, Forecast, Share, Growth & Size
Market Forecast By Fruit Type (Mango, Strawberry, Apple, Guava, Berries, Citrus Fruits, Others), By Form (Liquid, Powder), By Application (Food and Beverages), By Distribution (E-Commerce, Convenience Stores, Supermarkets/Hypermarkets, Specialty Stores, Others) And Competitive Landscape
| Product Code: ETC5015478 | Publication Date: Nov 2023 | Updated Date: Nov 2025 | Product Type: Market Research Report | |
| Publisher: 6Wresearch | Author: Shubham Padhi | No. of Pages: 60 | No. of Figures: 30 | No. of Tables: 5 |
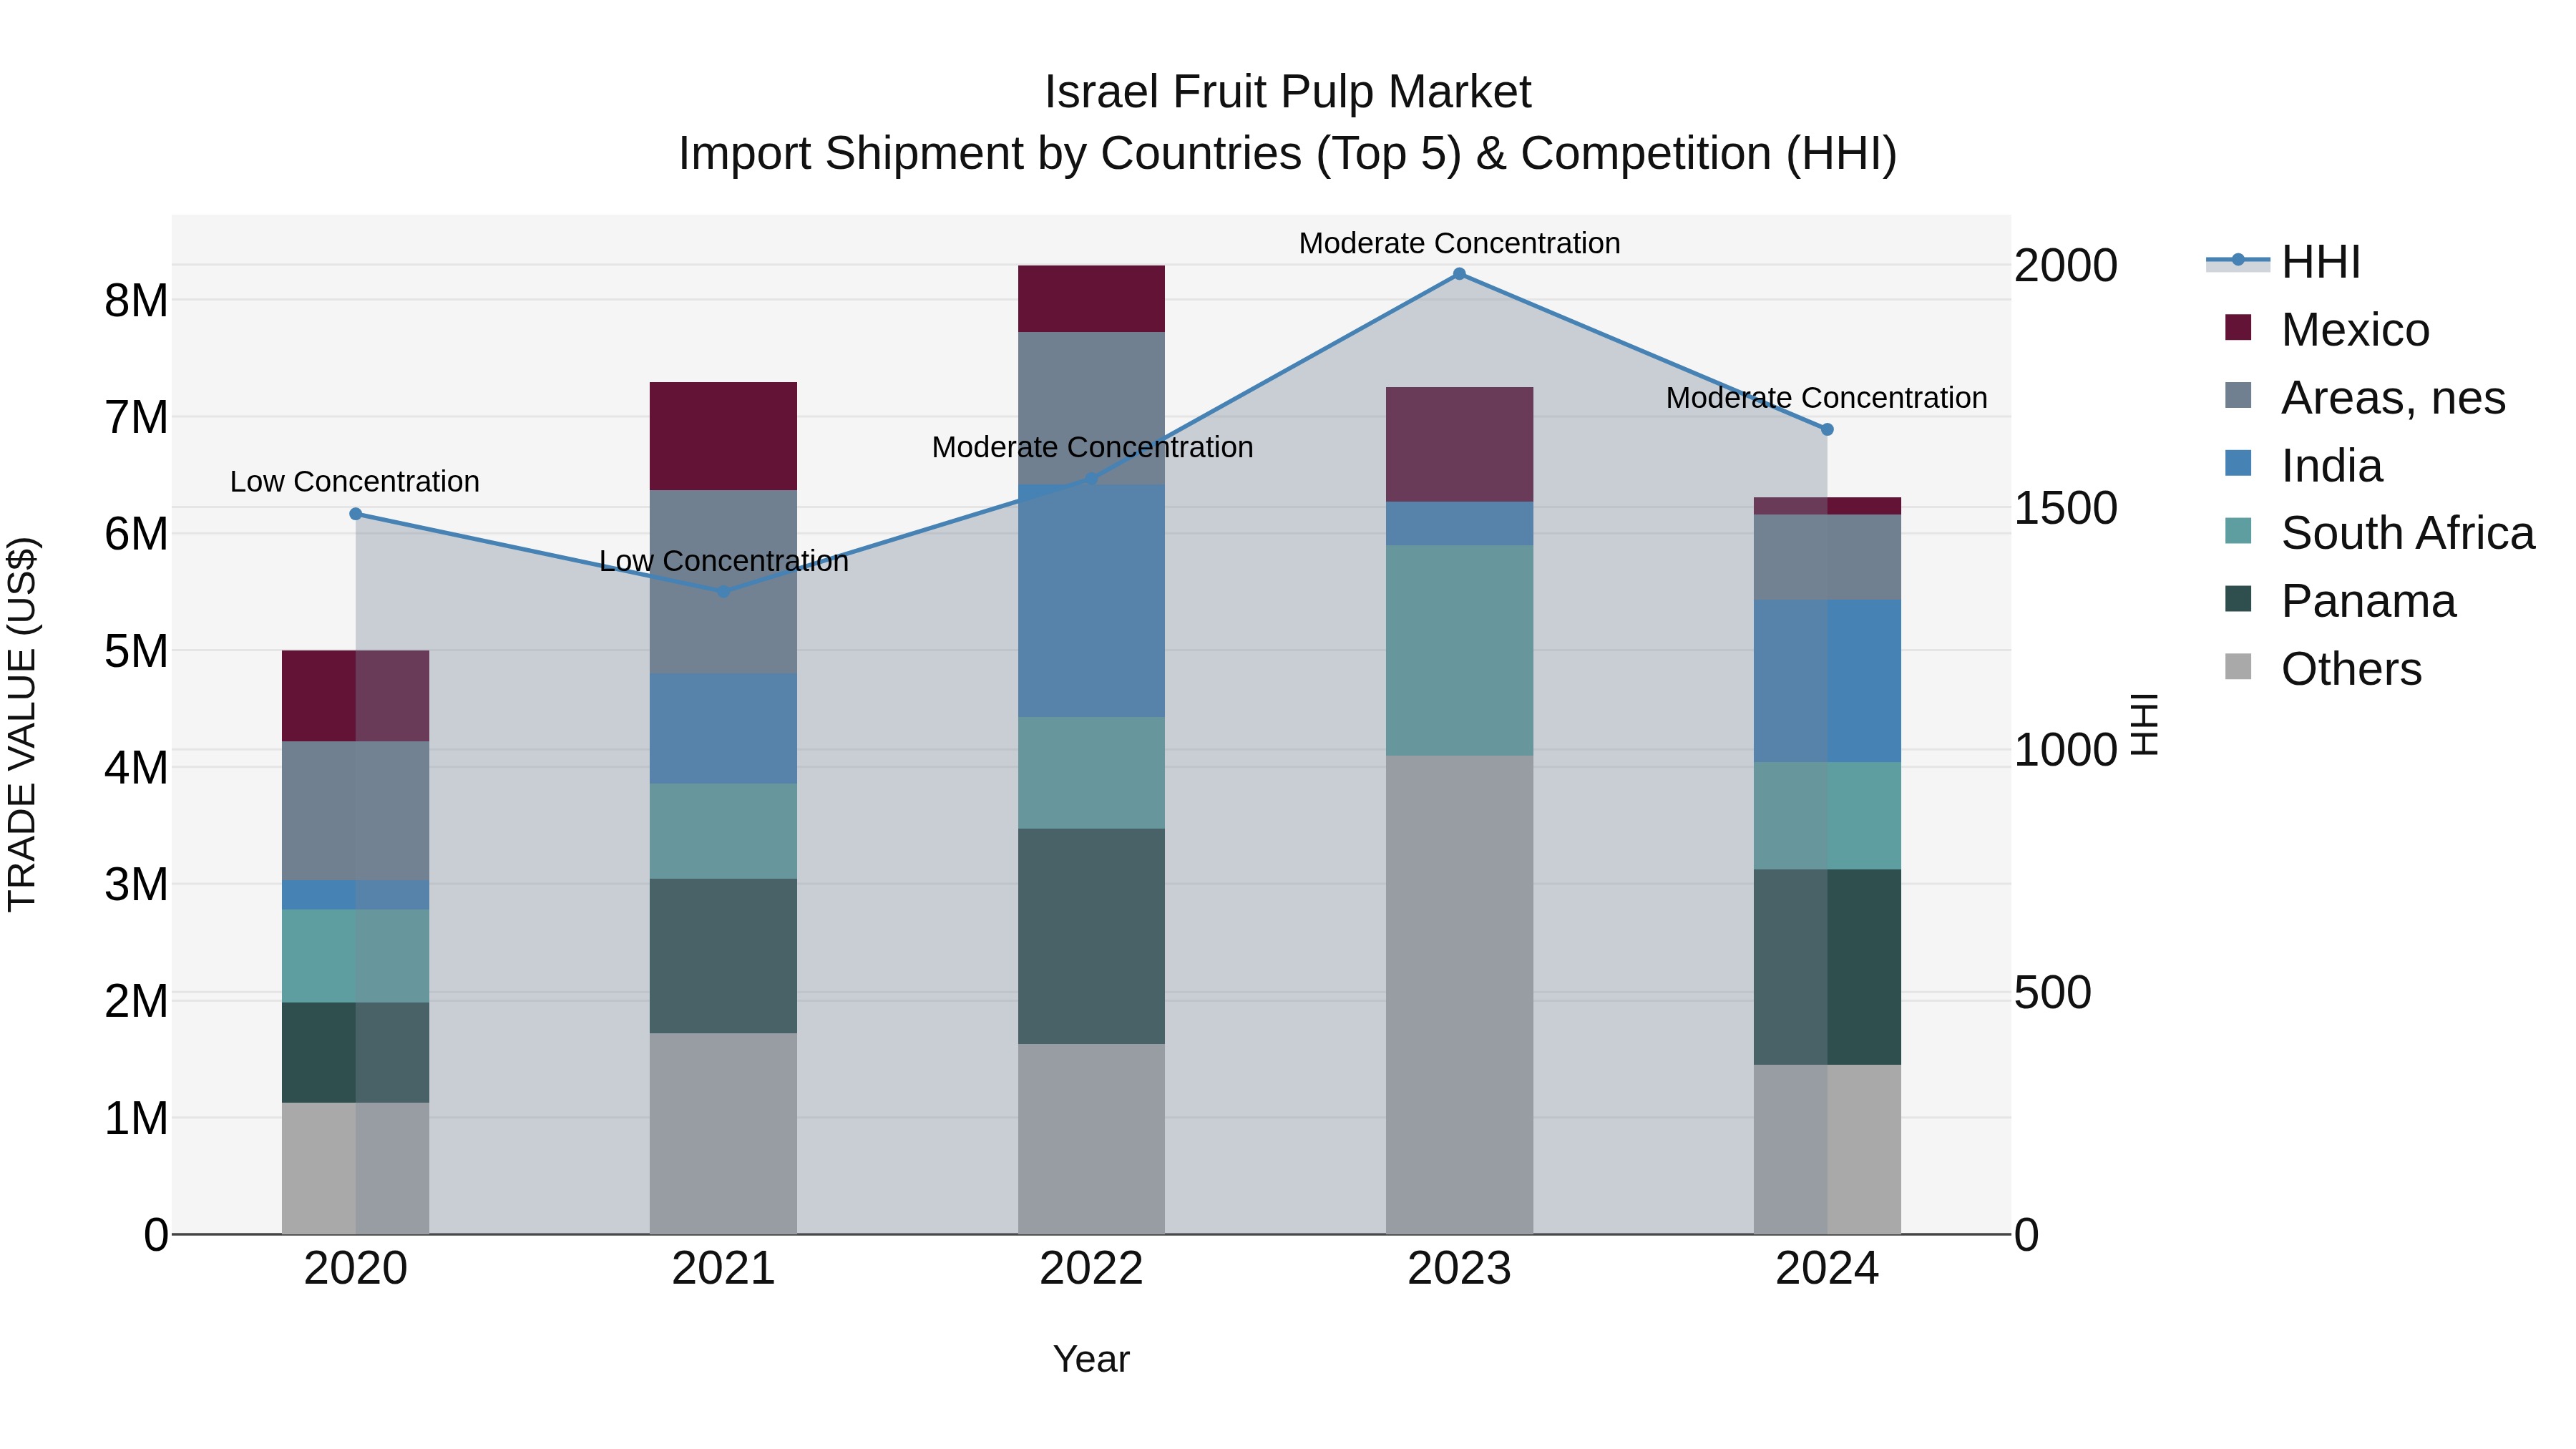
Israel Fruit Pulp Market Top 5 Importing Countries and Market Competition (HHI) Analysis
Israel`s fruit pulp import market saw a diverse range of top exporting countries in 2024, including Panama, India, South Africa, Areas, nes, and Germany. Despite moderate concentration levels, the market experienced a healthy compound annual growth rate (CAGR) of 5.99% from 2020 to 2024. However, there was a slight decline in growth rate from 2023 to 2024 at -13.03%. This data suggests a dynamic and evolving market landscape, with potential opportunities for further growth and strategic partnerships in the fruit pulp import sector.
Israel Fruit Pulp Market Synopsis
Fruit pulp in Israel is used in the food and beverage industry to produce juices, purees, and flavorings. This market provides high-quality fruit products that enhance the taste and nutritional value of various food items, supporting both domestic consumption and export.
Drivers of the market
The Israel Fruit Pulp Market is expanding as consumers seek convenient and healthy food options, driving demand for fruit pulp in beverages, desserts, and food processing.
Challenges of the market
Challenges in the fruit pulp market include ensuring fruit pulp quality and consistency, addressing concerns regarding pulp contamination and spoilage, and managing supply chain disruptions in fruit sourcing and processing. Developing innovative fruit processing technologies and expanding into new application areas such as smoothies and desserts can help drive market growth.
Government Policy of the market
Government policies in Israel support the production and export of fruit pulp through investment incentives, infrastructure development, and trade partnerships. Initiatives aim to enhance product quality, supply chain efficiency, and market access for local fruit processors in domestic and international markets.
Key Highlights of the Report:
- Israel Fruit Pulp Market Outlook
- Market Size of Israel Fruit Pulp Market, 2024
- Forecast of Israel Fruit Pulp Market, 2031
- Historical Data and Forecast of Israel Fruit Pulp Revenues & Volume for the Period 2021-2031
- Israel Fruit Pulp Market Trend Evolution
- Israel Fruit Pulp Market Drivers and Challenges
- Israel Fruit Pulp Price Trends
- Israel Fruit Pulp Porter`s Five Forces
- Israel Fruit Pulp Industry Life Cycle
- Historical Data and Forecast of Israel Fruit Pulp Market Revenues & Volume By Fruit Type for the Period 2021-2031
- Historical Data and Forecast of Israel Fruit Pulp Market Revenues & Volume By Mango for the Period 2021-2031
- Historical Data and Forecast of Israel Fruit Pulp Market Revenues & Volume By Strawberry for the Period 2021-2031
- Historical Data and Forecast of Israel Fruit Pulp Market Revenues & Volume By Apple for the Period 2021-2031
- Historical Data and Forecast of Israel Fruit Pulp Market Revenues & Volume By Guava for the Period 2021-2031
- Historical Data and Forecast of Israel Fruit Pulp Market Revenues & Volume By Berries for the Period 2021-2031
- Historical Data and Forecast of Israel Fruit Pulp Market Revenues & Volume By Citrus Fruits for the Period 2021-2031
- Historical Data and Forecast of Israel Fruit Pulp Market Revenues & Volume By Others for the Period 2021-2031
- Historical Data and Forecast of Israel Fruit Pulp Market Revenues & Volume By Form for the Period 2021-2031
- Historical Data and Forecast of Israel Fruit Pulp Market Revenues & Volume By Liquid for the Period 2021-2031
- Historical Data and Forecast of Israel Fruit Pulp Market Revenues & Volume By Powder for the Period 2021-2031
- Historical Data and Forecast of Israel Fruit Pulp Market Revenues & Volume By Application for the Period 2021-2031
- Historical Data and Forecast of Israel Fruit Pulp Market Revenues & Volume By Food and Beverages for the Period 2021-2031
- Historical Data and Forecast of Israel Fruit Pulp Market Revenues & Volume By Distribution for the Period 2021-2031
- Historical Data and Forecast of Israel Fruit Pulp Market Revenues & Volume By E-Commerce for the Period 2021-2031
- Historical Data and Forecast of Israel Fruit Pulp Market Revenues & Volume By Convenience Stores for the Period 2021-2031
- Historical Data and Forecast of Israel Fruit Pulp Market Revenues & Volume By Supermarkets/Hypermarkets for the Period 2021-2031
- Historical Data and Forecast of Israel Fruit Pulp Market Revenues & Volume By Specialty Stores for the Period 2021-2031
- Historical Data and Forecast of Israel Fruit Pulp Market Revenues & Volume By Others for the Period 2021-2031
- Israel Fruit Pulp Import Export Trade Statistics
- Market Opportunity Assessment By Fruit Type
- Market Opportunity Assessment By Form
- Market Opportunity Assessment By Application
- Market Opportunity Assessment By Distribution
- Israel Fruit Pulp Top Companies Market Share
- Israel Fruit Pulp Competitive Benchmarking By Technical and Operational Parameters
- Israel Fruit Pulp Company Profiles
- Israel Fruit Pulp Key Strategic Recommendations
Frequently Asked Questions About the Market Study (FAQs):
6Wresearch actively monitors the Israel Fruit Pulp Market and publishes its comprehensive annual report, highlighting emerging trends, growth drivers, revenue analysis, and forecast outlook. Our insights help businesses to make data-backed strategic decisions with ongoing market dynamics. Our analysts track relevent industries related to the Israel Fruit Pulp Market, allowing our clients with actionable intelligence and reliable forecasts tailored to emerging regional needs.
Yes, we provide customisation as per your requirements. To learn more, feel free to contact us on sales@6wresearch.com
1 Executive Summary |
2 Introduction |
2.1 Key Highlights of the Report |
2.2 Report Description |
2.3 Market Scope & Segmentation |
2.4 Research Methodology |
2.5 Assumptions |
3 Israel Fruit Pulp Market Overview |
3.1 Israel Country Macro Economic Indicators |
3.2 Israel Fruit Pulp Market Revenues & Volume, 2021 & 2031F |
3.3 Israel Fruit Pulp Market - Industry Life Cycle |
3.4 Israel Fruit Pulp Market - Porter's Five Forces |
3.5 Israel Fruit Pulp Market Revenues & Volume Share, By Fruit Type, 2021 & 2031F |
3.6 Israel Fruit Pulp Market Revenues & Volume Share, By Form, 2021 & 2031F |
3.7 Israel Fruit Pulp Market Revenues & Volume Share, By Application, 2021 & 2031F |
3.8 Israel Fruit Pulp Market Revenues & Volume Share, By Distribution, 2021 & 2031F |
4 Israel Fruit Pulp Market Dynamics |
4.1 Impact Analysis |
4.2 Market Drivers |
4.2.1 Growing consumer awareness towards health benefits of fruit pulp |
4.2.2 Increasing demand for natural and organic food products |
4.2.3 Rising popularity of fruit-based beverages and smoothies in Israel |
4.3 Market Restraints |
4.3.1 Seasonal availability and fluctuating prices of fruits impacting production costs |
4.3.2 Challenges in sourcing high-quality and consistent fruit supply for pulp production |
5 Israel Fruit Pulp Market Trends |
6 Israel Fruit Pulp Market Segmentations |
6.1 Israel Fruit Pulp Market, By Fruit Type |
6.1.1 Overview and Analysis |
6.1.2 Israel Fruit Pulp Market Revenues & Volume, By Mango, 2021-2031F |
6.1.3 Israel Fruit Pulp Market Revenues & Volume, By Strawberry, 2021-2031F |
6.1.4 Israel Fruit Pulp Market Revenues & Volume, By Apple, 2021-2031F |
6.1.5 Israel Fruit Pulp Market Revenues & Volume, By Guava, 2021-2031F |
6.1.6 Israel Fruit Pulp Market Revenues & Volume, By Berries, 2021-2031F |
6.1.7 Israel Fruit Pulp Market Revenues & Volume, By Citrus Fruits, 2021-2031F |
6.2 Israel Fruit Pulp Market, By Form |
6.2.1 Overview and Analysis |
6.2.2 Israel Fruit Pulp Market Revenues & Volume, By Liquid, 2021-2031F |
6.2.3 Israel Fruit Pulp Market Revenues & Volume, By Powder, 2021-2031F |
6.3 Israel Fruit Pulp Market, By Application |
6.3.1 Overview and Analysis |
6.3.2 Israel Fruit Pulp Market Revenues & Volume, By Food and Beverages, 2021-2031F |
6.4 Israel Fruit Pulp Market, By Distribution |
6.4.1 Overview and Analysis |
6.4.2 Israel Fruit Pulp Market Revenues & Volume, By E-Commerce, 2021-2031F |
6.4.3 Israel Fruit Pulp Market Revenues & Volume, By Convenience Stores, 2021-2031F |
6.4.4 Israel Fruit Pulp Market Revenues & Volume, By Supermarkets/Hypermarkets, 2021-2031F |
6.4.5 Israel Fruit Pulp Market Revenues & Volume, By Specialty Stores, 2021-2031F |
6.4.6 Israel Fruit Pulp Market Revenues & Volume, By Others, 2021-2031F |
7 Israel Fruit Pulp Market Import-Export Trade Statistics |
7.1 Israel Fruit Pulp Market Export to Major Countries |
7.2 Israel Fruit Pulp Market Imports from Major Countries |
8 Israel Fruit Pulp Market Key Performance Indicators |
8.1 Percentage of market penetration in the health and wellness sector |
8.2 Consumer satisfaction levels with fruit pulp products |
8.3 Number of new product launches and innovations in the fruit pulp market |
8.4 Average time taken from fruit sourcing to final product delivery |
8.5 Sustainability metrics related to fruit sourcing and production processes |
9 Israel Fruit Pulp Market - Opportunity Assessment |
9.1 Israel Fruit Pulp Market Opportunity Assessment, By Fruit Type, 2021 & 2031F |
9.2 Israel Fruit Pulp Market Opportunity Assessment, By Form, 2021 & 2031F |
9.3 Israel Fruit Pulp Market Opportunity Assessment, By Application, 2021 & 2031F |
9.4 Israel Fruit Pulp Market Opportunity Assessment, By Distribution, 2021 & 2031F |
10 Israel Fruit Pulp Market - Competitive Landscape |
10.1 Israel Fruit Pulp Market Revenue Share, By Companies, 2024 |
10.2 Israel Fruit Pulp Market Competitive Benchmarking, By Operating and Technical Parameters |
11 Company Profiles |
12 Recommendations | 13 Disclaimer |
Global Go To Market Strategy - 2030
Export potential enables firms to identify high-growth global markets with greater confidence by combining advanced trade intelligence with a structured quantitative methodology. The framework analyzes emerging demand trends and country-level import patterns while integrating macroeconomic and trade datasets such as GDP and population forecasts, bilateral import–export flows, tariff structures, elasticity differentials between developed and developing economies, geographic distance, and import demand projections. Using weighted trade values from 2020–2024 as the base period to project country-to-country export potential for 2030, these inputs are operationalized through calculated drivers such as gravity model parameters, tariff impact factors, and projected GDP per-capita growth. Through an analysis of hidden potentials, demand hotspots, and market conditions that are most favorable to success, this method enables firms to focus on target countries, maximize returns, and global expansion with data, backed by accuracy.
By factoring in the projected importer demand gap that is currently unmet and could be potential opportunity, it identifies the potential for the Exporter (Country) among 190 countries, against the general trade analysis, which identifies the biggest importer or exporter.
To discover high-growth global markets and optimize your business strategy:
Click Here
Pricing
- Single User License$ 1,995
- Department License$ 2,400
- Site License$ 3,120
- Global License$ 3,795

Leadership Perspectives from Industry Events
Search
Thought Leadership and Analyst Meet


Our Clients
6WResearch In News
- Doha a strategic location for EV manufacturing hub: IPA Qatar
- Demand for luxury TVs surging in the GCC, says Samsung
- Empowering Growth: The Thriving Journey of Bangladesh’s Cable Industry
- Demand for luxury TVs surging in the GCC, says Samsung
- Video call with a traditional healer? Once unthinkable, it’s now common in South Africa
- Intelligent Buildings To Smooth GCC’s Path To Net Zero
Latest Reports
- Cape Verde Portable Hand-Thrown Extinguisher Market (2026-2032)
- Canada Portable Hand-Thrown Extinguisher Market (2026-2032)
- Cameroon Portable Hand-Thrown Extinguisher Market (2026-2032)
- Burundi Portable Hand-Thrown Extinguisher Market (2026-2032)
- Burkina Faso Portable Hand-Thrown Extinguisher Market (2026-2032)
- Bulgaria Portable Hand-Thrown Extinguisher Market (2026-2032)
- Brunei Portable Hand-Thrown Extinguisher Market (2026-2032)
- Botswana Portable Hand-Thrown Extinguisher Market (2026-2032)
- Bosnia and Herzegovina Portable Hand-Thrown Extinguisher Market (2026-2032)
- Bolivia Portable Hand-Thrown Extinguisher Market (2026-2032)
Industry Events and Analyst Meet

HIMTEX 2026

India Refining Summit 2026

India EV Show 2026

EV tech India Expo 2026

Auto Tech Asia 2026
Whitepaper
- Middle East & Africa Commercial Security Market Click here to view more.
- Middle East & Africa Fire Safety Systems & Equipment Market Click here to view more.
- GCC Drone Market Click here to view more.
- Middle East Lighting Fixture Market Click here to view more.
- GCC Physical & Perimeter Security Market Click here to view more.