Italy Inventory Tags Market (2026-2032) Outlook | Value, Growth, Industry, Share, Revenue, Size, Trends, Companies, Forecast & Analysis
Market Forecast By Technology (Barcodes, RFID), By Label Type (Plastic, Paper, Metal), By Printing technology (Digital Printing, Flexography, Lithography, Screen Printing, Gravure, Others) And Competitive Landscape
| Product Code: ETC4601294 | Publication Date: Jul 2023 | Updated Date: Mar 2026 | Product Type: Report | |
| Publisher: 6Wresearch | Author: Summon Dutta | No. of Pages: 85 | No. of Figures: 45 | No. of Tables: 25 |
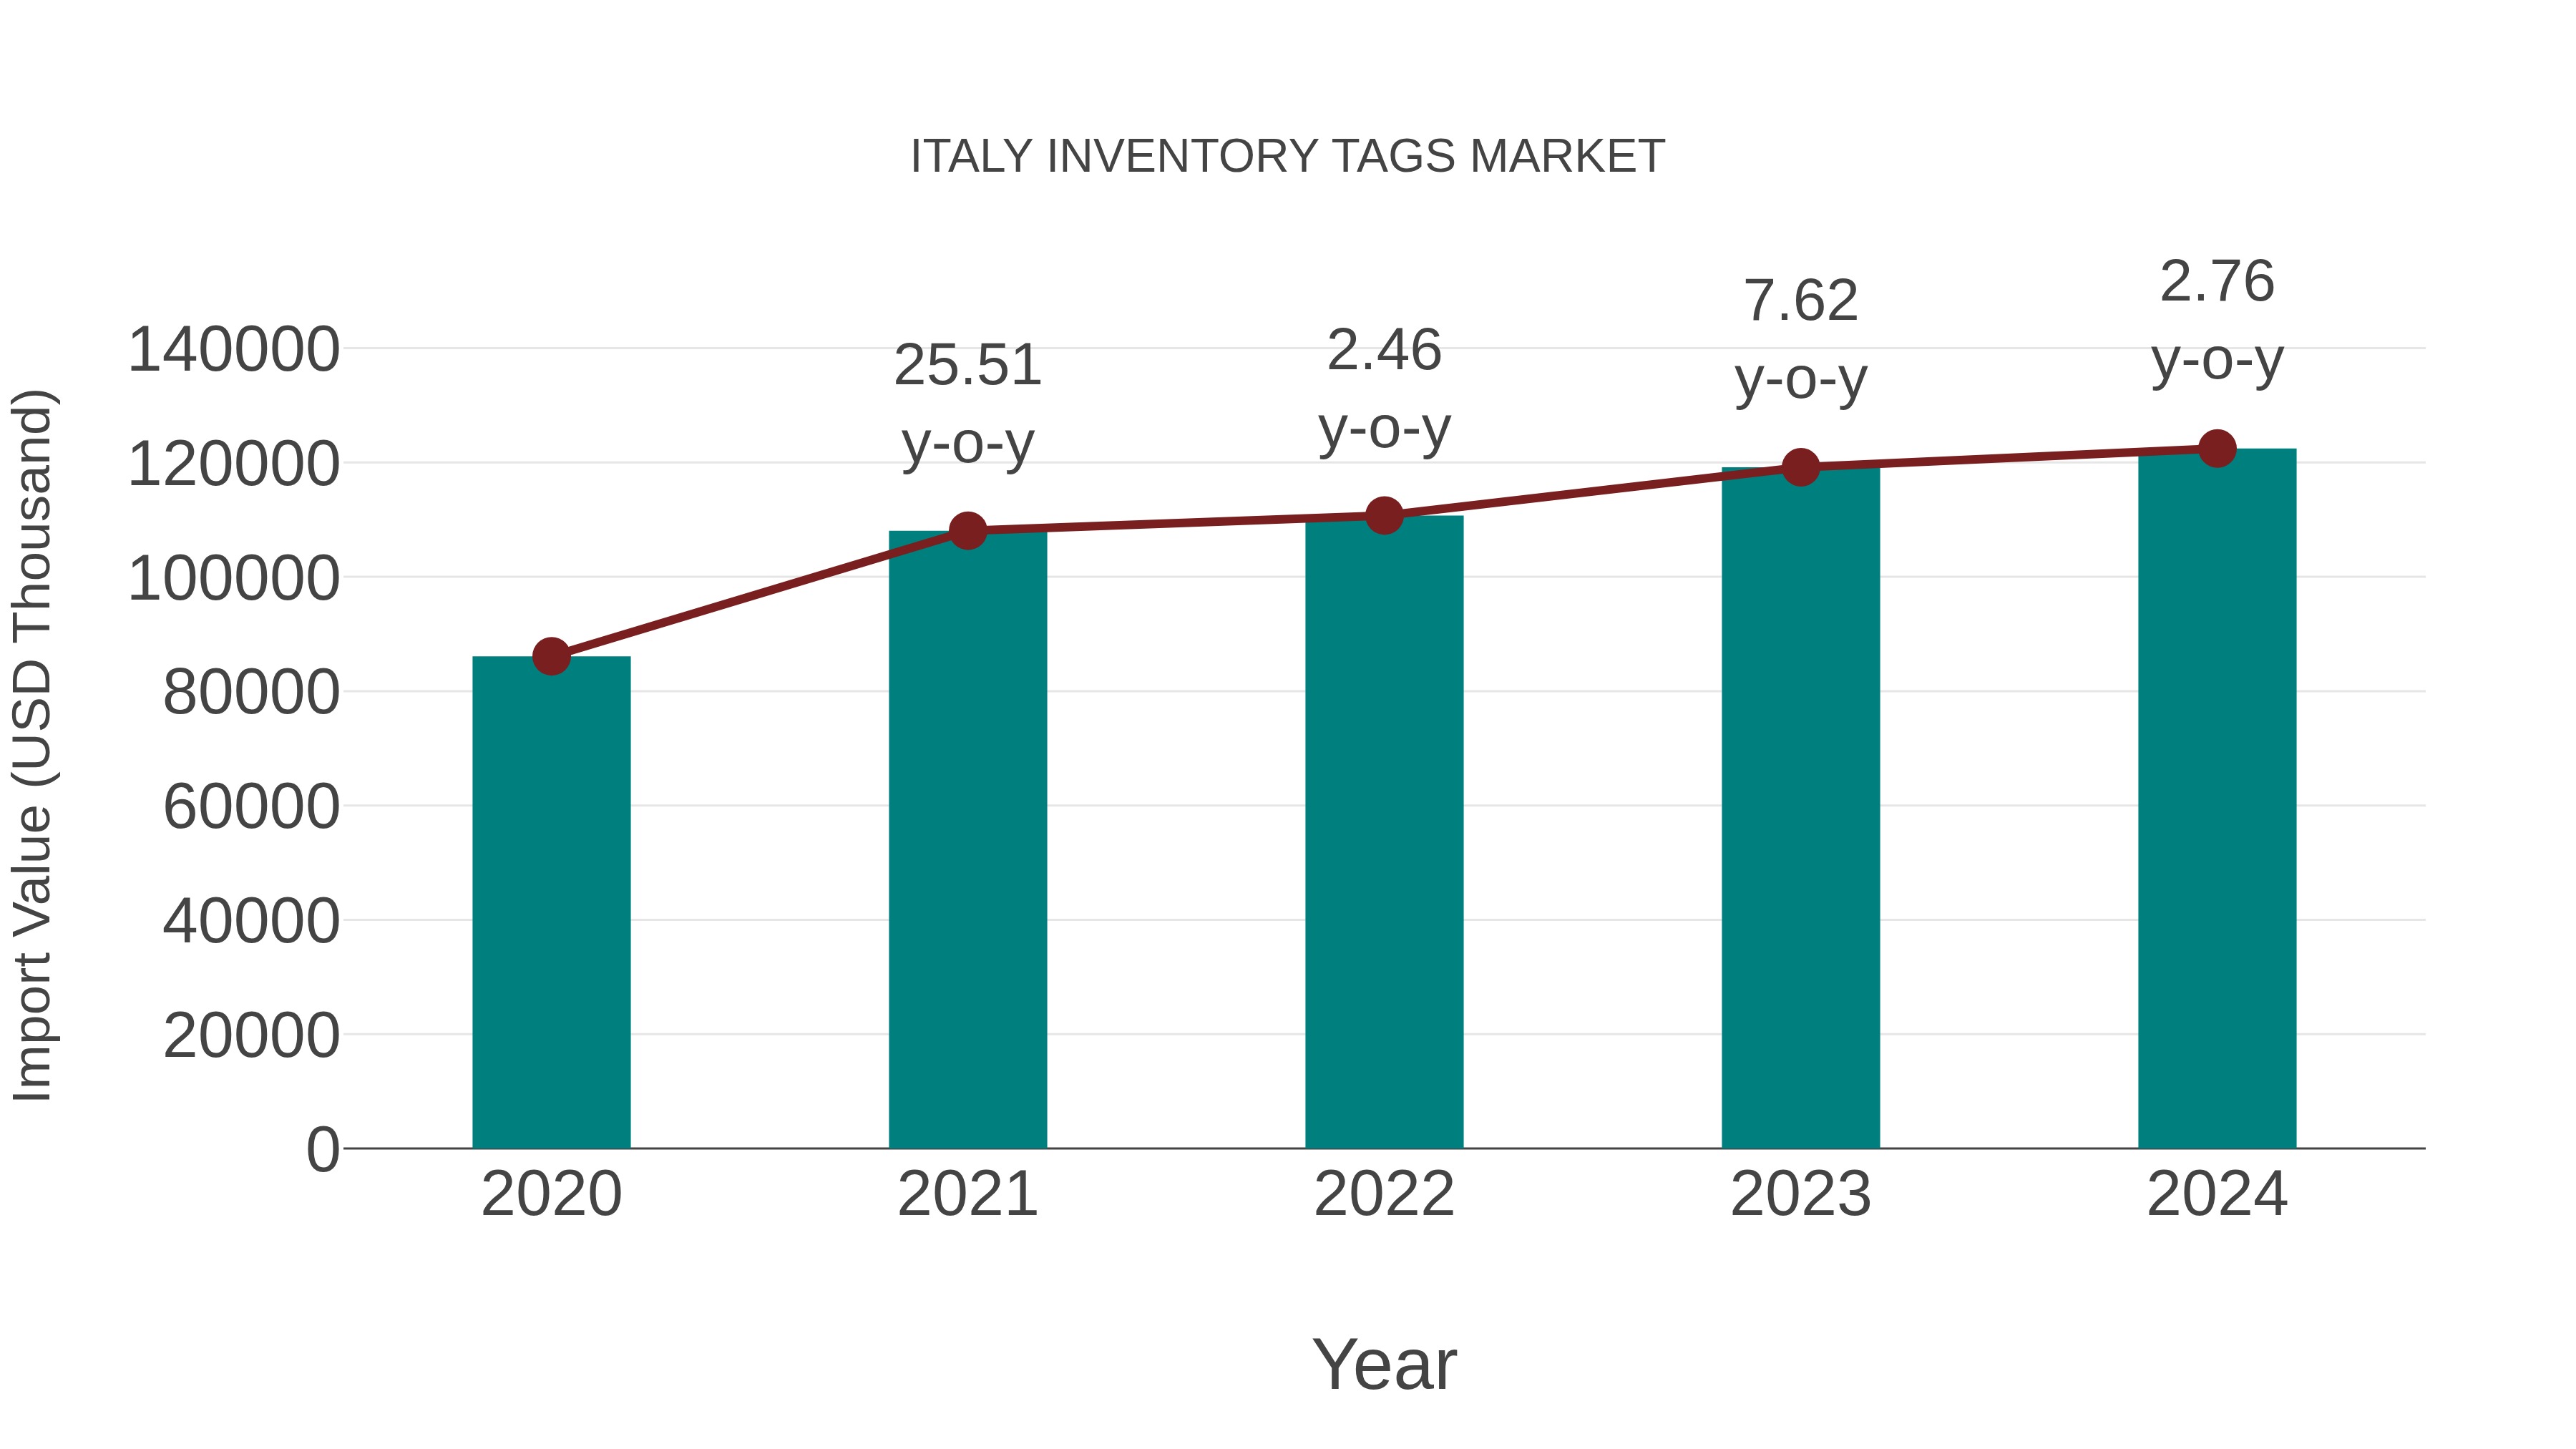
Italy Inventory Tags Market: Import Trend Analysis
In 2024, Italy import trend for inventory tags saw a steady increase. Imports of inventory tags into Italy grew consistently throughout the year, reflecting a rising demand for such products in the Market: Import Trend Analysis.
Italy Inventory Tags Market Synopsis
The inventory tags market in Italy provides solutions for tracking and managing inventory in various industries such as retail, manufacturing, logistics, and healthcare. Inventory tags include barcode labels, RFID tags, and QR codes used for identifying, labeling, and monitoring assets throughout the supply chain. The market growth is driven by factors such as inventory optimization, demand for real-time visibility, and compliance requirements.
Drivers of the market
The Italy Inventory Tags Market is driven by the need for asset tracking, inventory management, and supply chain visibility. Inventory tags, including RFID tags, barcode labels, and QR codes, enable real-time tracking and identification of goods, equipment, and assets, driving their adoption in Italy retail, manufacturing, and logistics sectors for improving operational efficiency, reducing stockouts, and preventing losses.
Challenges of the market
Challenges in the Inventory Tags market include the high cost of advanced tagging technology and the need for seamless integration with existing inventory management systems. Ensuring the durability and accuracy of tags in various environmental conditions is also a significant issue.
Government Policy of the market
The Italy government supports the inventory tags market through digital transformation and logistics efficiency initiatives. Financial incentives are available for businesses adopting advanced inventory tagging technologies that enhance supply chain management. Regulations ensure that inventory tags meet performance and security standards, driving market innovation.
Key Highlights of the Report:
- Italy Inventory Tags Market Outlook
- Market Size of Italy Inventory Tags Market, 2025
- Forecast of Italy Inventory Tags Market, 2032
- Historical Data and Forecast of Italy Inventory Tags Revenues & Volume for the Period 2022-2032F
- Italy Inventory Tags Market Trend Evolution
- Italy Inventory Tags Market Drivers and Challenges
- Italy Inventory Tags Price Trends
- Italy Inventory Tags Porter's Five Forces
- Italy Inventory Tags Industry Life Cycle
- Historical Data and Forecast of Italy Inventory Tags Market Revenues & Volume By Technology for the Period 2022-2032F
- Historical Data and Forecast of Italy Inventory Tags Market Revenues & Volume By Barcodes for the Period 2022-2032F
- Historical Data and Forecast of Italy Inventory Tags Market Revenues & Volume By RFID for the Period 2022-2032F
- Historical Data and Forecast of Italy Inventory Tags Market Revenues & Volume By Label Type for the Period 2022-2032F
- Historical Data and Forecast of Italy Inventory Tags Market Revenues & Volume By Plastic for the Period 2022-2032F
- Historical Data and Forecast of Italy Inventory Tags Market Revenues & Volume By Paper for the Period 2022-2032F
- Historical Data and Forecast of Italy Inventory Tags Market Revenues & Volume By Metal for the Period 2022-2032F
- Historical Data and Forecast of Italy Inventory Tags Market Revenues & Volume By Printing technology for the Period 2022-2032F
- Historical Data and Forecast of Italy Inventory Tags Market Revenues & Volume By Digital Printing for the Period 2022-2032F
- Historical Data and Forecast of Italy Inventory Tags Market Revenues & Volume By Flexography for the Period 2022-2032F
- Historical Data and Forecast of Italy Inventory Tags Market Revenues & Volume By Lithography for the Period 2022-2032F
- Historical Data and Forecast of Italy Inventory Tags Market Revenues & Volume By Screen Printing for the Period 2022-2032F
- Historical Data and Forecast of Italy Inventory Tags Market Revenues & Volume By Gravure for the Period 2022-2032F
- Historical Data and Forecast of Italy Inventory Tags Market Revenues & Volume By Others for the Period 2022-2032F
- Italy Inventory Tags Import Export Trade Statistics
- Market Opportunity Assessment By Technology
- Market Opportunity Assessment By Label Type
- Market Opportunity Assessment By Printing technology
- Italy Inventory Tags Top Companies Market Share
- Italy Inventory Tags Competitive Benchmarking By Technical and Operational Parameters
- Italy Inventory Tags Company Profiles
- Italy Inventory Tags Key Strategic Recommendations
Italy Inventory Tags Market (2026-2032): FAQs
6Wresearch actively monitors the Italy Inventory Tags Market and publishes its comprehensive annual report, highlighting emerging trends, growth drivers, revenue analysis, and forecast outlook. Our insights help businesses to make data-backed strategic decisions with ongoing market dynamics. Our analysts track relevent industries related to the Italy Inventory Tags Market, allowing our clients with actionable intelligence and reliable forecasts tailored to emerging regional needs.
Yes, we provide customisation as per your requirements. To learn more, feel free to contact us on sales@6wresearch.com
1 Executive Summary |
2 Introduction |
2.1 Key Highlights of the Report |
2.2 Report Description |
2.3 Market Scope & Segmentation |
2.4 Research Methodology |
2.5 Assumptions |
3 Italy Inventory Tags Market Overview |
3.1 Italy Country Macro Economic Indicators |
3.2 Italy Inventory Tags Market Revenues & Volume, 2022 & 2032F |
3.3 Italy Inventory Tags Market - Industry Life Cycle |
3.4 Italy Inventory Tags Market - Porter's Five Forces |
3.5 Italy Inventory Tags Market Revenues & Volume Share, By Technology, 2022 & 2032F |
3.6 Italy Inventory Tags Market Revenues & Volume Share, By Label Type, 2022 & 2032F |
3.7 Italy Inventory Tags Market Revenues & Volume Share, By Printing technology, 2022 & 2032F |
4 Italy Inventory Tags Market Dynamics |
4.1 Impact Analysis |
4.2 Market Drivers |
4.2.1 Increasing demand for real-time tracking and monitoring of inventory in Italy |
4.2.2 Growing adoption of RFID technology in various industries for inventory management |
4.2.3 Government regulations mandating the use of inventory tags for better traceability and transparency |
4.3 Market Restraints |
4.3.1 High initial investment required for implementing inventory tagging systems |
4.3.2 Concerns regarding data security and privacy issues associated with RFID technology in Italy |
5 Italy Inventory Tags Market Trends |
6 Italy Inventory Tags Market, By Types |
6.1 Italy Inventory Tags Market, By Technology |
6.1.1 Overview and Analysis |
6.1.2 Italy Inventory Tags Market Revenues & Volume, By Technology, 2022-2032F |
6.1.3 Italy Inventory Tags Market Revenues & Volume, By Barcodes, 2022-2032F |
6.1.4 Italy Inventory Tags Market Revenues & Volume, By RFID, 2022-2032F |
6.2 Italy Inventory Tags Market, By Label Type |
6.2.1 Overview and Analysis |
6.2.2 Italy Inventory Tags Market Revenues & Volume, By Plastic, 2022-2032F |
6.2.3 Italy Inventory Tags Market Revenues & Volume, By Paper, 2022-2032F |
6.2.4 Italy Inventory Tags Market Revenues & Volume, By Metal, 2022-2032F |
6.3 Italy Inventory Tags Market, By Printing technology |
6.3.1 Overview and Analysis |
6.3.2 Italy Inventory Tags Market Revenues & Volume, By Digital Printing, 2022-2032F |
6.3.3 Italy Inventory Tags Market Revenues & Volume, By Flexography, 2022-2032F |
6.3.4 Italy Inventory Tags Market Revenues & Volume, By Lithography, 2022-2032F |
6.3.5 Italy Inventory Tags Market Revenues & Volume, By Screen Printing, 2022-2032F |
6.3.6 Italy Inventory Tags Market Revenues & Volume, By Gravure, 2022-2032F |
6.3.7 Italy Inventory Tags Market Revenues & Volume, By Others, 2022-2032F |
7 Italy Inventory Tags Market Import-Export Trade Statistics |
7.1 Italy Inventory Tags Market Export to Major Countries |
7.2 Italy Inventory Tags Market Imports from Major Countries |
8 Italy Inventory Tags Market Key Performance Indicators |
8.1 Average time saved in inventory management processes due to the use of inventory tags |
8.2 Rate of reduction in inventory shrinkage after implementing inventory tagging systems |
8.3 Percentage increase in operational efficiency achieved with the adoption of RFID technology for inventory tracking |
9 Italy Inventory Tags Market - Opportunity Assessment |
9.1 Italy Inventory Tags Market Opportunity Assessment, By Technology, 2022 & 2032F |
9.2 Italy Inventory Tags Market Opportunity Assessment, By Label Type, 2022 & 2032F |
9.3 Italy Inventory Tags Market Opportunity Assessment, By Printing technology, 2022 & 2032F |
10 Italy Inventory Tags Market - Competitive Landscape |
10.1 Italy Inventory Tags Market Revenue Share, By Companies, 2025 |
10.2 Italy Inventory Tags Market Competitive Benchmarking, By Operating and Technical Parameters |
11 Company Profiles |
12 Recommendations |
13 Disclaimer |
Global Go To Market Strategy - 2030
Export potential enables firms to identify high-growth global markets with greater confidence by combining advanced trade intelligence with a structured quantitative methodology. The framework analyzes emerging demand trends and country-level import patterns while integrating macroeconomic and trade datasets such as GDP and population forecasts, bilateral import–export flows, tariff structures, elasticity differentials between developed and developing economies, geographic distance, and import demand projections. Using weighted trade values from 2020–2024 as the base period to project country-to-country export potential for 2030, these inputs are operationalized through calculated drivers such as gravity model parameters, tariff impact factors, and projected GDP per-capita growth. Through an analysis of hidden potentials, demand hotspots, and market conditions that are most favorable to success, this method enables firms to focus on target countries, maximize returns, and global expansion with data, backed by accuracy.
By factoring in the projected importer demand gap that is currently unmet and could be potential opportunity, it identifies the potential for the Exporter (Country) among 190 countries, against the general trade analysis, which identifies the biggest importer or exporter.
To discover high-growth global markets and optimize your business strategy:
Click Here
Pricing
- Single User License$ 1,995
- Department License$ 2,400
- Site License$ 3,120
- Global License$ 3,795

Leadership Perspectives from Industry Events
Search
Thought Leadership and Analyst Meet


Our Clients
6WResearch In News
- India Export Attractiveness Tracker 2026
- India Air Conditioner Market Set for Strong Rebound in 2026 After Weather-Led Correction and GST-Driven Recovery: 6Wresearch
- ADAS in India: How Automatic Emergency Braking, Blind Spot Detection & Driver Monitoring are Transforming Road Safety
- Doha a strategic location for EV manufacturing hub: IPA Qatar
- Demand for luxury TVs surging in the GCC, says Samsung
- Empowering Growth: The Thriving Journey of Bangladesh’s Cable Industry
Latest Reports
- Nicaragua RPG Gaming Market (2026-2032)
- New Zealand RPG Gaming Market (2026-2032)
- Netherlands RPG Gaming Market (2026-2032)
- Nauru RPG Gaming Market (2026-2032)
- Namibia RPG Gaming Market (2026-2032)
- Mozambique RPG Gaming Market (2026-2032)
- Montenegro RPG Gaming Market (2026-2032)
- Mongolia RPG Gaming Market (2026-2032)
- Monaco RPG Gaming Market (2026-2032)
- Micronesia RPG Gaming Market (2026-2032)
Industry Events and Analyst Meet

EV India Expo 2026

HIMTEX 2026

India Refining Summit 2026

India EV Show 2026

EV tech India Expo 2026
Whitepaper
- Middle East & Africa Commercial Security Market Click here to view more.
- Middle East & Africa Fire Safety Systems & Equipment Market Click here to view more.
- GCC Drone Market Click here to view more.
- Middle East Lighting Fixture Market Click here to view more.
- GCC Physical & Perimeter Security Market Click here to view more.