Japan Interactive Projector Market Size & Growth Rate
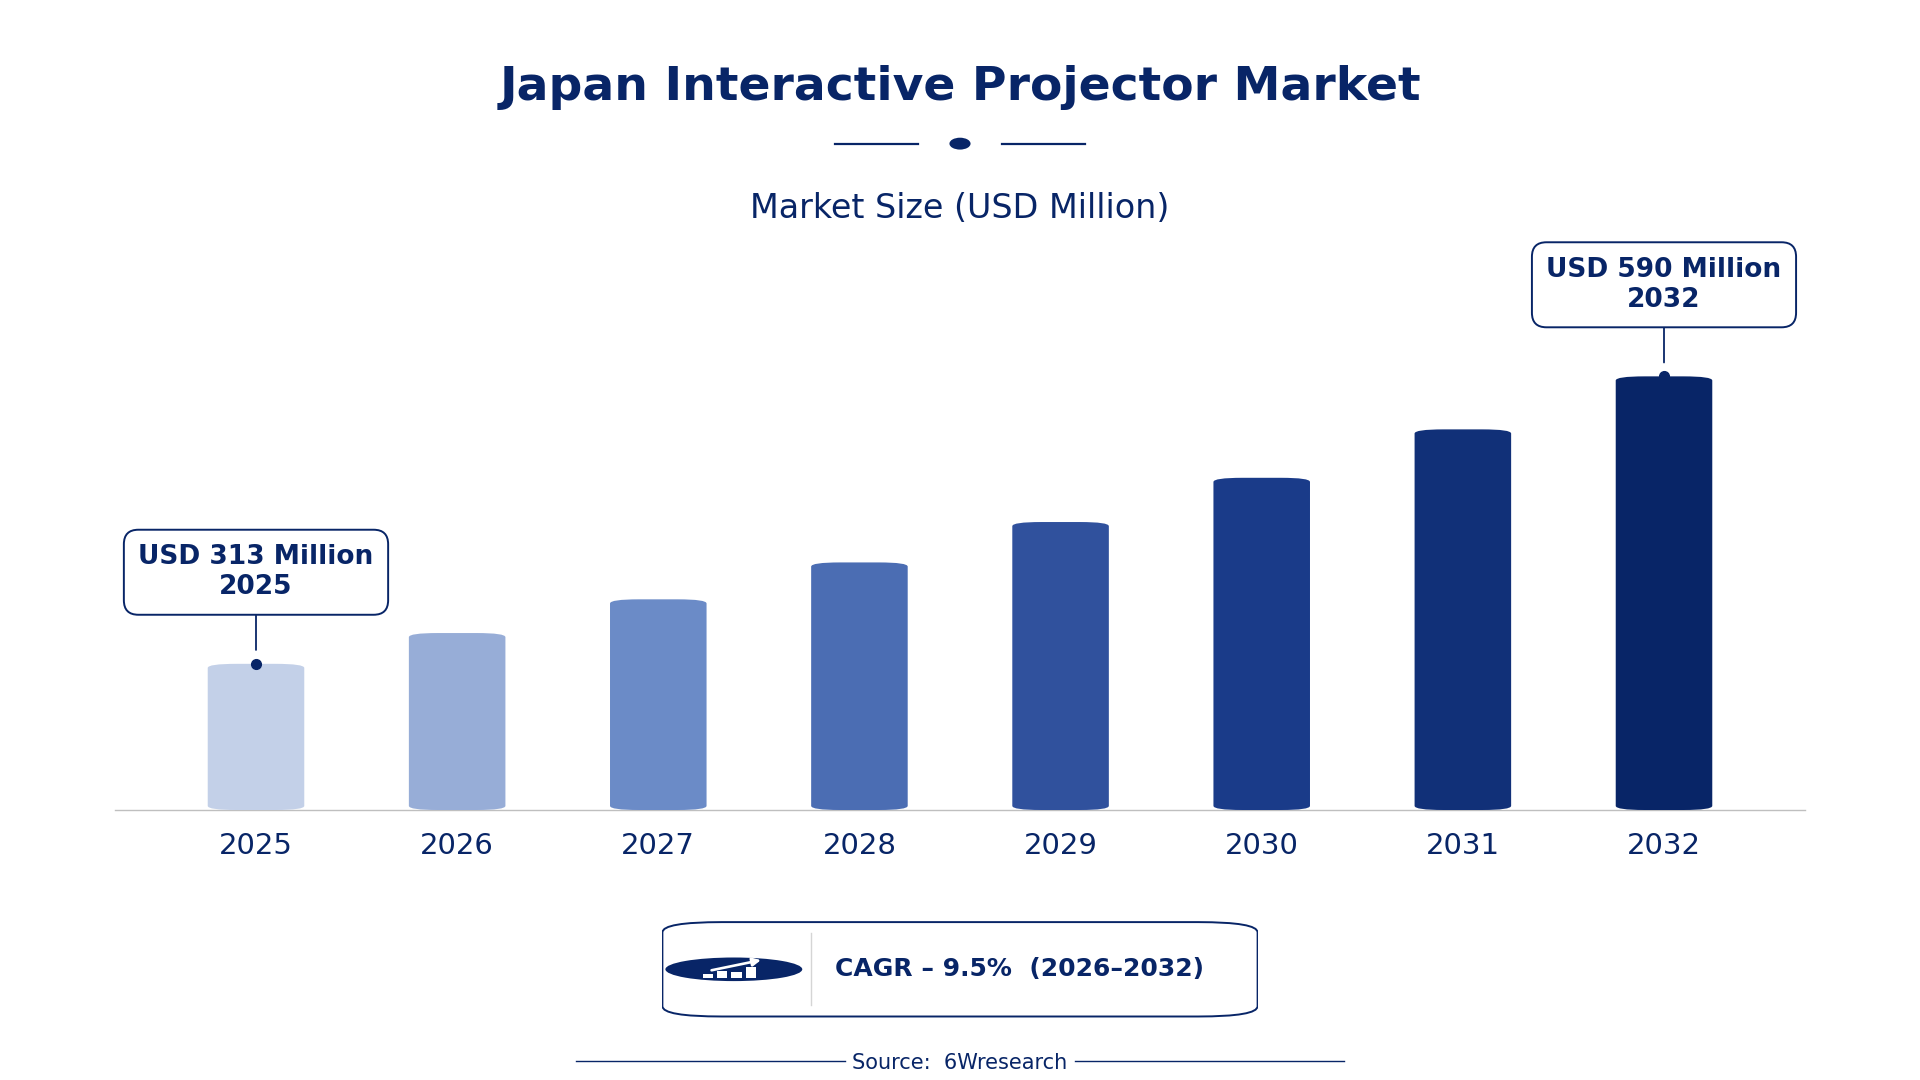
According to 6Wresearch internal database and industry insights, the Japan Interactive Projector Market was valued at USD 313 Million in 2025 and is projected to reach USD 590 Million by 2032, growing at a CAGR of approximately 9.5% during 2026–2032.
Japan Interactive Projector Market Highlights
| Report Metric | Details |
| Report Name | Japan Interactive Projector Market (2026-2032) |
| Market Size 2025 | USD 313 Million |
| Market Size 2032 | USD 590 Million |
| Absolute Growth 2025–2032 | USD 277 Million |
| CAGR 2026–2032 | 9.5% |
| Peak Annual Growth | 10.6% in 2032 |
| Forecast Period | 2026–2032 |
| Historical Data | 2022–2025 |
| Base Year | 2025 |
| Leading Technology, 2025 | DLP (45% share) |
| Leading Projection Distance, 2025 | Ultra short throw (54% share) |
| Leading Dimension, 2025 | 2D (68% share) |
| Leading Resolution, 2025 | 1920*1080 and 1920*720 (52% share) |
| Leading Application, 2025 | Education (42% share) |
| Fastest-Growing Technology | LCD (13.2% CAGR) |
| Fastest-Growing Projection Distance | Short throw (12.6% CAGR) |
| Fastest-Growing Dimension | 3D (12.7% CAGR) |
| Fastest-Growing Resolution | 1280*800 (12.5% CAGR) |
| Fastest-Growing Application | Corporate (13.1% CAGR) |
| Growing Sector | Corporate |
| Key End Users | Education, Corporate, Government |
Japan Interactive Projector Market Year-wise Growth Rate and Key Drivers (2022–2032)
This graph illustrates the annual growth rates of the market from 2022 to 2032, highlighting a steady upward trajectory and projected market expansion over the forecast period.
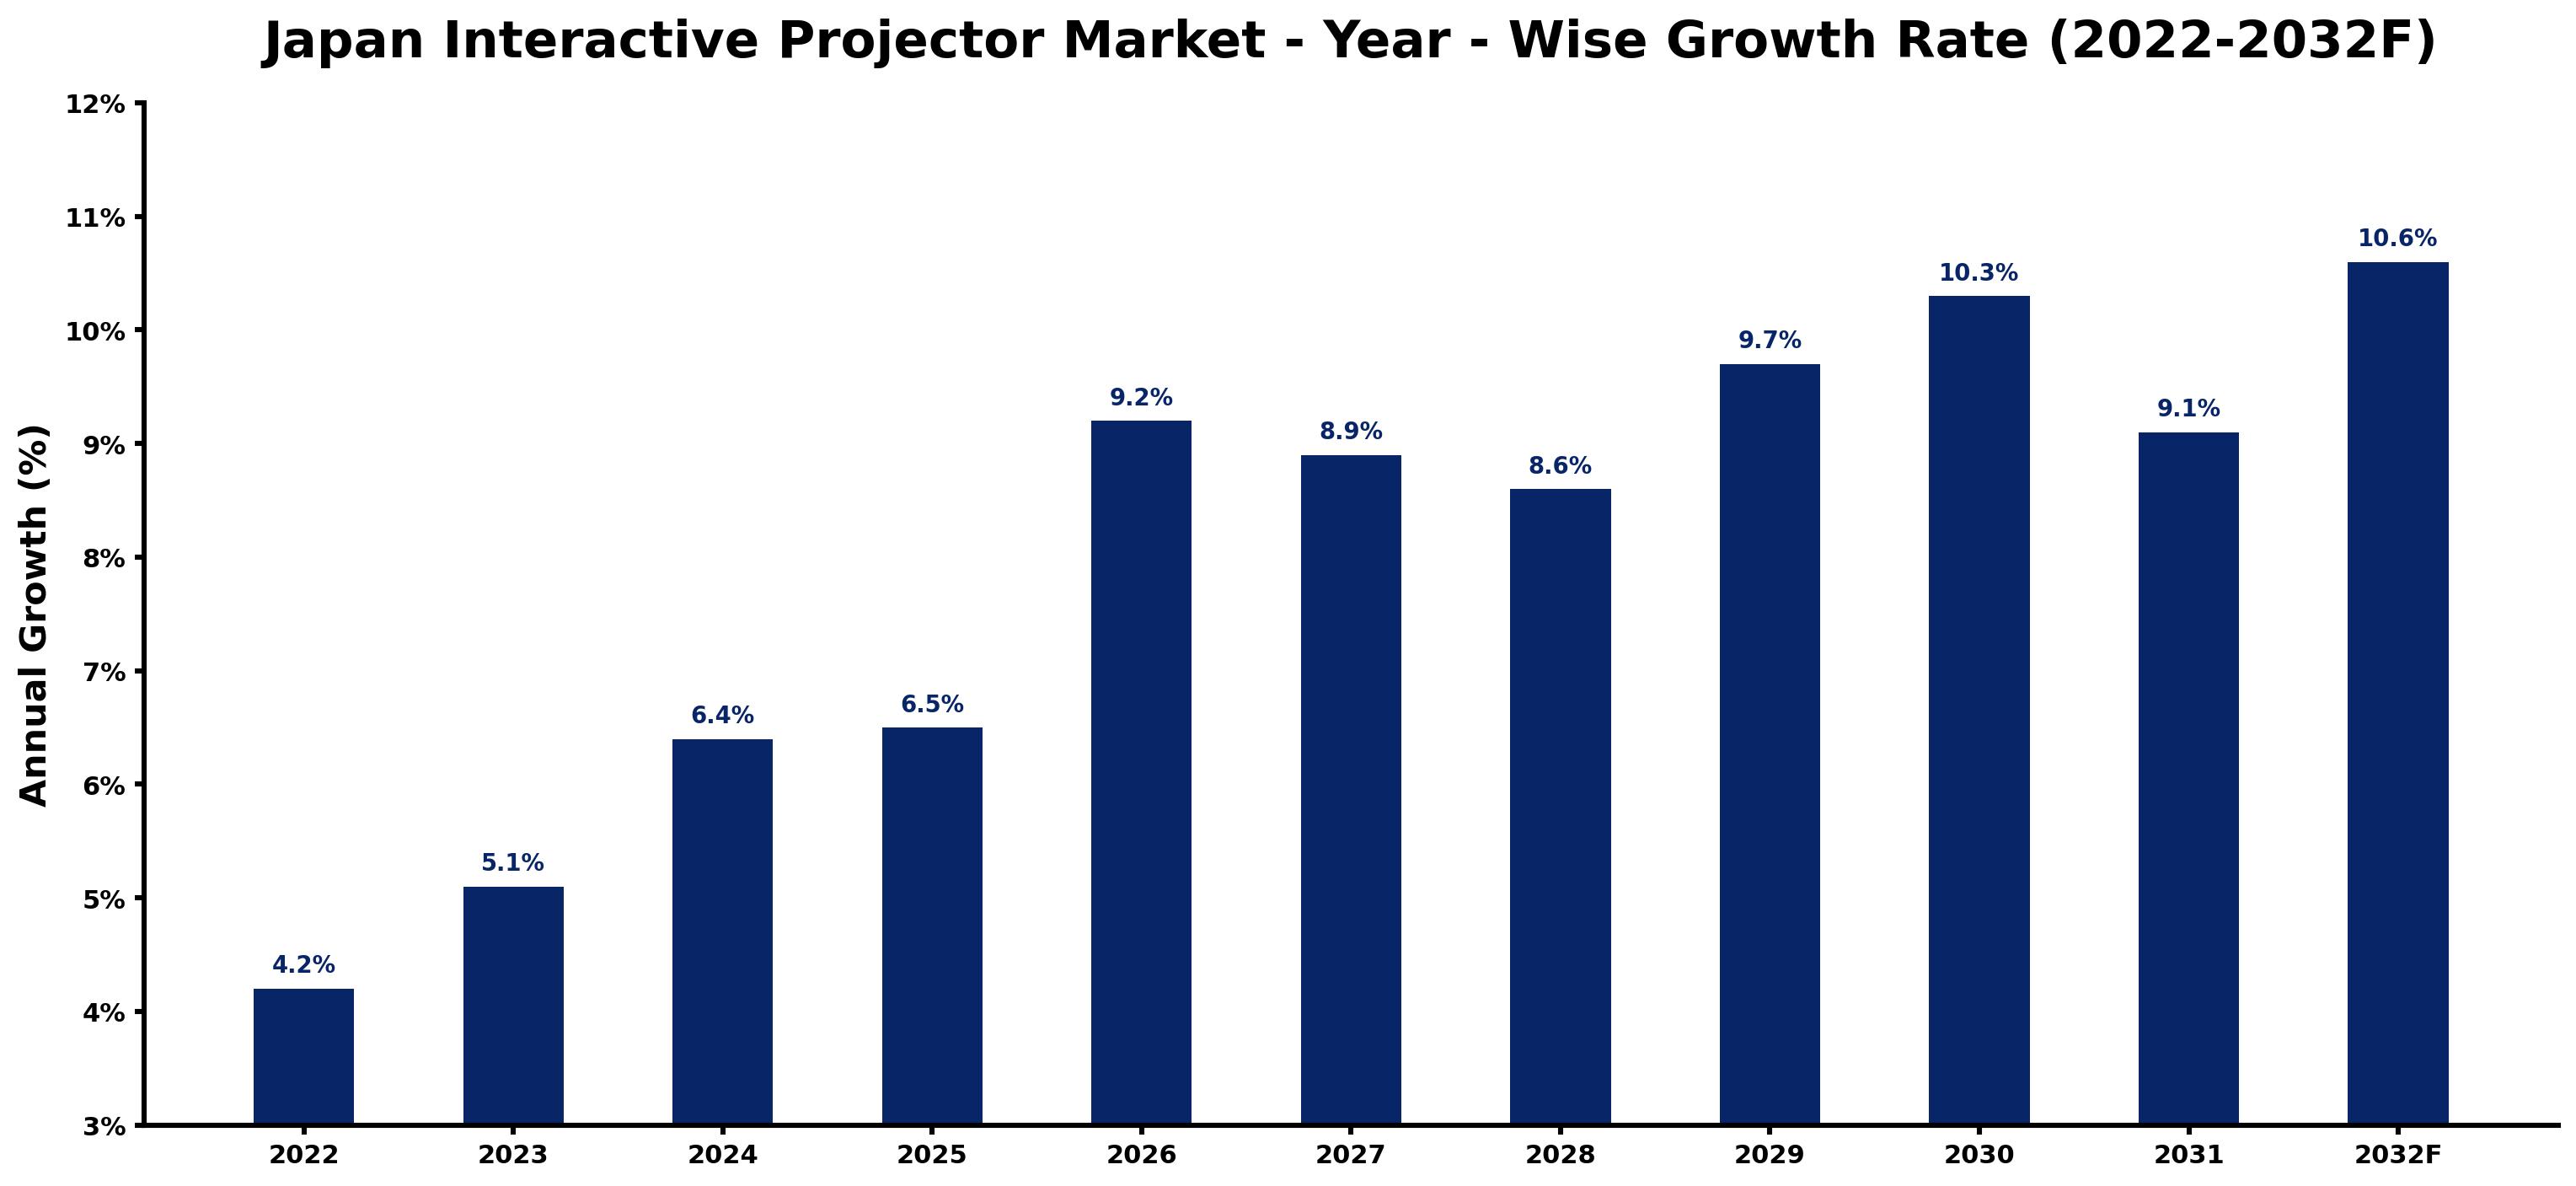
Annual growth estimates for each year appear below with the principal reason behind them, explaining the shifts that set the pace of the market.
| Year | Estimated Annual Growth (%) | Market Rationale |
| 2022 | 4.2 | The market showed steady activity with a 4.2% growth rate. |
| 2023 | 5.1 | Demand increased as more educational institutions adopted interactive projectors. |
| 2024 | 6.4 | Growth continued as corporate training sessions increasingly utilized interactive projectors. |
| 2025 | 6.5 | The market peaked historically at 6.5% due to heightened corporate engagement. |
| 2026 | 9.2 | Demand surged as educational technology investments began to rise. |
| 2027 | 8.9 | Growth slowed slightly as the market began to stabilise after rapid expansion. |
| 2028 | 8.6 | The market maintained growth, albeit at a slower pace compared to previous years. |
| 2029 | 9.7 | Demand accelerated again as urban areas embraced remote learning solutions. |
| 2030 | 10.3 | The market continued to grow, driven by advancements in interactive projector technology. |
| 2031 | 9.1 | Growth slowed as the market began to mature, reaching a more stable phase. |
| 2032 | 10.6 | The market is projected to peak at 10.6% due to increased corporate adoption. |
Note: Market size estimations and growth projections presented in this report are based on 6Wresearch's proprietary forecasting methodology, utilizing the latest available industry data, government publications, and primary research inputs.
Japan Interactive Projector Market Synopsis
Interactive projectors integrate projection with touch interactivity, facilitating engagement in education, corporate, and government settings. In Japan, over 70% of universities reported using these devices in 2022, while corporate training sessions increasingly rely on them to improve retention rates. The market is expanding due to rising educational technology investments and government initiatives, with a projected size of USD 590 million by 2032, supported by the Tokyo Metropolitan Government's program to equip public schools by 2025.
Market Dynamics Impact Analysis (2026–2032)
| Factor | Type | Impact | Primary Segment Affected |
| Growing adoption in educational institutions | Driver | High | Education |
| Increased corporate training needs | Driver | High | Corporate |
| Investment in digital learning environments | Opportunity | High | Education |
| Expansion of remote learning setups | Opportunity | High | Corporate |
| High replacement cycles due to technology advancements | Restraint | Medium | Education |
| Limited awareness of interactive projectors in government | Restraint | Medium | Government |
| High initial costs of interactive projectors | Challenge | High | Corporate |
| Rapid technological changes leading to obsolescence | Challenge | Medium | Education |
Evaluation of Drivers in Japan Interactive Projector Market (2026–2032)
Key forces behind demand, with the segment each one moves most, are listed below.
| Drivers | Primary Segment Affected | Why It Matters (Evidence) |
| Increasing integration of technology in classrooms | Education | Over 70% of universities in Japan use interactive projectors, improving teaching effectiveness. |
| Demand for effective communication tools in businesses | Corporate | Corporate training sessions increasingly utilize interactive projectors to boost engagement and retention rates by 20%. |
| Government initiatives promoting digital learning | Education | In 2023, the Tokyo Metropolitan Government allocated 5 billion yen to equip public schools with interactive projectors. |
| Rising adoption of interactive projectors in remote learning | Education | The adoption rate in schools is estimated at 60% as of 2023, driving demand for educational applications. |
| Preference for high-definition content in presentations | DLP | The average resolution for interactive projectors is 1920x1080, preferred for clarity and detail. |
Most of the extra volume comes from the growing integration of technology in educational settings, with over 70% of universities adopting interactive projectors to improve teaching. Demand rises as businesses seek effective communication tools, with training sessions increasingly utilising these devices to boost retention rates by 20%. The adoption rate in schools is estimated at 60% as of 2023, driving educational applications. The preference for high-definition content supports demand, with 1920x1080 being the average resolution for clarity and detail.
Evaluation of Restraints in Japan Interactive Projector Market
Below are the constraints most often cited by buyers and suppliers, with the segment each affects.
| Market Restraint | Primary Segment Affected | Why It Matters (Evidence) |
| Regulatory hurdles in technology procurement | Education | Strict guidelines can delay the adoption of interactive projectors by up to six months for schools. |
| Outdated technology compliance | Corporate | Many interactive projectors do not meet the latest ISO 9241 standards, resulting in lower sales. |
| Competition from alternative display technologies | Corporate | Increased competition pressures producers to innovate rapidly, leading to potential development costs. |
| Rising component costs | Corporate | Average projectors have seen a 20% increase in retail prices, impacting budget allocations. |
| Limited awareness of benefits | Education | Some educational institutions remain unaware of the advantages of interactive projectors. |
Japan Interactive Projector Market Challenges
Educational institutions encounter regulatory hurdles that slow the procurement of interactive projectors, delaying classroom upgrades by up to six months for schools seeking to improve learning environments. Suppliers face challenges with outdated technology, as many projectors do not comply with ISO 9241 standards, forcing them to offer discounts of around 15% to attract buyers. Increased competition from alternative display solutions, such as digital whiteboards, compels producers to innovate quickly, potentially incurring product development costs of 10 million yen annually. Rising component prices elevate retail costs for buyers, with average projectors experiencing a 20% price increase, straining educational budgets.
Trends in the Japan Interactive Projector Market
The following changes are redrawing the Japan Interactive Projector Market.
- Shift Towards Digital Learning: In 2023, the Tokyo Metropolitan Government launched a programme to equip all public schools with interactive projectors by 2025, with a budget of 5 billion yen. This shift is transforming classrooms into more interactive environments.
- Transition from Static to Interactive Presentations: Since 2022, corporate training sessions have increasingly adopted interactive projectors, improving engagement rates by 20%. This change reflects a broader trend towards more dynamic presentation methods.
- Growing Preference for High-Definition Resolutions: The average resolution for interactive projectors in Japan is 1920x1080, preferred for clarity. This trend is apparent as educational institutions upgrade their technology to meet modern standards.
- Rising Adoption in Remote Learning: As of 2023, interactive projectors are increasingly used in remote learning setups, particularly in urban areas. This trend supports the need for effective teaching tools in digital environments.
Investment Opportunities in the Japan Interactive Projector Market
The openings below show where demand in the Japan Interactive Projector Market is visible and how suppliers can enter.
- Supply of Interactive Projectors for Education: With the Tokyo Metropolitan Government's initiative to equip public schools by 2025, there is strong demand for interactive projectors. This programme allocates 5 billion yen, creating a notable market opportunity.
- Corporate Training Solutions: The demand for effective communication tools in corporate training is rising, with a projected market size of USD 590 million by 2032. Companies can invest in interactive projectors to improve their training sessions.
- High-Definition Content Supply: The preference for high-definition content is driving the need for interactive projectors with 1920x1080 resolution. Suppliers can target educational institutions looking to upgrade their technology.
- Remote Learning Equipment Supply: As remote learning continues to expand, there is an opportunity to supply interactive projectors to urban educational institutions. This trend is projected to significantly increase demand.
Government Initiatives in the Japan Interactive Projector Market
The Industrial Standardization Act governs product and test standards, ensuring that interactive projectors meet quality requirements. This measure affects producers by mandating compliance with JIS standards, improving product reliability and market access. Additionally, the Act against Unjustifiable Premiums and Misleading Representations prohibits misleading advertising, enhancing consumer trust.
In 2023, the Government of Japan's GX Basic Policy aims for JPY 150 trillion in public-private decarbonisation investment over 10 years. The Ministry of Education, Culture, Sports, Science and Technology oversees initiatives to promote technology in education, impacting buyers by improving access to advanced tools.
Future Insight of the Japan Interactive Projector Market
By 2032, advancements in digital learning tools will drive demand for interactive projectors as educational institutions adopt new teaching methods. Government initiatives, including the Tokyo Metropolitan Government's plan to equip public schools with projectors by 2025, will improve classroom accessibility. The average lifespan of interactive projectors, around 5-7 years, will boost replacement sales, creating opportunities for suppliers. As corporate training evolves, the need for effective communication tools will further increase market demand for these devices.
Market Segmentation Analysis
Japan Interactive Projector Market report covers a detailed analysis of the following market segments:
By Technology – DLP Leads, LCD Expected to Grow Fastest
According to Sachin Kumar Rai, Senior Research Analyst at 6Wresearch, DLP accounted for 45% of the market by technology in 2025. DLP technology holds the largest share in Japan's interactive projector market due to its ability to deliver high-quality images, making it a preferred choice in educational institutions. For instance, over 70% of universities utilise DLP projectors, ensuring clarity and engagement in classrooms. LCD is set to record the highest CAGR in this split, 13.2% over 2026–2032. LCD technology is experiencing rapid growth as it offers cost-effective solutions with excellent clarity, appealing to budget-conscious educational facilities. The increasing adoption of LCD projectors in schools is evident as they are often used in conjunction with digital whiteboards. Suppliers should focus on enhancing LCD offerings to capture the growing demand in educational settings.
By Projection Distance – Ultra short throw Leads, Short throw Expected to Grow Fastest
The largest projection distance category in 2025 was Ultra short throw, at 54% of revenue. Ultra short throw projectors dominate the market as they are specifically designed for small spaces, making them ideal for classrooms and offices where space is limited. Their ability to project large images from a short distance has led to widespread adoption in urban educational environments. Over 2026–2032, Short throw is expected to post the fastest growth, at a CAGR of 12.6%. Short throw projectors are gaining traction due to their suitability for medium-sized rooms, allowing for effective presentations without the need for extensive space. Their growing popularity is reflected in corporate training sessions where space constraints are common. Buyers should consider short throw projectors for versatile use in various room sizes.
By Dimension – 2D Leads, 3D Expected to Grow Fastest
2D held 68% of the Japan Interactive Projector Market by dimension in 2025. 2D projectors are the most common format in Japan, primarily used for presentations and educational purposes, which drives their significant market share. Their straightforward application in classrooms makes them a staple for educators across the country. 3D is projected to grow fastest, at a CAGR of 12.7% during 2026–2032. 3D projectors are witnessing growth as they cater to specialized applications, particularly in advanced educational settings that require immersive experiences. This niche demand is likely to expand as technology evolves and more institutions seek to enhance learning. Suppliers may explore opportunities in the 3D segment to meet emerging educational needs.
By Resolution – 1920*1080 and 1920*720 Leads, 1280*800 Expected to Grow Fastest
With 52% of resolution revenue in 2025, 1920*1080 and 1920*720 was the largest category. The 1920*1080 and 1920*720 resolutions are preferred in Japan for their ability to deliver high-definition content, which is crucial for effective teaching and presentations. This preference is evident in the average classroom setup, where clarity is paramount for student engagement. The quickest growth will come from 1280*800, forecast to expand at a CAGR of 12.5% between 2026 and 2032. The 1280*800 resolution is gaining momentum as it serves basic applications effectively, appealing to institutions with budget constraints. Its increasing adoption in classrooms reflects a shift towards more affordable yet functional options. Suppliers should ensure a diverse range of resolutions to cater to varying educational budgets and needs.
By Application – Education Leads, Corporate Expected to Grow Fastest
Education took 42% of application revenue in 2025, more than any other category. Education is the primary market for interactive projectors in Japan, driven by initiatives from the Ministry of Education that promote technology integration in classrooms. With an estimated 60% adoption rate in schools, this sector represents a substantial share of the market. Corporate is set to record the highest CAGR in this split, 13.1% over 2026–2032. The corporate sector is rapidly adopting interactive projectors for business presentations, highlighting the increasing need for effective communication tools in professional environments. This trend is supported by the growing demand for engaging training solutions. Suppliers should tailor their marketing strategies to address the unique needs of the corporate sector.
Key Attractiveness of the Report
- 10 Years of Market Numbers
- Historical Data Starting from 2022 to 2025
- Base Year 2025
- Forecast Data until 2032
- Key Performance Indicators Impacting the Market
- Major Upcoming Developments and Projects
Key Highlights of the Report:
- Japan Interactive Projector Market Outlook
- Market Size of Japan Interactive Projector Market, 2025
- Forecast of Japan Interactive Projector Market, 2032
- Historical Data and Forecast of Japan Interactive Projector Revenues & Volume for the Period 2022-2032
- Japan Interactive Projector Market Trend Evolution
- Japan Interactive Projector Market Drivers and Challenges
- Japan Interactive Projector Price Trends
- Japan Interactive Projector Porter's Five Forces
- Japan Interactive Projector Industry Life Cycle
- Historical Data and Forecast of Japan Interactive Projector Market Revenues & Volume By Technology for the Period 2022-2032
- Historical Data and Forecast of Japan Interactive Projector Market Revenues & Volume By DLP for the Period 2022-2032
- Historical Data and Forecast of Japan Interactive Projector Market Revenues & Volume By LCD for the Period 2022-2032
- Historical Data and Forecast of Japan Interactive Projector Market Revenues & Volume By LCoS for the Period 2022-2032
- Historical Data and Forecast of Japan Interactive Projector Market Revenues & Volume By Projection Distance for the Period 2022-2032
- Historical Data and Forecast of Japan Interactive Projector Market Revenues & Volume By Ultra short throw for the Period 2022-2032
- Historical Data and Forecast of Japan Interactive Projector Market Revenues & Volume By Short throw for the Period 2022-2032
- Historical Data and Forecast of Japan Interactive Projector Market Revenues & Volume By Standard throw for the Period 2022-2032
- Historical Data and Forecast of Japan Interactive Projector Market Revenues & Volume By Dimension for the Period 2022-2032
- Historical Data and Forecast of Japan Interactive Projector Market Revenues & Volume By 2D for the Period 2022-2032
- Historical Data and Forecast of Japan Interactive Projector Market Revenues & Volume By 3D for the Period 2022-2032
- Historical Data and Forecast of Japan Interactive Projector Market Revenues & Volume By Resolution for the Period 2022-2032
- Historical Data and Forecast of Japan Interactive Projector Market Revenues & Volume By 1920*1080 and 1920*720 for the Period 2022-2032
- Historical Data and Forecast of Japan Interactive Projector Market Revenues & Volume By 1280*800 for the Period 2022-2032
- Historical Data and Forecast of Japan Interactive Projector Market Revenues & Volume By 1024*768 for the Period 2022-2032
- Historical Data and Forecast of Japan Interactive Projector Market Revenues & Volume By Others (854*480) for the Period 2022-2032
- Historical Data and Forecast of Japan Interactive Projector Market Revenues & Volume By Application for the Period 2022-2032
- Historical Data and Forecast of Japan Interactive Projector Market Revenues & Volume By Education for the Period 2022-2032
- Historical Data and Forecast of Japan Interactive Projector Market Revenues & Volume By Corporate for the Period 2022-2032
- Historical Data and Forecast of Japan Interactive Projector Market Revenues & Volume By Government for the Period 2022-2032
- Japan Interactive Projector Import Export Trade Statistics
- Market Opportunity Assessment By Technology
- Market Opportunity Assessment By Projection Distance
- Market Opportunity Assessment By Dimension
- Market Opportunity Assessment By Resolution
- Market Opportunity Assessment By Application
- Japan Interactive Projector Top Companies Market Share
- Japan Interactive Projector Competitive Benchmarking By Technical and Operational Parameters
- Japan Interactive Projector Company Profiles
- Japan Interactive Projector Key Strategic Recommendations
Market Covered
Coverage by segment is as follows.
By Technology
- DLP
- LCD
- LCoS
By Projection Distance
- Ultra short throw
- Short throw
- Standard throw
By Dimension
- 2D
- 3D
By Resolution
- 1920*1080 and 1920*720
- 1280*800
- 1024*768
- Others (854*480)
By Application
- Education
- Corporate
- Government