Japan Interactive Video Wall Market Size & Growth Rate
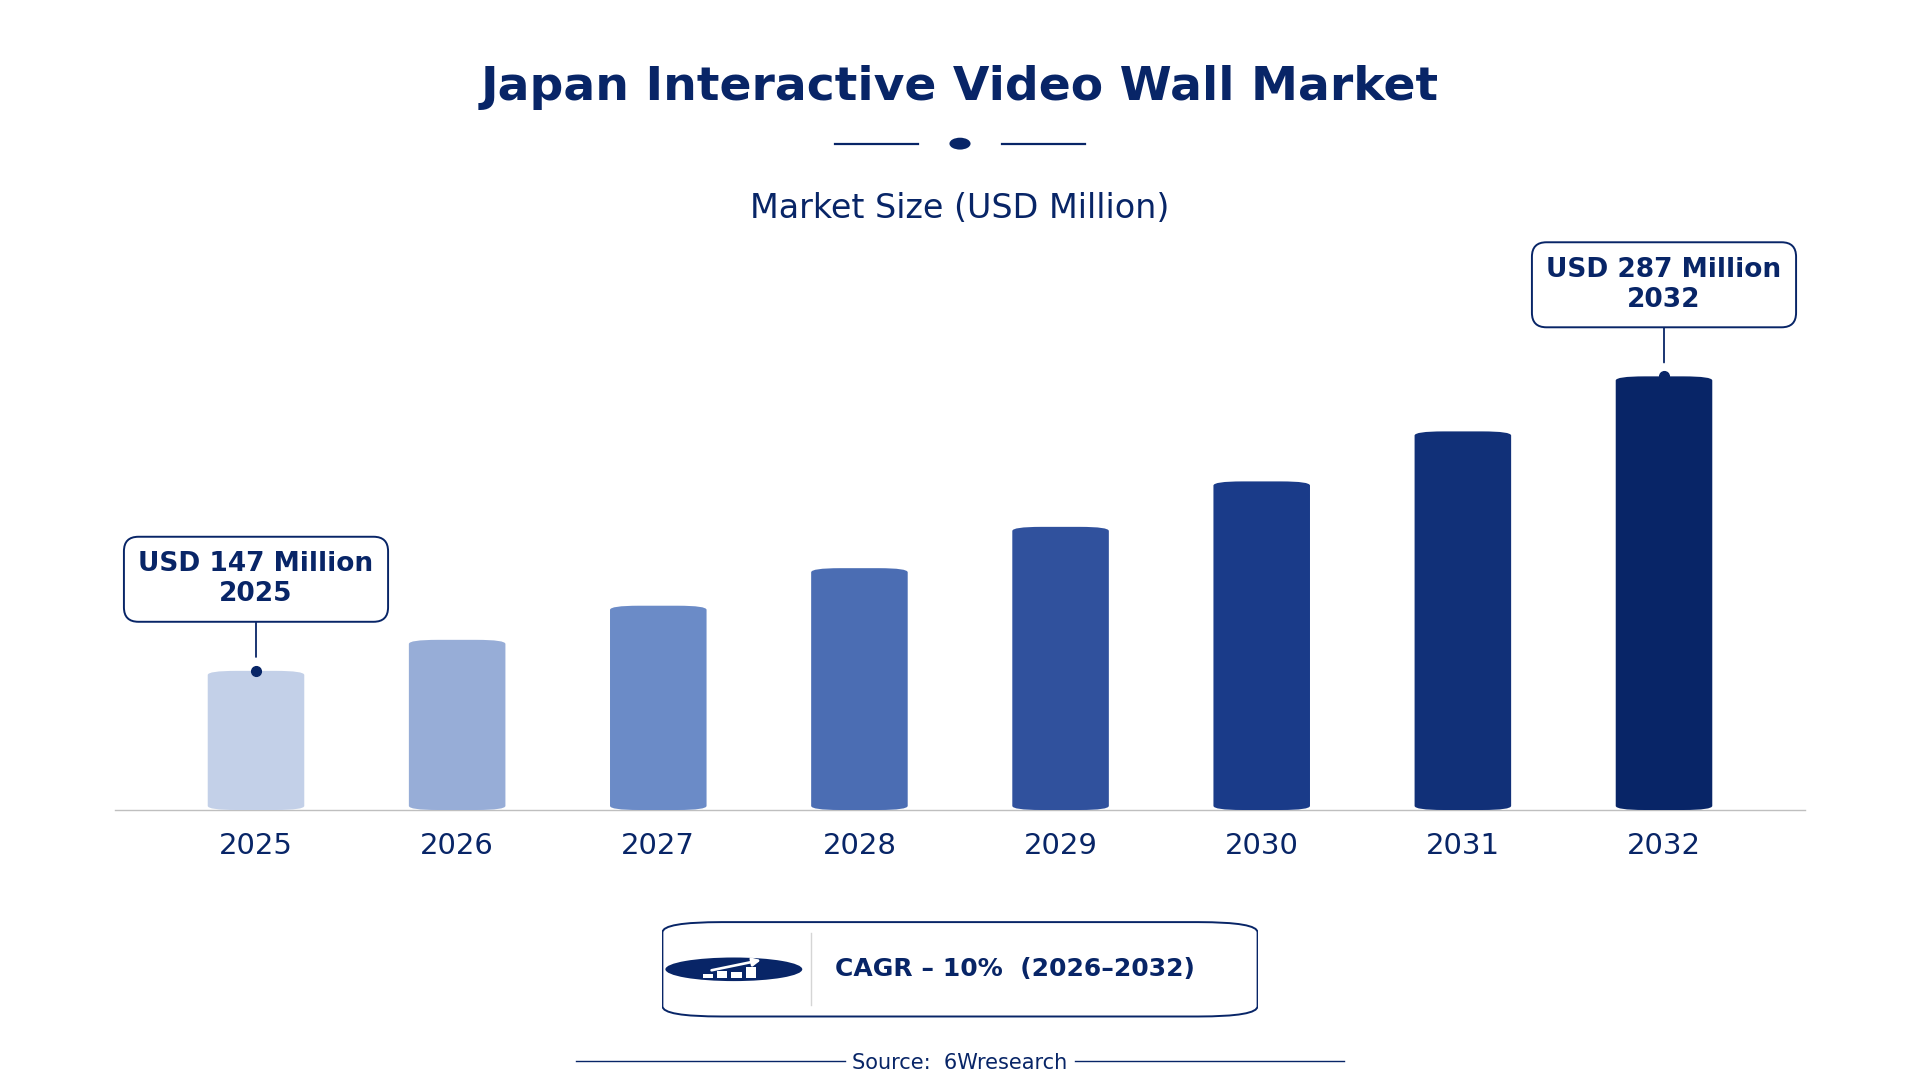
According to 6Wresearch internal database and industry insights, the Japan Interactive Video Wall Market was valued at USD 147 Million in 2025 and is projected to reach USD 287 Million by 2032, growing at a CAGR of approximately 10% during 2026–2032.
Japan Interactive Video Wall Market Highlights
| Report Metric | Details |
| Report Name | Japan Interactive Video Wall Market (2026-2032) |
| Market Size 2025 | USD 147 Million |
| Market Size 2032 | USD 287 Million |
| Absolute Growth 2025–2032 | USD 140 Million |
| CAGR 2026–2032 | 10% |
| Peak Annual Growth | 12.2% in 2026 |
| Forecast Period | 2026–2032 |
| Historical Data | 2022–2025 |
| Base Year | 2025 |
| Leading Layout, 2025 | Standard Layout (54% share) |
| Leading Display, 2025 | LED (56% share) |
| Leading End User, 2025 | Retail (33% share) |
| Fastest-Growing Layout | Custom Layout (12.0% CAGR) |
| Fastest-Growing End User | Corporate (12.9% CAGR) |
| Growing Sector | Retail |
| Key End Users | Retail, Corporate, Healthcare, Museum |
Japan Interactive Video Wall Market Year-wise Growth Rate and Key Drivers (2022–2032)
This graph illustrates the annual growth rates of the market from 2022 to 2032, highlighting a steady upward trajectory and projected market expansion over the forecast period.
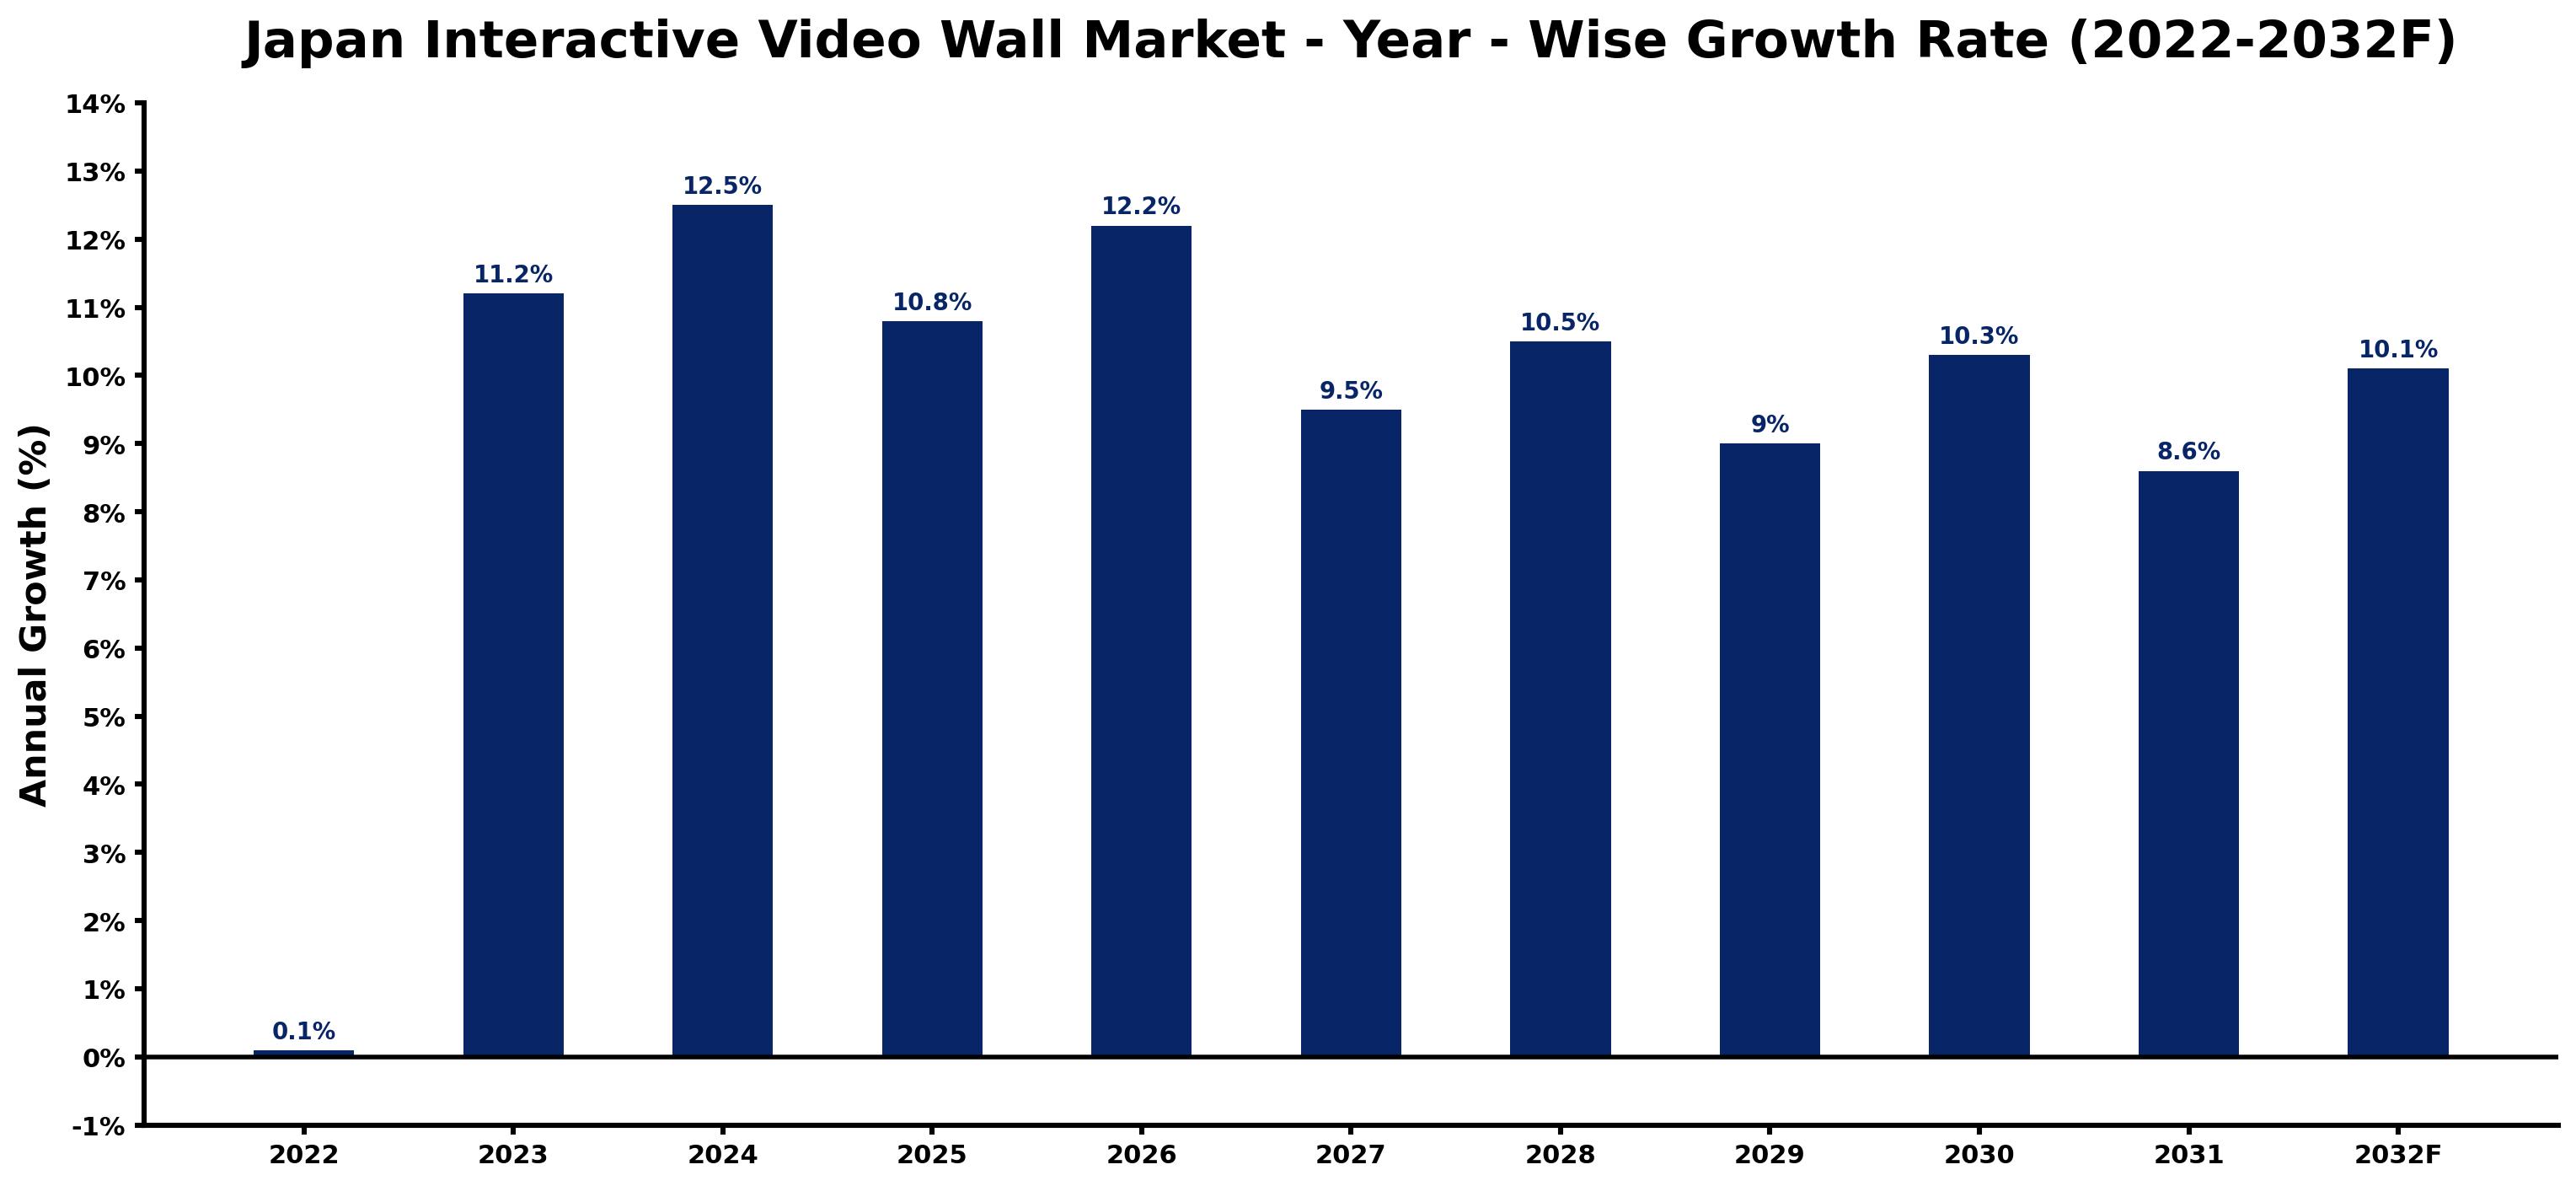
Each row of the following table gives one year's estimated growth and the event or demand shift that explains it.
| Year | Estimated Annual Growth (%) | Market Rationale |
| 2022 | 0.1 | The market experienced minimal growth, reflecting initial adjustments to market conditions. |
| 2023 | 11.2 | Demand surged as businesses resumed operations and invested in digital signage technologies. |
| 2024 | 12.5 | Growth accelerated due to increased corporate investments in interactive video walls for presentations. |
| 2025 | 10.8 | A slight slowdown occurred as the market stabilised after rapid growth in previous years. |
| 2026 | 12.2 | Demand is expected to rebound strongly as the corporate sector expands its interactive display installations. |
| 2027 | 9.5 | Growth is projected to slow as market saturation begins to affect new installations and upgrades. |
| 2028 | 10.5 | A resurgence in demand is anticipated, driven by new applications in retail environments. |
| 2029 | 9.0 | Growth is expected to moderate as competition intensifies and buyers become more selective. |
| 2030 | 10.3 | Demand will increase again as new technologies enhance user engagement capabilities. |
| 2031 | 8.6 | A slowdown is projected as the market reaches maturity and adoption levels stabilise. |
| 2032 | 10.1 | Growth is expected to pick up due to renewed investments in digital transformation across sectors. |
Note: Market size estimations and growth projections presented in this report are based on 6Wresearch's proprietary forecasting methodology, utilizing the latest available industry data, government publications, and primary research inputs.
Japan Interactive Video Wall Market Synopsis
Interactive Video Walls are large display systems that integrate multiple screens for a cohesive visual experience, utilising LCD or LED technology. They serve primarily for advertising, information dissemination, and user engagement in retail and corporate environments. The Japan Interactive Video Wall Market is growing due to substantial investments in digital signage, especially in the Tokyo metropolitan area, where demand is highest. The retail sector is set to invest heavily in these systems in 2023, driven by the need for enhanced customer experiences and engagement.
Market Dynamics Impact Analysis (2026–2032)
| Factor | Type | Impact | Primary Segment Affected |
| Increased investment in digital signage technologies | Driver | High | Retail |
| Growing adoption of interactive displays in corporate settings | Driver | High | Corporate |
| Expansion of the retail sector's digital transformation initiatives | Opportunity | High | Retail |
| Rising demand for custom layouts in interactive video walls | Opportunity | Medium | Custom Layout |
| High initial costs for installation and maintenance | Restraint | High | Standard Layout |
| Limited awareness among smaller businesses about benefits | Restraint | Medium | Corporate |
| Challenges in meeting regulatory compliance for installations | Challenge | High | Healthcare |
| Capacity constraints in production and supply chain issues | Challenge | Medium | LED |
Evaluation of Drivers in Japan Interactive Video Wall Market (2026–2032)
These are the developments adding the most demand over the forecast period.
| Drivers | Primary Segment Affected | Why It Matters (Evidence) |
| Increased digital signage adoption | Retail | The retail sector's shift towards digital engagement drives demand, with projected investments reaching USD 50 million in 2023. |
| Corporate sector expansion | Corporate | A 20% increase in interactive video wall installations by 2025 reflects growing corporate investment in technology. |
| Technological advancements in display quality | LED | LED technology's energy efficiency and brightness lead to its dominance, expected to cover 56% of the market by 2025. |
| Rising consumer engagement needs | Healthcare | Healthcare facilities are adopting interactive displays, with an average of 3 installations per hospital enhancing patient interaction. |
| Support from industry associations | Museum | The Japan Display Association promotes interactive video walls, contributing to over 60% adoption in museums by 2023. |
Several shifts outside the market lift sales. The retail sector's ongoing digital transformation is driving projected investments of USD 50 million in interactive video walls in 2023. Corporate expansions are expected to lead to a 20% increase in installations by 2025, reflecting the growing need for modern presentation tools. Technological advancements in LED displays are improving energy efficiency and brightness, with LED technology anticipated to dominate the market. Support from industry associations is stimulating growth in museum installations, with over 60% of museums integrating these systems into their exhibits.
Evaluation of Restraints in Japan Interactive Video Wall Market
The table below lists the restraints and the evidence behind each.
| Market Restraint | Primary Segment Affected | Why It Matters (Evidence) |
| High initial costs for installation and maintenance | Standard Layout | The average installation cost can exceed USD 10,000, deterring smaller businesses from investing. |
| Limited awareness among smaller businesses about benefits | Corporate | Many small enterprises lack knowledge of interactive video walls, impacting their adoption rates. |
| Regulatory compliance challenges | Healthcare | Healthcare facilities face stringent regulations that complicate the installation of interactive displays. |
| Supply chain disruptions affecting availability | LED | Recent global supply chain issues have delayed the delivery of key components for LED displays. |
| Market saturation leading to competition | Custom Layout | As more providers enter the market, pricing pressures are increasing, affecting profit margins. |
Japan Interactive Video Wall Market Challenges
Producers in Tokyo face intense competition from both local and global manufacturers, which drives down prices and squeezes profit margins. Compliance with the JIS X 0129 standard requires extensive testing and certification, delaying product launches by up to six months for producers. Rising raw material costs, particularly for LED components, can increase production expenses by 15%, which pressures suppliers to adjust their pricing strategies. Buyers in the retail sector experience longer lead times as suppliers struggle to meet demand, potentially leading to missed sales opportunities and diminished customer satisfaction.
Trends in the Japan Interactive Video Wall Market
Buyers and suppliers in the Japan Interactive Video Wall Market are adjusting to the following trends.
- Retailers Increasing Investment in Interactive Displays: Retailers are adopting interactive video walls to improve customer engagement, with investments projected to reach USD 50 million in 2023. This shift is particularly visible in Tokyo, where stores are integrating these systems to attract customers.
- Transition to Custom Layouts: The trend towards custom layouts began in 2023 as businesses sought tailored solutions for their display needs. This change is particularly visible in Osaka, where companies are opting for configurations that suit their specific environments.
- Shift to LED Technology: Since 2023, there has been a marked shift towards LED technology in video walls due to its energy efficiency and brightness. This trend is dominating installations across corporate offices, with LED displays expected to cover 56% of the market by 2025.
- Increased Adoption in Museums: In 2023, over 60% of museums in Japan integrated interactive video walls into their exhibits, improving visitor engagement. This trend highlights the growing importance of technology in educational displays.
Investment Opportunities in the Japan Interactive Video Wall Market
Several openings in the Japan Interactive Video Wall Market merit attention from investors.
- Supply of Interactive Video Walls: With the retail sector projected to invest USD 50 million in 2023, suppliers can focus on providing interactive video walls tailored for customer engagement in stores.
- Custom Layout Solutions for Corporate Clients: Corporate clients in Tokyo are seeking custom layout solutions to improve presentations, creating opportunities for suppliers to develop tailored configurations.
- Investment in Healthcare Displays: The healthcare sector is increasingly adopting interactive displays, with hospitals averaging three installations each. Suppliers can target this growing market segment with tailored solutions.
- Expansion in Museum Installations: With over 60% of museums adopting interactive video walls, suppliers can enter this market by partnering with cultural institutions to provide engaging display solutions.
Government Initiatives in the Japan Interactive Video Wall Market
The Long-Term Care Insurance Act, effective since 2000, mandates certain standards for healthcare facilities, influencing the adoption of interactive video walls in hospitals. Compliance with the Medical Care Act ensures that healthcare providers maintain high-quality patient engagement through technology, thereby increasing demand for interactive displays. As a result, healthcare facilities are investing in these systems to enhance patient experiences and meet regulatory requirements.
The Ministry of Economy, Trade and Industry's digital signage initiative, launched in 2023, allocates USD 10 million to promote technology adoption in public spaces. This funding encourages various sectors, including retail and corporate, to integrate interactive video walls into their operations, enhancing user engagement and information dissemination. The Japan Display Association also plays a key role in supporting these advancements, facilitating approvals and standards for new installations.
Future Insight of the Japan Interactive Video Wall Market
Advancements in display technology will reshape demand for interactive video walls, with energy efficiency improving by 30% by 2032. The digital signage initiative from the Ministry of Economy, Trade and Industry will drive widespread adoption across various sectors, particularly in public spaces. By 2032, hospitals are projected to install an average of 5 video walls each, significantly enhancing patient engagement. Implementation of ISO 9241 standards will improve usability, making displays more effective in capturing user attention.
Market Segmentation Analysis
Japan Interactive Video Wall Market report covers a detailed analysis of the following market segments:
By Layout – Standard Layout Leads, Custom Layout Expected to Grow Fastest
According to Shubham Padhi, Research Analyst at 6Wresearch, Standard Layout held 54% of the Japan Interactive Video Wall Market by layout in 2025. The Standard Layout captures a large share due to its straightforward design and frequent use in various environments. For instance, corporate offices in Tokyo often utilise this layout for consistent visual presentations across multiple screens. Custom Layout is projected to grow fastest, at a CAGR of 12.0% during 2026–2032. Custom Layout is experiencing notable growth as businesses increasingly demand unique configurations that reflect their branding and engagement goals. This trend is particularly evident as more retail spaces in Japan adopt customised designs to improve customer interaction. Suppliers must offer adaptable layout options to meet the varied preferences of their clients.
By Display – LED Leads and Records the Fastest Growth
The largest display category in 2025 was LED, at 56% of revenue. LED technology dominates the market because of its superior brightness and energy efficiency, making it ideal for extensive installations. This is particularly relevant in bustling areas such as shopping centres where visibility is crucial. LED is also forecast to expand faster than any other category, at a CAGR of 12.1% over 2026–2032. The growth of the LED segment is fuelled by continuous improvements that boost performance while reducing costs. This ensures LED technology remains the preferred choice for both new setups and existing upgrades. Buyers should prioritise LED technology for its long-term savings and exceptional performance.
By End User – Retail Leads, Corporate Expected to Grow Fastest
With 33% of end user revenue in 2025, Retail was the largest category. The Retail sector holds the largest share as interactive video walls are widely used for advertising and enhancing customer engagement in stores. The retail industry in Japan is set to invest significantly in these technologies in 2023. Corporate is set to record the highest CAGR in this split, 12.9% over 2026–2032. The Corporate sector is rapidly growing as companies increasingly adopt interactive video walls for presentations and information sharing. With a forecasted 20% increase in installations by 2025, this segment is on a fast track to expansion. Suppliers should tailor their offerings to address the distinct needs of both retail and corporate clients.
Key Attractiveness of the Report
- 10 Years of Market Numbers
- Historical Data Starting from 2022 to 2025
- Base Year 2025
- Forecast Data until 2032
- Key Performance Indicators Impacting the Market
- Major Upcoming Developments and Projects
Key Highlights of the Report:
- Japan Interactive Video Wall Market Outlook
- Market Size of Japan Interactive Video Wall Market, 2025
- Forecast of Japan Interactive Video Wall Market, 2032
- Historical Data and Forecast of Japan Interactive Video Wall Revenues & Volume for the Period 2022-2032
- Japan Interactive Video Wall Market Trend Evolution
- Japan Interactive Video Wall Market Drivers and Challenges
- Japan Interactive Video Wall Price Trends
- Japan Interactive Video Wall Porter's Five Forces
- Japan Interactive Video Wall Industry Life Cycle
- Historical Data and Forecast of Japan Interactive Video Wall Market Revenues & Volume By Layout for the Period 2022-2032
- Historical Data and Forecast of Japan Interactive Video Wall Market Revenues & Volume By Standard Layout for the Period 2022-2032
- Historical Data and Forecast of Japan Interactive Video Wall Market Revenues & Volume By Custom Layout for the Period 2022-2032
- Historical Data and Forecast of Japan Interactive Video Wall Market Revenues & Volume By Display for the Period 2022-2032
- Historical Data and Forecast of Japan Interactive Video Wall Market Revenues & Volume By LCD for the Period 2022-2032
- Historical Data and Forecast of Japan Interactive Video Wall Market Revenues & Volume By LED for the Period 2022-2032
- Historical Data and Forecast of Japan Interactive Video Wall Market Revenues & Volume By Others for the Period 2022-2032
- Historical Data and Forecast of Japan Interactive Video Wall Market Revenues & Volume By End User for the Period 2022-2032
- Historical Data and Forecast of Japan Interactive Video Wall Market Revenues & Volume By Retail for the Period 2022-2032
- Historical Data and Forecast of Japan Interactive Video Wall Market Revenues & Volume By Corporate for the Period 2022-2032
- Historical Data and Forecast of Japan Interactive Video Wall Market Revenues & Volume By Transportation for the Period 2022-2032
- Historical Data and Forecast of Japan Interactive Video Wall Market Revenues & Volume By Healthcare for the Period 2022-2032
- Historical Data and Forecast of Japan Interactive Video Wall Market Revenues & Volume By Hospitality for the Period 2022-2032
- Historical Data and Forecast of Japan Interactive Video Wall Market Revenues & Volume By Museum for the Period 2022-2032
- Historical Data and Forecast of Japan Interactive Video Wall Market Revenues & Volume By Others for the Period 2022-2032
- Japan Interactive Video Wall Import Export Trade Statistics
- Market Opportunity Assessment By Layout
- Market Opportunity Assessment By Display
- Market Opportunity Assessment By End User
- Japan Interactive Video Wall Top Companies Market Share
- Japan Interactive Video Wall Competitive Benchmarking By Technical and Operational Parameters
- Japan Interactive Video Wall Company Profiles
- Japan Interactive Video Wall Key Strategic Recommendations
Market Covered
This report examines the market across the segments below.
By Layout
- Standard Layout
- Custom Layout
By Display
- LCD
- LED
- Others
By End User
- Retail
- Corporate
- Transportation
- Healthcare
- Hospitality
- Museum
- Others































