Japan Pay TV Operator Market Size & Growth Rate
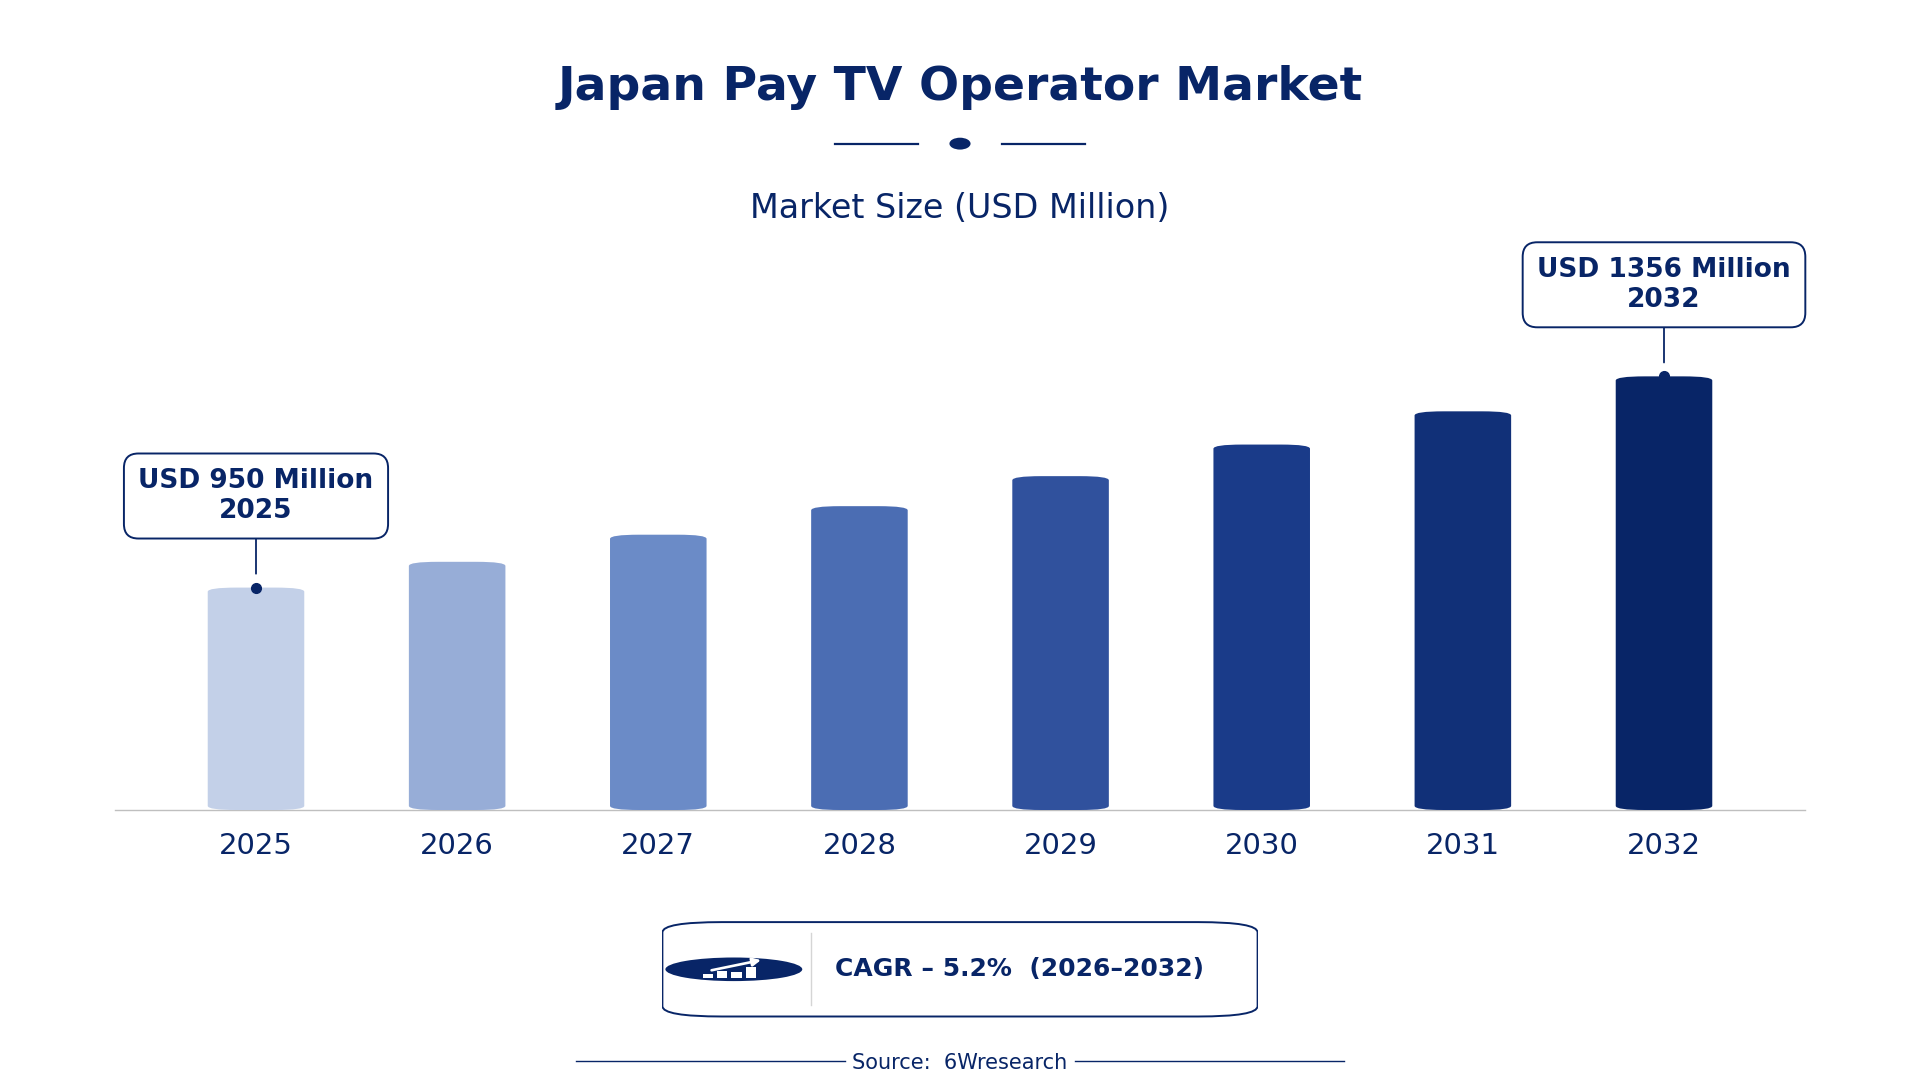
According to 6Wresearch internal database and industry insights, the Japan Pay TV Operator Market was valued at USD 950 Million in 2025 and is projected to reach USD 1,356 Million by 2032, growing at a CAGR of approximately 5.2% during 2026–2032.
Japan Pay TV Operator Market Highlights
| Report Metric | Details |
| Report Name | Japan Pay TV Operator Market (2026-2032) |
| Market Size 2025 | USD 950 Million |
| Market Size 2032 | USD 1,356 Million |
| Absolute Growth 2025–2032 | USD 406 Million |
| CAGR 2026–2032 | 5.2% |
| Peak Annual Growth | 6.2% in 2029 |
| Forecast Period | 2026–2032 |
| Historical Data | 2022–2025 |
| Base Year | 2025 |
| Leading Service Type, 2025 | Broadcast (31% share) |
| Leading Subscription Model, 2025 | Monthly (32% share) |
| Leading Revenue Model, 2025 | Subscription-Based (32% share) |
| Leading Platform, 2025 | Set-Top Box (39% share) |
| Leading End User, 2025 | Individual Consumers (36% share) |
| Fastest-Growing Service Type | OTT (7.5% CAGR) |
| Fastest-Growing Subscription Model | Freemium (7.0% CAGR) |
| Fastest-Growing Revenue Model | Hybrid Model (7.2% CAGR) |
| Fastest-Growing Platform | Mobile Apps (7.6% CAGR) |
| Fastest-Growing End User | Hospitality (6.9% CAGR) |
| Growing Sector | Entertainment |
| Key End Users | Individual Consumers, Hotels, Public Venues |
Japan Pay TV Operator Market Year-wise Growth Rate and Key Drivers (2022–2032)
This graph illustrates the annual growth rates of the market from 2022 to 2032, highlighting a steady upward trajectory and projected market expansion over the forecast period.
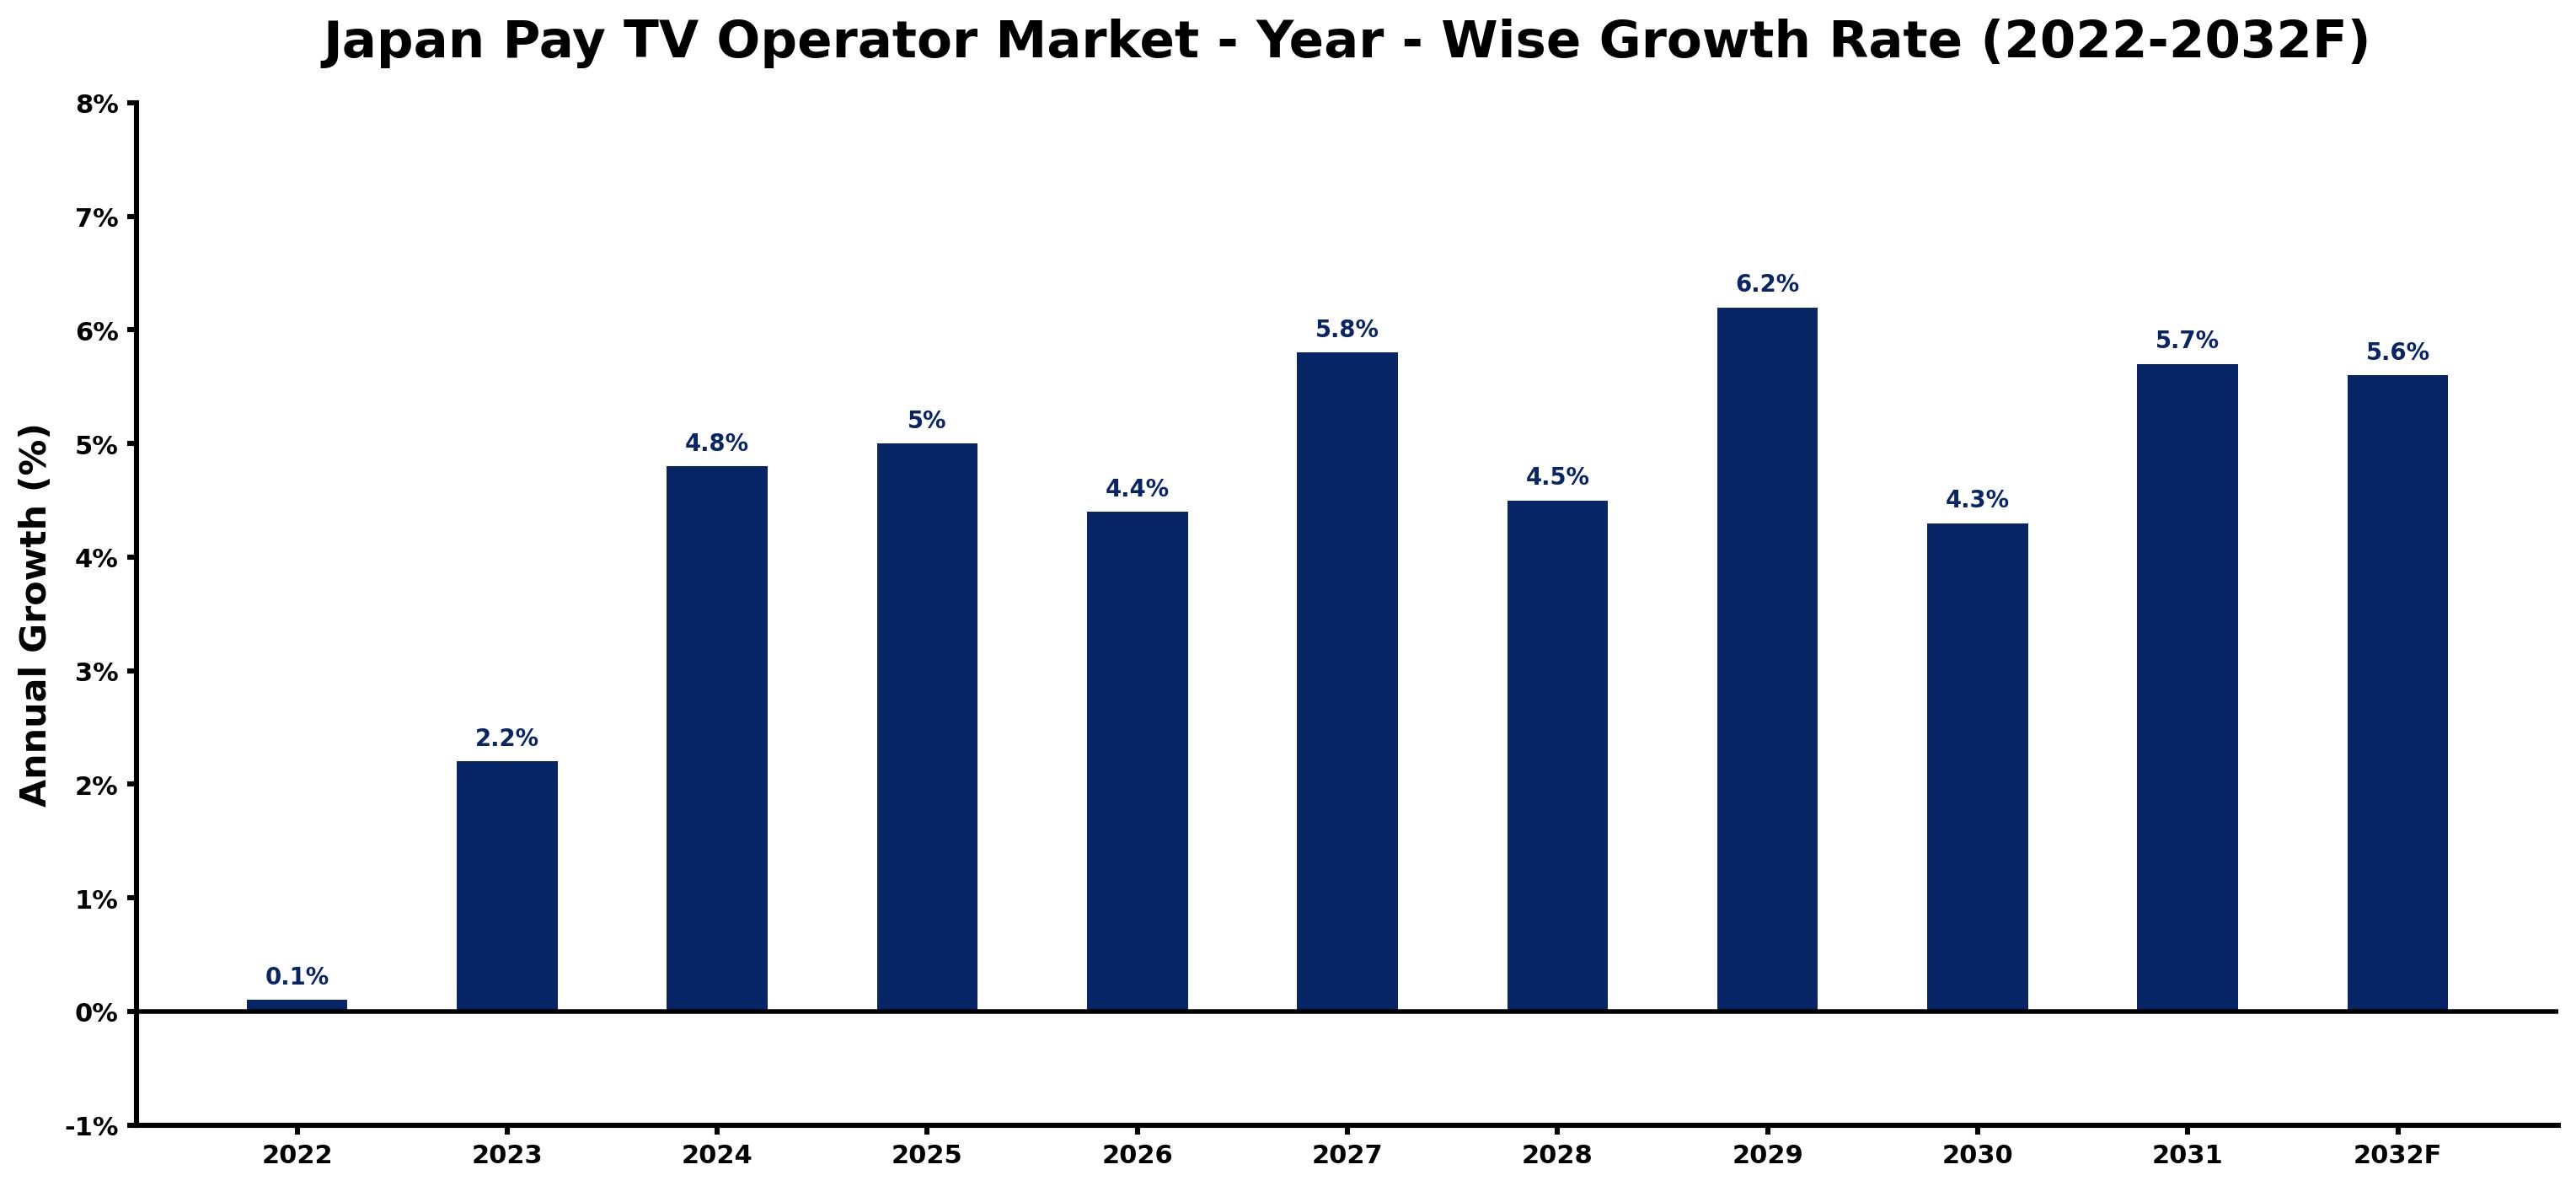
Annual growth estimates for each year appear below with the principal reason behind them, explaining the shifts that set the pace of the market.
| Year | Estimated Annual Growth (%) | Market Rationale |
| 2022 | 0.1 | The market showed minimal growth due to limited new service offerings. |
| 2023 | 2.2 | Growth was driven by increased interest in IPTV services and on-demand content. |
| 2024 | 4.8 | The rise in subscriptions was supported by improved service quality and variety. |
| 2025 | 5.0 | A peak in growth was reached as pay TV services expanded in urban areas. |
| 2026 | 4.4 | Growth is expected to slow as market saturation begins to impact new subscriber acquisition. |
| 2027 | 5.8 | An increase in demand for diverse programming options spurs growth. |
| 2028 | 4.5 | Growth is projected to slow again as competition intensifies among service providers. |
| 2029 | 6.2 | A peak in annual growth occurs due to a surge in OTT service adoption. |
| 2030 | 4.3 | Growth is expected to slow as the market adjusts to changing consumer preferences. |
| 2031 | 5.7 | An increase in premium content offerings drives higher subscription rates. |
| 2032 | 5.6 | Growth is projected to slow slightly as the market stabilises after rapid expansions. |
Note: Market size estimations and growth projections presented in this report are based on 6Wresearch's proprietary forecasting methodology, utilizing the latest available industry data, government publications, and primary research inputs.
Japan Pay TV Operator Market Synopsis
Pay TV operators in Japan provide subscription-based television services through platforms such as cable, satellite, and internet, utilising set-top boxes or smart TVs. With over 20 million subscribers, the Japan Pay TV Operator Market is expanding, driven by urban demand, a 15% rise in IPTV subscriptions, and the projected growth of OTT services to 50% of total video consumption by 2025. This growth is supported by increasing consumer interest in diverse programming and on-demand content options.
Market Dynamics Impact Analysis (2026–2032)
| Factor | Type | Impact | Primary Segment Affected |
| Rising demand for IPTV services | Driver | High | IPTV |
| Increased interest in OTT platforms | Driver | High | OTT |
| Growing urban population | Opportunity | High | Multichannel |
| Expansion of smart TV usage | Opportunity | High | Smart TV |
| Market saturation in urban areas | Restraint | High | Broadcast |
| High subscription costs for consumers | Restraint | Medium | Subscription-Based |
| Intense competition among service providers | Challenge | High | Digital Terrestrial |
| Regulatory compliance costs for operators | Challenge | Medium | Broadcast |
Evaluation of Drivers in Japan Pay TV Operator Market (2026–2032)
Key forces behind demand, with the segment each one moves most, are listed below.
| Drivers | Primary Segment Affected | Why It Matters (Evidence) |
| Increase in IPTV subscribers | IPTV | A 15% rise in IPTV subscribers in 2023 indicates a shift towards on-demand content. |
| Growth of OTT services | OTT | OTT services are projected to reach 50% of total video consumption by 2025, driving demand. |
| Urbanisation trends | Multichannel | Tokyo's high concentration of pay TV users fuels demand for diverse programming options, increasing subscriptions. |
| Smart TV adoption | Smart TV | Smart TVs accounted for 40% of pay TV access in 2023, improving viewing experiences. |
| Rising entertainment budgets | Subscription-Based | The average household spends about 10% of its entertainment budget on pay TV services. |
A broader customer base accounts for much of the growth, as urbanisation fuels demand for pay TV services. Households typically allocate around 10% of their entertainment budget to pay TV, reflecting strong consumer commitment. Urban centres, especially Tokyo, show a high density of pay TV users, which supports diverse programming options and drives subscriptions. The increasing demand for on-demand services mirrors changing viewer preferences, prompting operators to refine their content offerings.
Evaluation of Restraints in Japan Pay TV Operator Market
These are the pressures that could keep growth below its potential.
| Market Restraint | Primary Segment Affected | Why It Matters (Evidence) |
| Market saturation in urban areas | Broadcast | As urban areas become saturated, attracting new subscribers becomes increasingly challenging. |
| High subscription costs for consumers | Subscription-Based | The average monthly subscription fee of around 4,000 JPY may deter potential subscribers. |
| Regulatory compliance costs | Digital Terrestrial | Compliance with broadcasting regulations increases operational costs for service providers, affecting profitability. |
| Limited content variety in some regions | Multichannel | Certain regions may experience a lack of diverse programming options, impacting subscriber growth. |
| Competition from free streaming services | OTT | The rise of free streaming platforms poses a challenge to pay TV subscription growth. |
Japan Pay TV Operator Market Challenges
Buyers face a shortage of skilled technicians for pay TV installation and maintenance, a situation exacerbated by an ageing workforce and inadequate training programmes. This skills gap hampers service deployment and raises operational costs, adversely affecting customer satisfaction for providers. Fierce competition compels suppliers to adopt aggressive pricing strategies, which compress profit margins and may compromise service quality. Regulatory compliance necessitates substantial investments in technology upgrades, straining budgets for smaller operators and limiting their competitiveness in urban markets like Tokyo.
Trends in the Japan Pay TV Operator Market
Several trends are reshaping the Japan Pay TV Operator Market; the most important are set out below.
- Tokyo's Shift towards Smart TV Usage: Tokyo is experiencing a notable shift towards smart TV usage for pay TV access, with 50% of users opting for this platform in 2023. This trend indicates a growing preference for integrated viewing experiences, prompting operators to adapt their service offerings.
- Increased Adoption of IPTV Services: Individual consumers are increasingly adopting IPTV services, with a 15% rise in subscribers in 2023. This shift highlights the demand for on-demand content, pushing operators to invest in improved service quality.
- Growth of OTT Content Consumption: OTT services are projected to reach 50% of total video consumption by 2025. This trend reflects changing viewer preferences, encouraging operators to diversify their content offerings to remain competitive.
- Expansion of Pay TV in Public Venues: Public venues like sports bars are increasingly subscribing to pay TV for live sports. This trend underscores the importance of pay TV in enhancing customer experiences, with many venues investing in premium content.
Investment Opportunities in the Japan Pay TV Operator Market
The following areas offer the clearest openings for investors and suppliers in the Japan Pay TV Operator Market.
- Establishing Partnerships with Local Content Providers: Creating joint ventures with local content providers can improve service offerings. The Tokyo Metropolitan Area presents a prime opportunity for pay TV operators to tap into a diverse audience, with over 20 million subscribers.
- Investment in Smart TV Content: Investing in content tailored for smart TVs can capture a growing audience segment. The rise of smart TV usage in urban areas indicates a demand for innovative programming solutions, with 40% of pay TV access coming from this platform.
- Enhancement of On-Demand Services: Expanding on-demand service offerings can attract more subscribers. The increasing interest in IPTV services among individual consumers demonstrates a clear market gap, with a 15% rise in subscribers in 2023.
- Development of Affordable Subscription Models: Creating more affordable subscription options can cater to cost-sensitive consumers. With the average monthly fee around 4,000 JPY, there is room for competitive pricing strategies to attract new users.
Government Initiatives in the Japan Pay TV Operator Market
The Electrical Appliance and Material Safety Act of 1961 regulates the safety of electrical appliances, including those used in pay TV services. This law ensures that equipment meets safety standards, protecting consumers and ensuring service reliability. The AI Promotion Act of 2025 establishes a framework for AI research and development, which may influence content delivery and service enhancement in the pay TV sector.
In 2023, the government initiated a digital broadcasting initiative aimed at improving service quality for pay TV operators. The Ministry of Internal Affairs and Communications oversees this initiative, which includes funding for infrastructure upgrades and technology improvements, benefiting both producers and consumers.
Future Insight of the Japan Pay TV Operator Market
The shift towards digital broadcasting will drive suppliers to invest in advanced content delivery systems, responding to government initiatives aimed at improving service quality. By 2025, OTT services are expected to account for 50% of video consumption, prompting providers to innovate to retain subscribers. The JIS X 8341 standard will enhance accessibility, particularly benefiting the increasing number of senior users. With annual revenue surpassing 800 billion JPY, the market will likely attract substantial investments focused on improving content quality and user experience.
Market Segmentation Analysis
Japan Pay TV Operator Market report covers a detailed analysis of the following market segments:
By Service Type – Broadcast Leads, OTT Expected to Grow Fastest
According to Vasudha, AM at 6Wresearch, the largest service type category in 2025 was Broadcast, at 31% of revenue. Broadcast services dominate the market due to their essential role in delivering live content, especially for events like sports that attract large audiences. In regions such as Tokyo, where pay TV usage is concentrated, these services meet the immediate viewing needs of consumers. OTT is projected to grow fastest, at a CAGR of 7.5% during 2026–2032. OTT services are rapidly expanding as they provide flexible access to content via the internet, appealing to a younger demographic. With forecasts suggesting OTT will account for 50% of total video consumption by 2025, this growth trajectory is set to continue. Suppliers must enhance their OTT offerings to cater to the growing demand for flexible viewing options.
By Subscription Model – Monthly Leads, Freemium Expected to Grow Fastest
Monthly took 32% of subscription model revenue in 2025, more than any other category. The monthly subscription model is prevalent as it offers flexibility to consumers, allowing them to manage their entertainment budgets effectively. This model is widely adopted across various demographics, ensuring a steady revenue stream for operators. Freemium is set to record the highest CAGR in this split, 7.0% over 2026–2032. Freemium models are emerging as a growth area, albeit with limited current use, as they attract users who prefer no upfront costs. This model can potentially convert free users into paying subscribers over time. Providers may need to consider integrating freemium options to attract new users and increase overall subscriber numbers.
By Revenue Model – Subscription-Based Leads, Hybrid Model Expected to Grow Fastest
In 2025, Subscription-Based led the revenue model split with a 32% share. Subscription-based revenue models are prevalent in Japan's pay TV market, providing operators with consistent income streams. This model aligns with consumer preferences for uninterrupted viewing experiences, particularly in urban areas where competition is fierce. Over 2026–2032, Hybrid Model is expected to post the fastest growth, at a CAGR of 7.2%. The hybrid model is emerging as a popular choice, combining various revenue streams to attract a broader audience. This approach allows operators to optimise their revenue potential by appealing to diverse consumer preferences and viewing habits. Operators should explore hybrid revenue strategies to diversify their income and mitigate risks associated with reliance on a single model.
By Platform – Set-Top Box Leads, Mobile Apps Expected to Grow Fastest
Set-Top Box accounted for 39% of the market by platform in 2025. Set-top boxes remain the primary device for accessing pay TV services, ensuring compatibility with a wide range of content. Their established presence in households across Japan underscores their importance in delivering high-quality viewing experiences. The quickest growth will come from Mobile Apps, forecast to expand at a CAGR of 7.6% between 2026 and 2032. Mobile apps are experiencing rapid adoption as they enable users to access content on-the-go, catering to the increasing demand for convenience. This shift towards mobile usage reflects changing consumer habits, especially among younger audiences. Investing in mobile app capabilities will be crucial for operators to stay relevant in a market that increasingly values portability.
By End User – Individual Consumers Lead, Hospitality Expected to Grow Fastest
With 36% of end user revenue in 2025, Individual Consumers was the largest category. Individual consumers represent the largest segment of pay TV users, motivated by a desire for diverse entertainment options. This broad demographic ensures a stable demand for various content offerings, making them a key focus for service providers. Hospitality is projected to grow fastest, at a CAGR of 6.9% during 2026–2032. The hospitality sector is increasingly adopting pay TV services to enhance customer satisfaction and provide quality entertainment. This trend indicates a growing recognition of the value of premium services in customer-oriented industries. Operators should tailor their offerings to meet the specific demands of the hospitality sector to leverage this expanding market.
Key Attractiveness of the Report
- 10 Years of Market Numbers
- Historical Data Starting from 2022 to 2025
- Base Year 2025
- Forecast Data until 2032
- Key Performance Indicators Impacting the Market
- Major Upcoming Developments and Projects
Key Highlights of the Report:
- Japan Pay TV Operator Market Outlook
- Market Size of Japan Pay TV Operator Market,2025
- Forecast of Japan Pay TV Operator Market, 2032
- Historical Data and Forecast of Japan Pay TV Operator Revenues & Volume for the Period 2022-2032
- Japan Pay TV Operator Market Trend Evolution
- Japan Pay TV Operator Market Drivers and Challenges
- Japan Pay TV Operator Price Trends
- Japan Pay TV Operator Porter's Five Forces
- Japan Pay TV Operator Industry Life Cycle
- Historical Data and Forecast of Japan Pay TV Operator Market Revenues & Volume By Service Type for the Period 2022-2032
- Historical Data and Forecast of Japan Pay TV Operator Market Revenues & Volume By Broadcast for the Period 2022-2032
- Historical Data and Forecast of Japan Pay TV Operator Market Revenues & Volume By Multichannel for the Period 2022-2032
- Historical Data and Forecast of Japan Pay TV Operator Market Revenues & Volume By IPTV for the Period 2022-2032
- Historical Data and Forecast of Japan Pay TV Operator Market Revenues & Volume By OTT for the Period 2022-2032
- Historical Data and Forecast of Japan Pay TV Operator Market Revenues & Volume By Digital Terrestrial for the Period 2022-2032
- Historical Data and Forecast of Japan Pay TV Operator Market Revenues & Volume By Subscription Model for the Period 2022-2032
- Historical Data and Forecast of Japan Pay TV Operator Market Revenues & Volume By Monthly for the Period 2022-2032
- Historical Data and Forecast of Japan Pay TV Operator Market Revenues & Volume By Annual for the Period 2022-2032
- Historical Data and Forecast of Japan Pay TV Operator Market Revenues & Volume By Pay-Per-View for the Period 2022-2032
- Historical Data and Forecast of Japan Pay TV Operator Market Revenues & Volume By Free & Paid for the Period 2022-2032
- Historical Data and Forecast of Japan Pay TV Operator Market Revenues & Volume By Freemium for the Period 2022-2032
- Historical Data and Forecast of Japan Pay TV Operator Market Revenues & Volume By Revenue Model for the Period 2022-2032
- Historical Data and Forecast of Japan Pay TV Operator Market Revenues & Volume By Ad-Supported for the Period 2022-2032
- Historical Data and Forecast of Japan Pay TV Operator Market Revenues & Volume By Subscription-Based for the Period 2022-2032
- Historical Data and Forecast of Japan Pay TV Operator Market Revenues & Volume By Hybrid Model for the Period 2022-2032
- Historical Data and Forecast of Japan Pay TV Operator Market Revenues & Volume By Premium for the Period 2022-2032
- Historical Data and Forecast of Japan Pay TV Operator Market Revenues & Volume By Transactional for the Period 2022-2032
- Historical Data and Forecast of Japan Pay TV Operator Market Revenues & Volume By Platform for the Period 2022-2032
- Historical Data and Forecast of Japan Pay TV Operator Market Revenues & Volume By Set-Top Box for the Period 2022-2032
- Historical Data and Forecast of Japan Pay TV Operator Market Revenues & Volume By Smart TV for the Period 2022-2032
- Historical Data and Forecast of Japan Pay TV Operator Market Revenues & Volume By Mobile Apps for the Period 2022-2032
- Historical Data and Forecast of Japan Pay TV Operator Market Revenues & Volume By Desktop for the Period 2022-2032
- Historical Data and Forecast of Japan Pay TV Operator Market Revenues & Volume By Cable Box for the Period 2022-2032
- Historical Data and Forecast of Japan Pay TV Operator Market Revenues & Volume By End User for the Period 2022-2032
- Historical Data and Forecast of Japan Pay TV Operator Market Revenues & Volume By Individual Consumers for the Period 2022-2032
- Historical Data and Forecast of Japan Pay TV Operator Market Revenues & Volume By Enterprises for the Period 2022-2032
- Historical Data and Forecast of Japan Pay TV Operator Market Revenues & Volume By Hotels for the Period 2022-2032
- Historical Data and Forecast of Japan Pay TV Operator Market Revenues & Volume By Hospitality for the Period 2022-2032
- Historical Data and Forecast of Japan Pay TV Operator Market Revenues & Volume By Public Venues for the Period 2022-2032
- Japan Pay TV Operator Import Export Trade Statistics
- Market Opportunity Assessment By Service Type
- Market Opportunity Assessment By Subscription Model
- Market Opportunity Assessment By Revenue Model
- Market Opportunity Assessment By Platform
- Market Opportunity Assessment By End User
- Japan Pay TV Operator Top Companies Market Share
- Japan Pay TV Operator Competitive Benchmarking By Technical and Operational Parameters
- Japan Pay TV Operator Company Profiles
- Japan Pay TV Operator Key Strategic Recommendations
Market Covered
Coverage by segment is as follows.
By Service Type
- Broadcast
- Multichannel
- IPTV
- OTT
- Digital Terrestrial
By Subscription Model
- Monthly
- Annual
- Pay-Per-View
- Free & Paid
- Freemium
By Revenue Model
- Ad-Supported
- Subscription-Based
- Hybrid Model
- Premium
- Transactional
By Platform
- Set-Top Box
- Smart TV
- Mobile Apps
- Desktop
- Cable Box
By End User
- Individual Consumers
- Enterprises
- Hotels
- Hospitality
- Public Venues































