Japan Snack Bar Market Size & Growth Rate
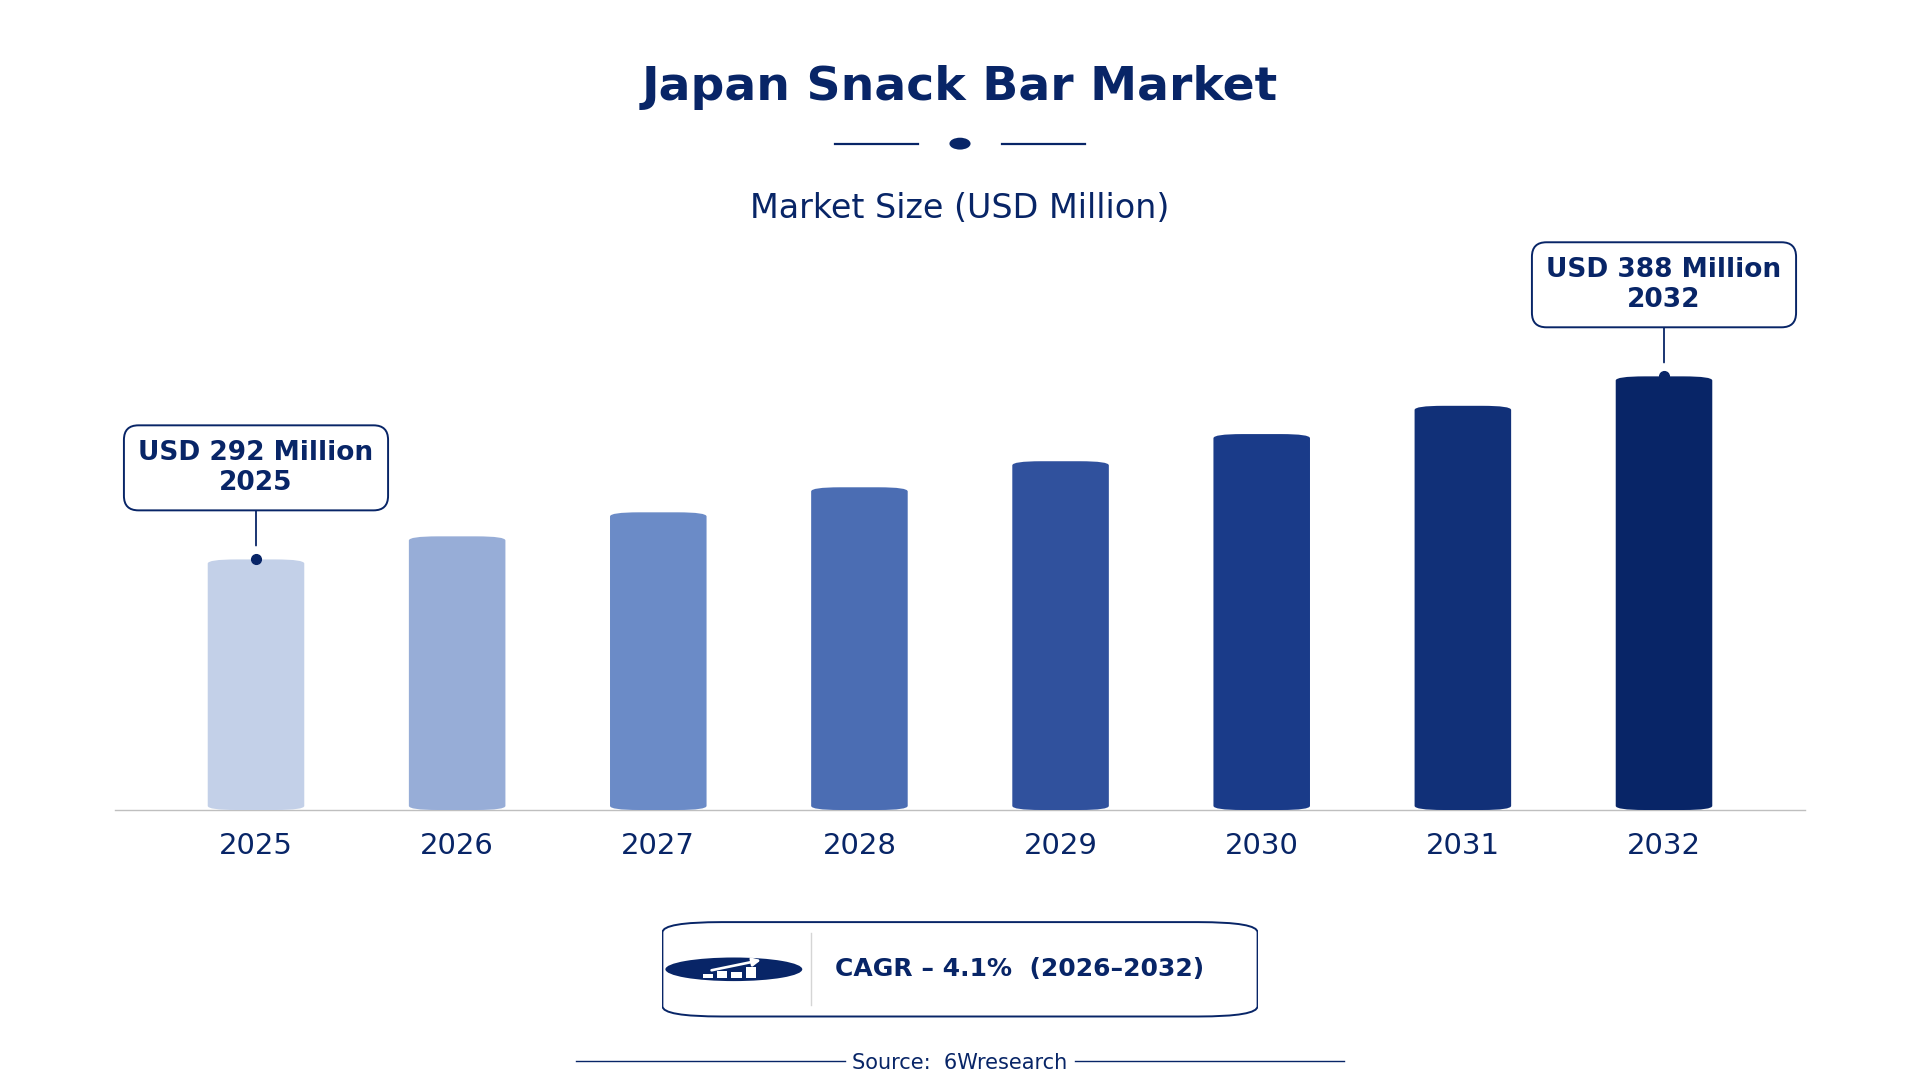
According to 6Wresearch internal database and industry insights, the Japan Snack Bar Market was valued at USD 292 Million in 2025 and is projected to reach USD 388 Million by 2032, growing at a CAGR of approximately 4.1% during 2026–2032.
Japan Snack Bar Market Highlights
| Report Metric | Details |
| Report Name | Japan Snack Bar Market (2026-2032) |
| Market Size 2025 | USD 292 Million |
| Market Size 2032 | USD 388 Million |
| Absolute Growth 2025–2032 | USD 96 Million |
| CAGR 2026–2032 | 4.1% |
| Peak Annual Growth | 5.7% in 2027 |
| Forecast Period | 2026–2032 |
| Historical Data | 2022–2025 |
| Base Year | 2025 |
| Leading Confectionery Variant, 2025 | Cereal Bar (47% share) |
| Leading Distribution Channel, 2025 | Convenience Store (48% share) |
| Fastest-Growing Confectionery Variant | Protein Bar (5.2% CAGR) |
| Fastest-Growing Distribution Channel | Online Retail Store (5.1% CAGR) |
| Growing Sector | Health-Conscious Snacking |
| Key End Users | Urban consumers, fitness enthusiasts, health-conscious individuals, busy professionals |
Japan Snack Bar Market Year-wise Growth Rate and Key Drivers (2022–2032)
This graph illustrates the annual growth rates of the market from 2022 to 2032, highlighting a steady upward trajectory and projected market expansion over the forecast period.
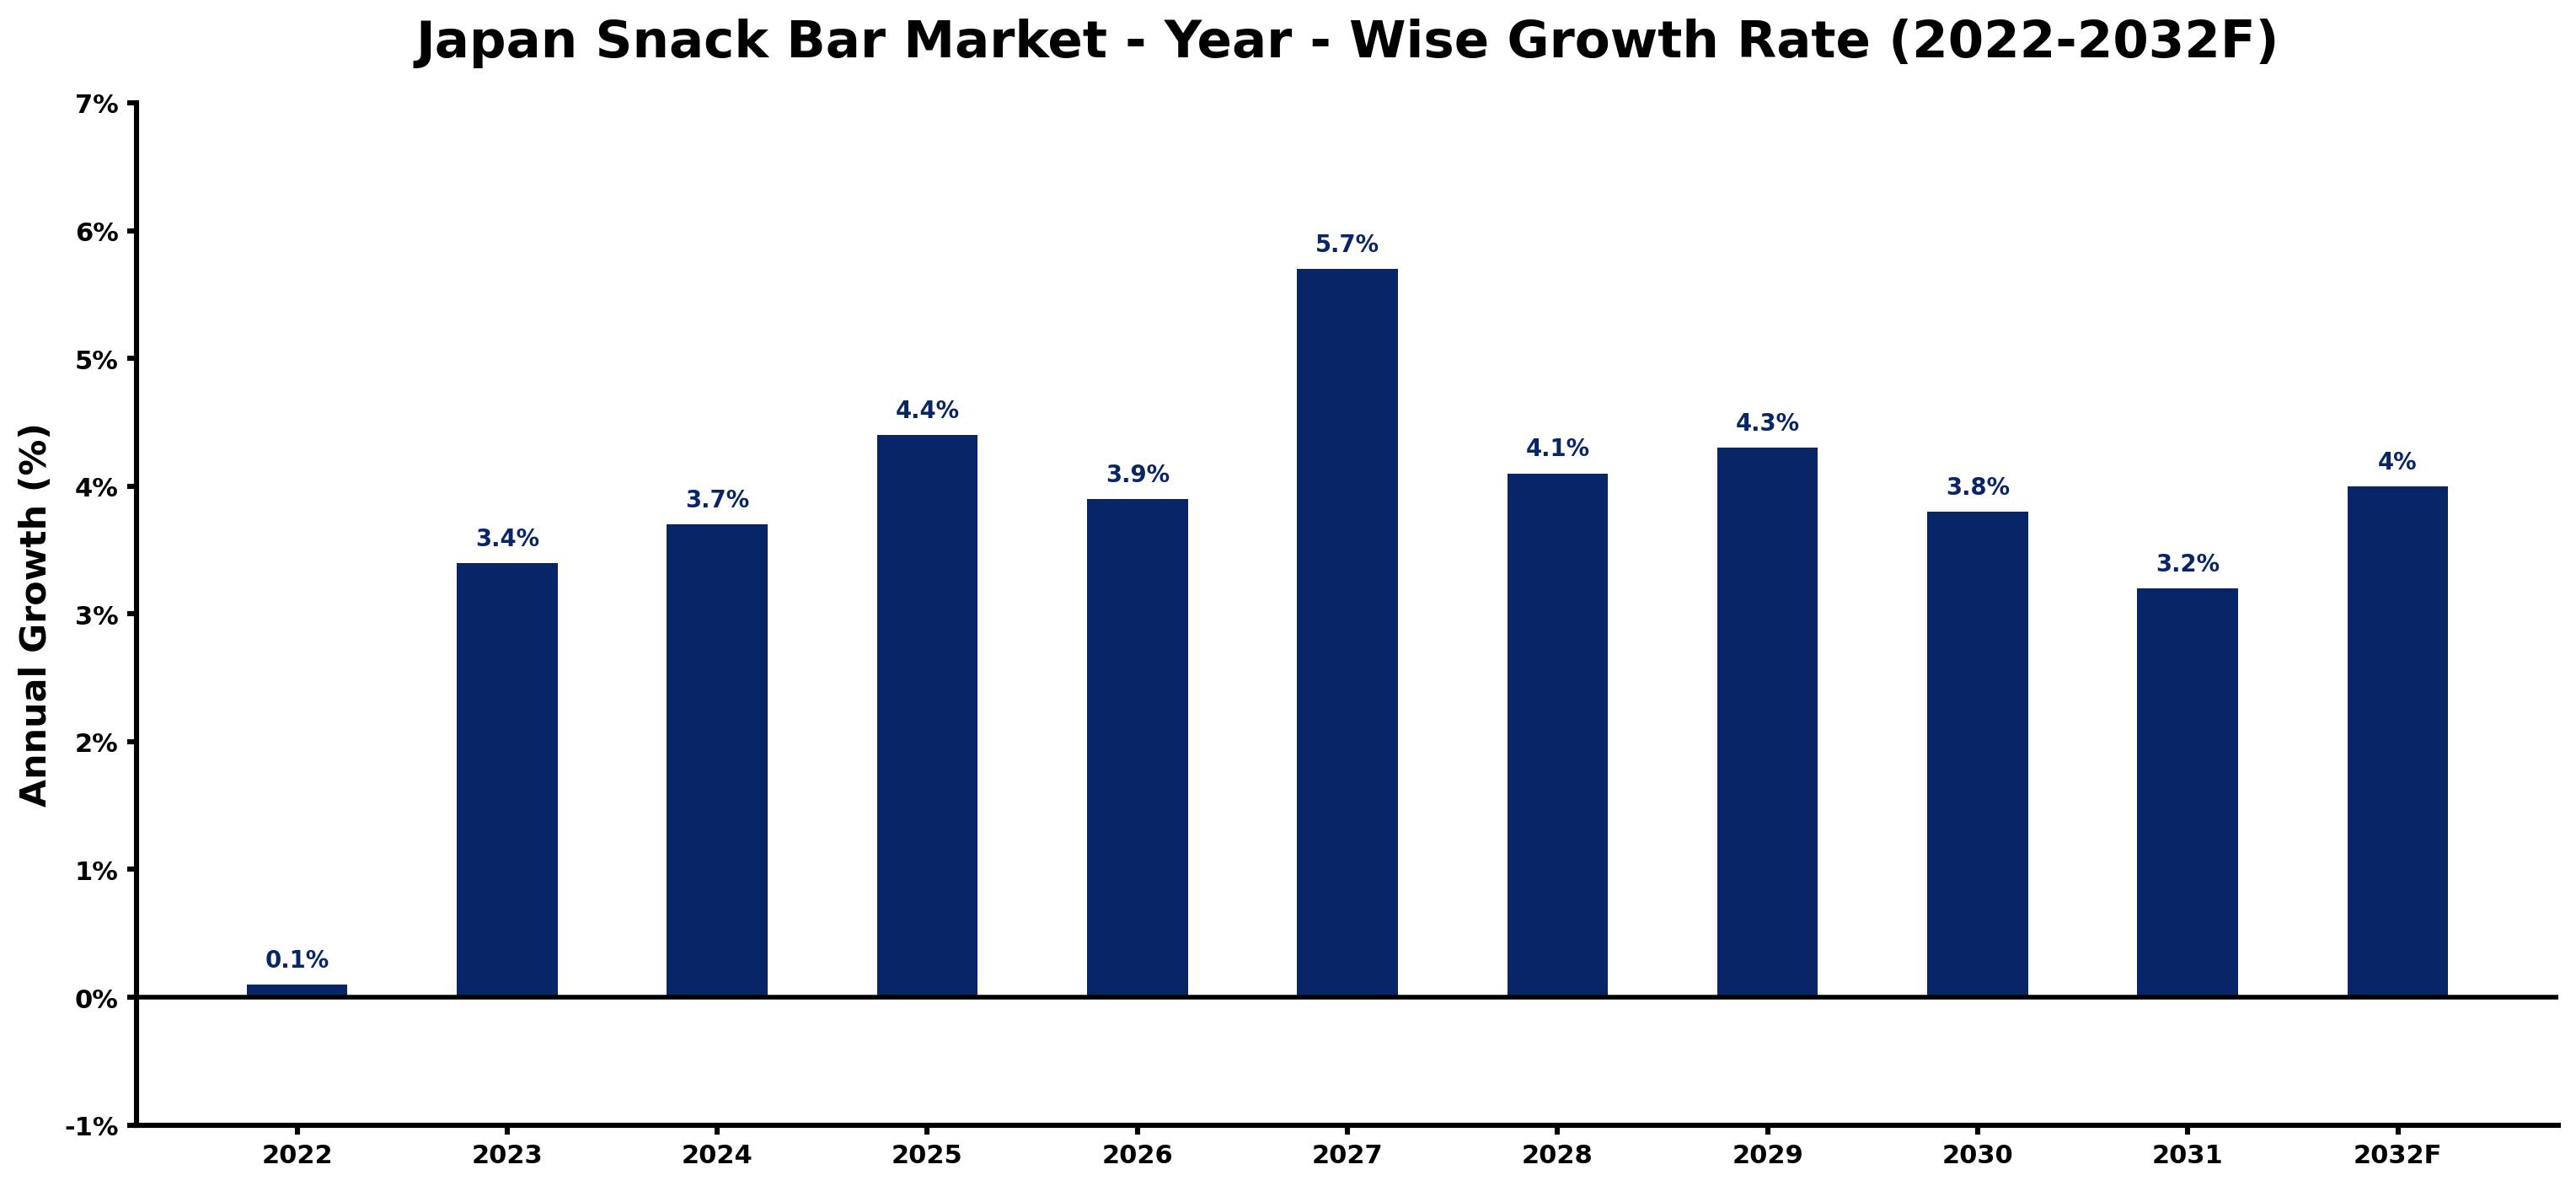
Each row of the following table gives one year's estimated growth and the event or demand shift that explains it.
| Year | Estimated Annual Growth (%) | Market Rationale |
| 2022 | 0.1 | The market showed minimal activity with a slight growth rate. |
| 2023 | 3.4 | Consumer interest in healthy snacks contributed to a faster growth rate. |
| 2024 | 3.7 | Increased awareness of nutrition led to higher sales of snack bars. |
| 2025 | 4.4 | The introduction of new product variants boosted market performance. |
| 2026 | 3.9 | Growth is expected to slow as competition intensifies among established brands. |
| 2027 | 5.7 | The peak growth year will see a surge in demand for protein bars. |
| 2028 | 4.1 | Market growth is projected to slow but remain strong due to ongoing health trends. |
| 2029 | 4.3 | Increased urbanisation in major cities will drive higher snack bar consumption. |
| 2030 | 3.8 | Growth is expected to slow as market saturation begins to affect sales dynamics. |
| 2031 | 3.2 | The introduction of innovative flavours will help maintain consumer interest. |
| 2032 | 4.0 | Health campaigns are projected to drive renewed interest in snack bars. |
Note: Market size estimations and growth projections presented in this report are based on 6Wresearch's proprietary forecasting methodology, utilizing the latest available industry data, government publications, and primary research inputs.
Japan Snack Bar Market Synopsis
Snack bars are processed food products made from grains, nuts, and sweeteners, produced through extrusion or baking. The Japan Snack Bar Market is valued at approximately 200 billion yen, with demand driven by urban consumers seeking convenient snacking options. The popularity of health-conscious eating and the growth of convenience stores, which account for 60% of sales, are propelling market expansion. On average, consumers purchase snack bars three times a month, reflecting a shift towards healthier snack choices.
Market Dynamics Impact Analysis (2026–2032)
| Factor | Type | Impact | Primary Segment Affected |
| Growing health consciousness among consumers | Driver | High | Cereal Bar |
| Expansion of convenience store networks | Driver | High | Convenience Store |
| Increasing demand for healthy snacking options | Opportunity | High | Protein Bar |
| Rising online sales of snack bars | Opportunity | Medium | Online Retail Store |
| Intense competition among brands | Restraint | High | Fruit & Nut Bar |
| Regulatory compliance costs for producers | Restraint | Medium | Cereal Bar |
| High production costs impacting pricing | Challenge | High | Protein Bar |
| Market saturation limiting new entrants | Challenge | Medium | Convenience Store |
Evaluation of Drivers in Japan Snack Bar Market (2026–2032)
Demand rests on the following drivers, each shown with the segment it touches most.
| Drivers | Primary Segment Affected | Why It Matters (Evidence) |
| Increased consumer focus on health and wellness | Protein Bar | This trend drives demand for high-protein snacks, with 40% of consumers choosing protein bars for their nutritional benefits. |
| Expansion of convenience stores in urban areas | Convenience Store | With 60% of snack bar sales occurring in these outlets, their growth directly boosts market accessibility. |
| Popularity of meal replacement options among busy professionals | Fruit & Nut Bar | These bars are marketed as energy sources, appealing to urban consumers who purchase snack bars three times monthly. |
| Innovations in flavours and ingredients | Cereal Bar | New product launches cater to changing tastes, with 15% growth in online sales reflecting this trend. |
| Government campaigns promoting healthy eating | Cereal Bar | The 2023 initiative encourages consumers to choose healthier snacks, increasing overall market demand. |
Several shifts outside the market lift sales. The growing focus on health and wellness has led to a 15% increase in online retail sales of snack bars in 2023, as busy professionals seek nutritious meal replacements. Urbanisation, particularly in Tokyo, where the population exceeds 14 million, drives demand for convenient snacking options. Campaigns promoting healthy eating have stimulated interest in snack bars, contributing to a vibrant market environment. The expansion of convenience stores, which account for 60% of sales, improves accessibility for consumers.
Evaluation of Restraints in Japan Snack Bar Market
The key brakes on demand, and where they bite hardest, are shown below.
| Market Restraint | Primary Segment Affected | Why It Matters (Evidence) |
| High production costs due to ingredient sourcing | Protein Bar | Producers face increased costs from sourcing high-quality ingredients, impacting pricing strategies and margins. |
| Intense competition leading to price wars | Fruit & Nut Bar | Aggressive pricing strategies among brands affect profitability and market stability. |
| Regulatory compliance costs for food safety standards | Cereal Bar | Compliance with JIS standards increases operational costs for producers, affecting their pricing strategies. |
| Limited shelf space in retail outlets | Convenience Store | With many brands competing, shelf space constraints hinder visibility and sales potential for new entrants. |
| Market saturation affecting growth potential | Cereal Bar | As the market matures, the influx of similar products limits opportunities for growth. |
Japan Snack Bar Market Challenges
Japan's snack bar market is valued at approximately 200 billion yen, yet buyers face high prices due to limited local production. This situation arises from reliance on imported ingredients, which can increase costs by 15% during global supply chain disruptions. Intense competition among brands leads to aggressive pricing strategies, eroding margins for distributors and resulting in lower profitability. Compliance with JIS standards requires rigorous testing, delaying product launches and raising costs for producers by up to 10%. A shortage of skilled food technologists restricts innovation, limiting manufacturers' ability to meet consumer demands for new flavours and healthier options.
Trends in the Japan Snack Bar Market
The trends below show where the Japan Snack Bar Market is heading.
- Shift towards Healthier Snack Options: Since 2023, consumers have increasingly preferred snack bars with natural ingredients, leading to a 40% share for cereal bars in total sales.
- Rise in Online Retail Sales: As of 2023, online retail sales of snack bars grew by 15%, reflecting a shift in consumer purchasing habits towards digital platforms.
- Increased Focus on Meal Replacement Products: The trend for meal replacement bars has gained traction, particularly among busy professionals, driving demand for protein bars.
- Growth of Convenience Store Channels: With convenience stores accounting for 60% of snack bar sales, their expansion in urban areas is reshaping distribution.
Investment Opportunities in the Japan Snack Bar Market
The following opportunities in the Japan Snack Bar Market pair current demand with a clear way in.
- Gap in Healthy Snack Offerings: With 200 billion yen in market value, there is an opportunity for new healthy snack bars targeting urban professionals in Tokyo.
- Demand for Unique Flavours: The popularity of unique flavours presents an opportunity for manufacturers to cater to adventurous consumers in metropolitan areas.
- Expansion of Online Sales Channels: With online sales growing by 15%, there is a chance to invest in e-commerce platforms targeting health-conscious consumers.
- Focus on Meal Replacement Bars: The increasing trend for meal replacements creates an opportunity for suppliers to develop protein-rich snack bars for busy individuals.
Government Initiatives in the Japan Snack Bar Market
The Act against Unjustifiable Premiums and Misleading Representations, established in 1962, ensures that buyers receive accurate information about snack bars, preventing misleading claims that could affect purchasing decisions. Compliance with this law requires producers to adhere to strict labelling standards, fostering consumer trust and promoting healthy choices. The Digital Agency, created in 2021, supports the digitisation of food safety processes, enhancing transparency and efficiency in the snack bar market.
The Japan Confectionery Association utilises the GX Basic Policy, adopted in 2023, to promote healthy eating initiatives among consumers. This policy aims to encourage the production of nutritious snack bars, directly impacting buyers by increasing the availability of healthier options. The Ministry of Health, Labour and Welfare oversees the implementation of food safety regulations, ensuring that snack bars meet JIS standards, which helps maintain high-quality products for consumers.
Future Insight of the Japan Snack Bar Market
The rollout of new production facilities will transform snack bar manufacturing by 2032, enabling suppliers to create a wider variety of products. Health-focused initiatives will drive the development of nutritious options, catering to the growing consumer preference for healthier snacks. Urban areas will see an increase in dedicated snack bar sections within convenience stores, reflecting the rising demand for on-the-go choices. Online retail sales are projected to grow by 15%, expanding access for suppliers to health-conscious consumers seeking convenient snacking solutions.
Market Segmentation Analysis
Japan Snack Bar Market report covers a detailed analysis of the following market segments:
By Confectionery Variant – Cereal Bar Leads, Protein Bar Expected to Grow Fastest
According to Summon Dutta, Assistant Manager at 6Wresearch, Cereal Bar accounted for 47% of the market by confectionery variant in 2025. Cereal bars dominate the market due to their popularity among consumers looking for healthy snack alternatives. Their widespread acceptance is evident as the average Japanese consumer purchases these bars three times a month, showcasing consistent demand. Protein Bar is projected to grow fastest, at a CAGR of 5.2% during 2026–2032. Protein bars are rapidly gaining traction as fitness enthusiasts seek high-protein snacks to support their active lifestyles. This growth is further propelled by government campaigns that promote healthy eating, which include protein-rich snack options. Suppliers should focus on expanding their product lines to include more protein bars to meet the rising demand from health-conscious consumers.
By Distribution Channel – Convenience Store Leads, Online Retail Store Expected to Grow Fastest
The largest distribution channel category in 2025 was Convenience Store, at 48% of revenue. Convenience stores are the leading retail channel, representing 60% of snack bar sales in urban regions. Their prime locations cater to consumers who prefer quick and easy access to snack options, especially in densely populated areas like Tokyo. Over 2026–2032, Online Retail Store is expected to post the fastest growth, at a CAGR of 5.1%. Online retail stores are showing impressive growth, with a 15% rise in sales recorded in 2023. This increase reflects a growing consumer inclination towards purchasing specialty and health-oriented products through digital platforms. Retailers must enhance their online presence and strategies to capitalise on the increasing trend of consumers buying snack bars online.
Key Attractiveness of the Report
- 10 Years of Market Numbers
- Historical Data Starting from 2022 to 2025
- Base Year 2025
- Forecast Data until 2032
- Key Performance Indicators Impacting the Market
- Major Upcoming Developments and Projects
Key Highlights of the Report:
- Japan Snack Bar Market Outlook
- Market Size of Japan Snack Bar Market, 2025
- Forecast of Japan Snack Bar Market, 2032
- Historical Data and Forecast of Japan Snack Bar Revenues & Volume for the Period 2022-2032
- Japan Snack Bar Market Trend Evolution
- Japan Snack Bar Market Drivers and Challenges
- Japan Snack Bar Price Trends
- Japan Snack Bar Porter's Five Forces
- Japan Snack Bar Industry Life Cycle
- Historical Data and Forecast of Japan Snack Bar Market Revenues & Volume By Confectionery Variant for the Period 2022-2032
- Historical Data and Forecast of Japan Snack Bar Market Revenues & Volume By Cereal Bar for the Period 2022-2032
- Historical Data and Forecast of Japan Snack Bar Market Revenues & Volume By Fruit & Nut Bar for the Period 2022-2032
- Historical Data and Forecast of Japan Snack Bar Market Revenues & Volume By Protein Bar for the Period 2022-2032
- Historical Data and Forecast of Japan Snack Bar Market Revenues & Volume By Distribution Channel for the Period 2022-2032
- Historical Data and Forecast of Japan Snack Bar Market Revenues & Volume By Convenience Store for the Period 2022-2032
- Historical Data and Forecast of Japan Snack Bar Market Revenues & Volume By Online Retail Store for the Period 2022-2032
- Historical Data and Forecast of Japan Snack Bar Market Revenues & Volume By Supermarket/Hypermarket for the Period 2022-2032
- Historical Data and Forecast of Japan Snack Bar Market Revenues & Volume By Others for the Period 2022-2032
- Japan Snack Bar Import Export Trade Statistics
- Market Opportunity Assessment By Confectionery Variant
- Market Opportunity Assessment By Distribution Channel
- Japan Snack Bar Top Companies Market Share
- Japan Snack Bar Competitive Benchmarking By Technical and Operational Parameters
- Japan Snack Bar Company Profiles
- Japan Snack Bar Key Strategic Recommendations
Market Covered
The report covers the following segments.
By Confectionery Variant
- Cereal Bar
- Fruit & Nut Bar
- Protein Bar
By Distribution Channel
- Convenience Store
- Online Retail Store
- Supermarket/Hypermarket
- Others































