Kazakhstan Inventory Tags Market (2026-2032) Outlook | Forecast, Revenue, Trends, Companies, Value, Share, Size, Industry, Analysis & Growth
Market Forecast By Technology (Barcodes, RFID), By Label Type (Plastic, Paper, Metal), By Printing technology (Digital Printing, Flexography, Lithography, Screen Printing, Gravure, Others) And Competitive Landscape
| Product Code: ETC4601339 | Publication Date: Jul 2023 | Updated Date: Mar 2026 | Product Type: Report | |
| Publisher: 6Wresearch | Author: Summon Dutta | No. of Pages: 85 | No. of Figures: 45 | No. of Tables: 25 |
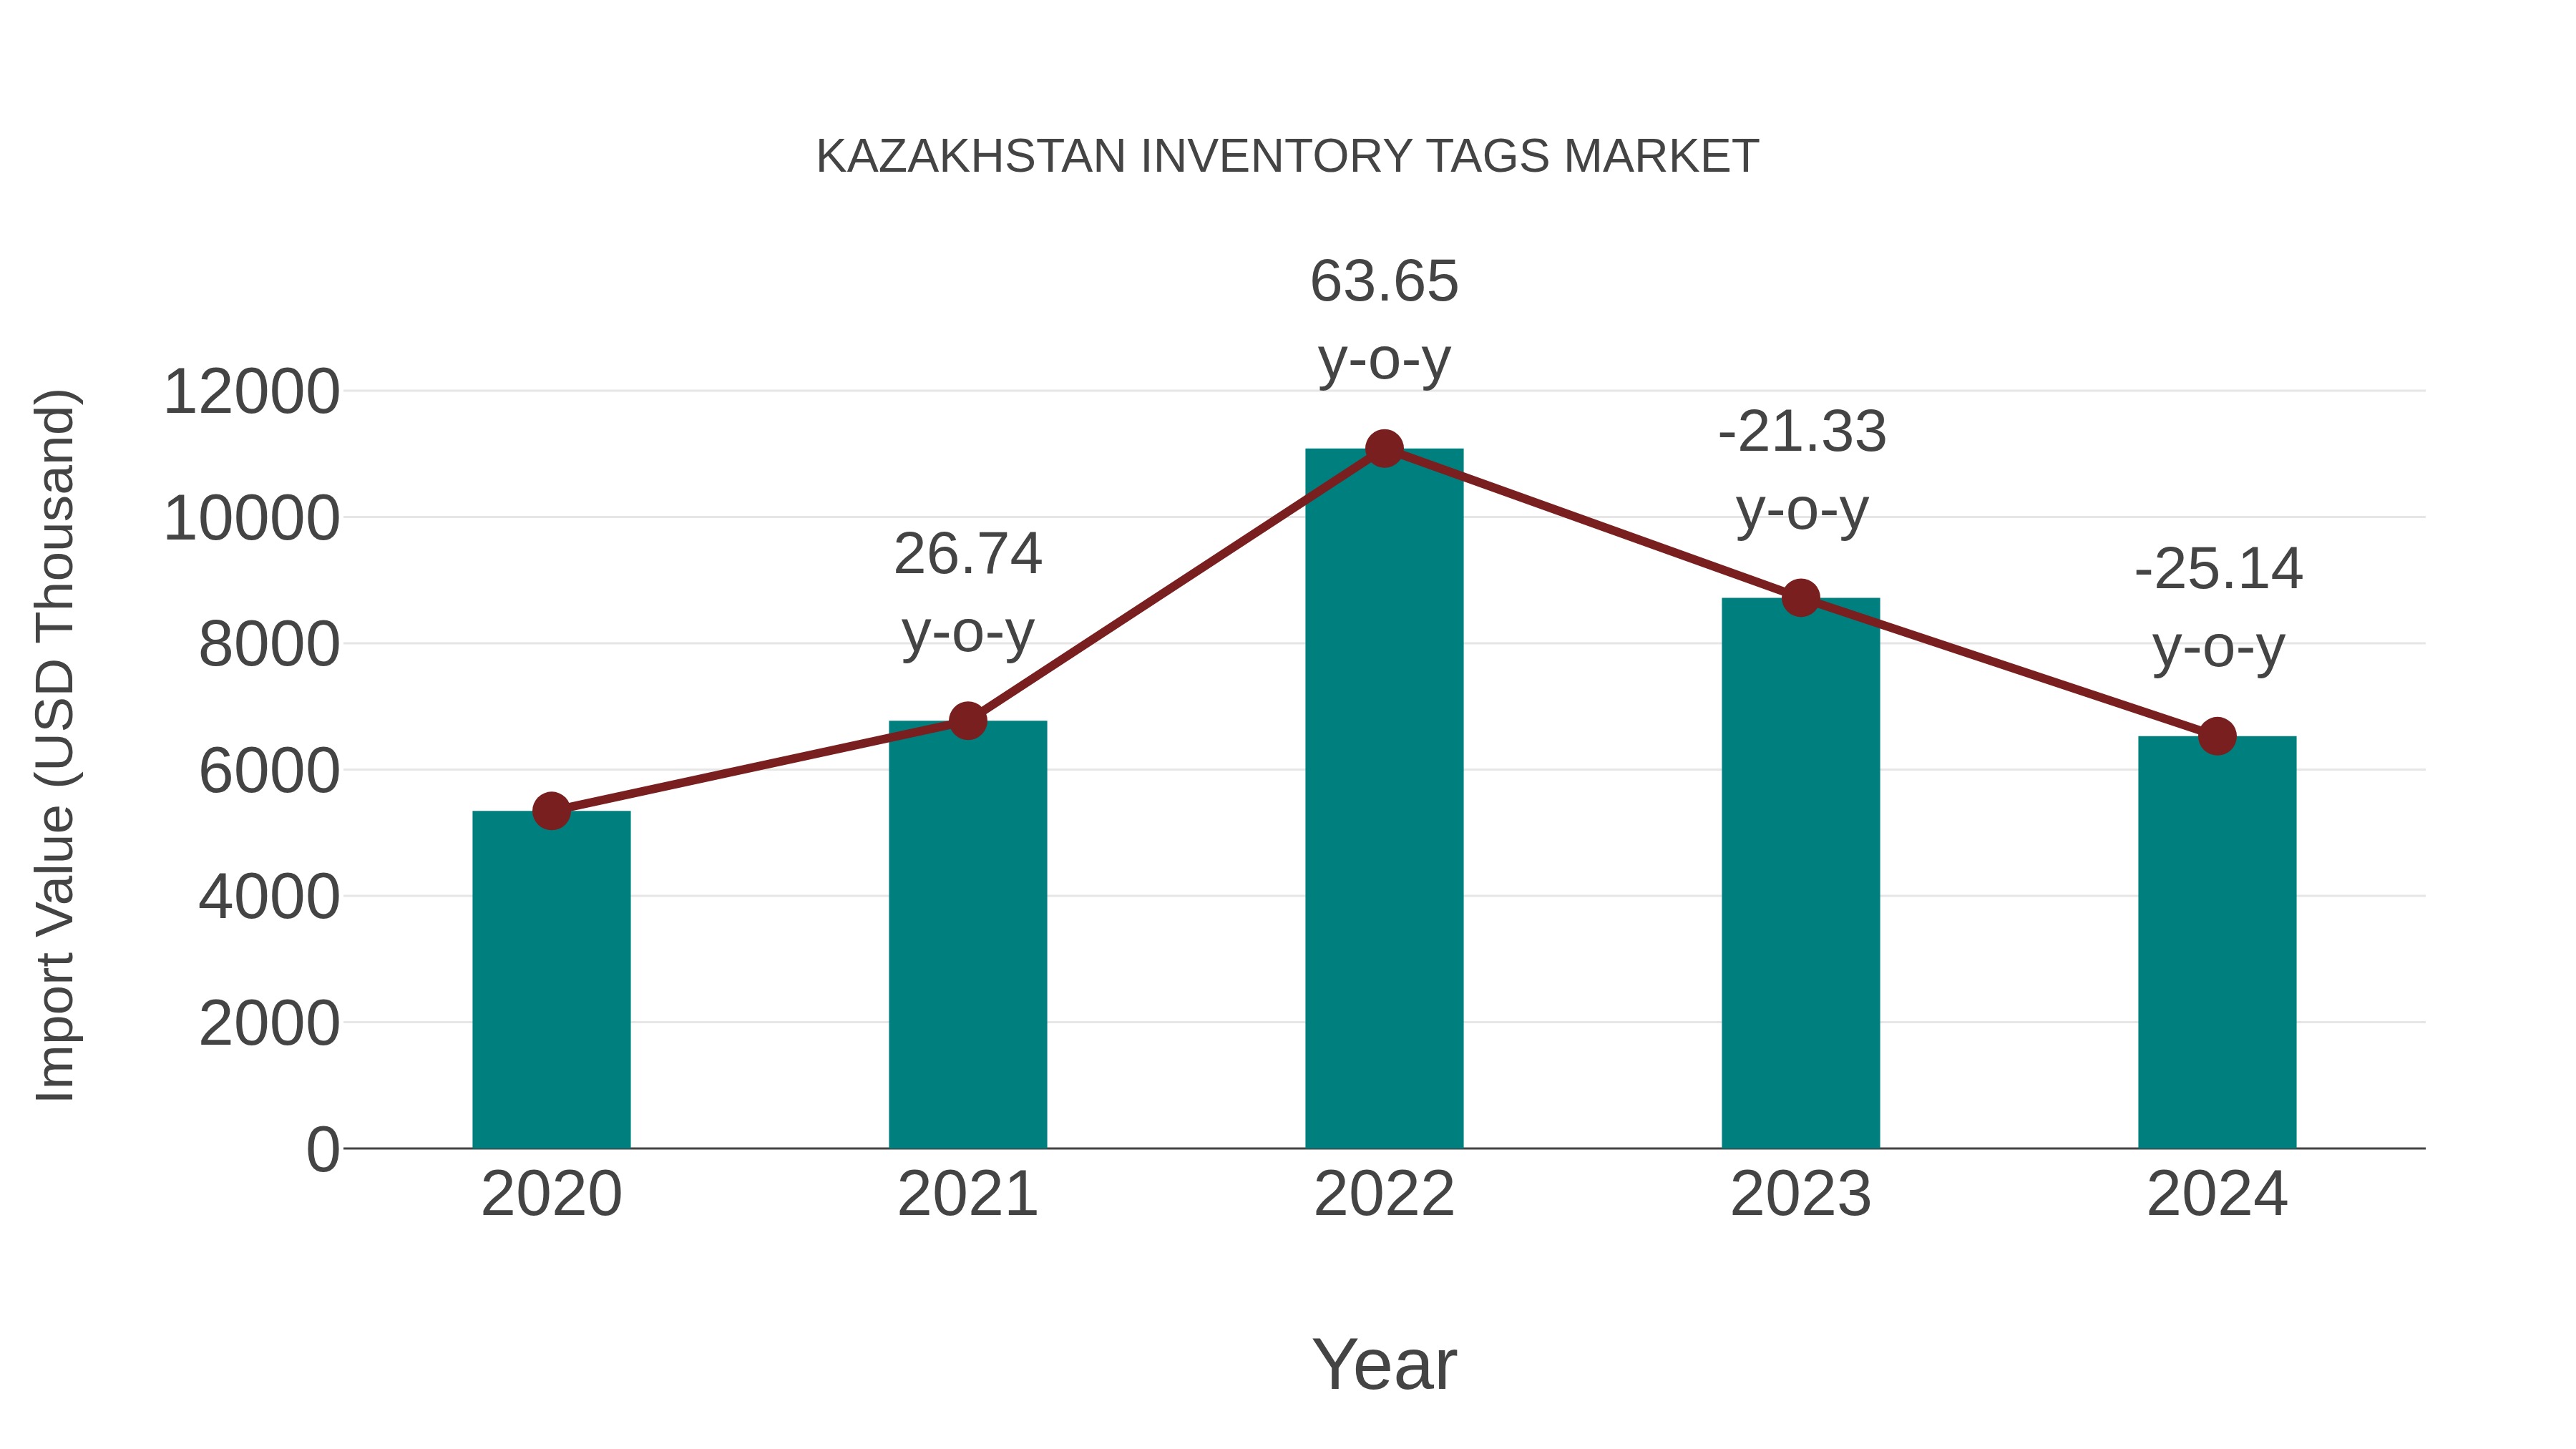
Kazakhstan Inventory Tags Market: Import Trend Analysis
In the Kazakhstan inventory tags market, the import trend experienced a notable decline from 2023 to 2024, with a growth rate of -25.14%. However, the compound annual growth rate (CAGR) for the period 2020-2024 stood at 5.13%. This significant drop in import momentum could be attributed to shifting demand patterns or changes in trade policies impacting market stability.
Kazakhstan Inventory Tags Market Overview
The inventory tags market in Kazakhstan is witnessing steady growth fueled by the expansion of industries such as retail, manufacturing, and logistics. Inventory tags play a crucial role in asset tracking, inventory management, and supply chain optimization. With the adoption of RFID and NFC technologies, businesses can improve operational efficiency, reduce losses, and enhance customer satisfaction. Key players in the market offer customizable solutions tailored to specific industry requirements, driving widespread adoption across various sectors.
Drivers of the market
The need for efficient inventory management solutions in retail, manufacturing, and logistics sectors is driving the Inventory Tags market. Technological advancements in tagging systems, such as RFID and barcode tags, support market growth.
Challenges of the market
Challenges in the inventory tags market in Kazakhstan include ensuring compatibility with diverse inventory management systems and addressing concerns regarding data accuracy and security. Deploying RFID and other tagging technologies requires robust infrastructure and adherence to standards to facilitate seamless integration and interoperability.
Government Policy of the market
In the realm of inventory tags, Kazakhstan is witnessing increased adoption across retail, logistics, and manufacturing sectors. Government mandates for accurate inventory management and supply chain optimization have propelled the demand for inventory tags. These tags enable real-time tracking and monitoring of assets, leading to improved operational efficiency and cost savings for businesses.
Key Highlights of the Report:
- Kazakhstan Inventory Tags Market Outlook
- Market Size of Kazakhstan Inventory Tags Market, 2025
- Forecast of Kazakhstan Inventory Tags Market, 2032
- Historical Data and Forecast of Kazakhstan Inventory Tags Revenues & Volume for the Period 2022-2032F
- Kazakhstan Inventory Tags Market Trend Evolution
- Kazakhstan Inventory Tags Market Drivers and Challenges
- Kazakhstan Inventory Tags Price Trends
- Kazakhstan Inventory Tags Porter's Five Forces
- Kazakhstan Inventory Tags Industry Life Cycle
- Historical Data and Forecast of Kazakhstan Inventory Tags Market Revenues & Volume By Technology for the Period 2022-2032F
- Historical Data and Forecast of Kazakhstan Inventory Tags Market Revenues & Volume By Barcodes for the Period 2022-2032F
- Historical Data and Forecast of Kazakhstan Inventory Tags Market Revenues & Volume By RFID for the Period 2022-2032F
- Historical Data and Forecast of Kazakhstan Inventory Tags Market Revenues & Volume By Label Type for the Period 2022-2032F
- Historical Data and Forecast of Kazakhstan Inventory Tags Market Revenues & Volume By Plastic for the Period 2022-2032F
- Historical Data and Forecast of Kazakhstan Inventory Tags Market Revenues & Volume By Paper for the Period 2022-2032F
- Historical Data and Forecast of Kazakhstan Inventory Tags Market Revenues & Volume By Metal for the Period 2022-2032F
- Historical Data and Forecast of Kazakhstan Inventory Tags Market Revenues & Volume By Printing technology for the Period 2022-2032F
- Historical Data and Forecast of Kazakhstan Inventory Tags Market Revenues & Volume By Digital Printing for the Period 2022-2032F
- Historical Data and Forecast of Kazakhstan Inventory Tags Market Revenues & Volume By Flexography for the Period 2022-2032F
- Historical Data and Forecast of Kazakhstan Inventory Tags Market Revenues & Volume By Lithography for the Period 2022-2032F
- Historical Data and Forecast of Kazakhstan Inventory Tags Market Revenues & Volume By Screen Printing for the Period 2022-2032F
- Historical Data and Forecast of Kazakhstan Inventory Tags Market Revenues & Volume By Gravure for the Period 2022-2032F
- Historical Data and Forecast of Kazakhstan Inventory Tags Market Revenues & Volume By Others for the Period 2022-2032F
- Kazakhstan Inventory Tags Import Export Trade Statistics
- Market Opportunity Assessment By Technology
- Market Opportunity Assessment By Label Type
- Market Opportunity Assessment By Printing technology
- Kazakhstan Inventory Tags Top Companies Market Share
- Kazakhstan Inventory Tags Competitive Benchmarking By Technical and Operational Parameters
- Kazakhstan Inventory Tags Company Profiles
- Kazakhstan Inventory Tags Key Strategic Recommendations
Kazakhstan Inventory Tags Market (2026-2032): FAQs
The future direction of the Kazakhstan inventory tags market is being influenced by the increasing adoption of RFID technology by companies like KazTransOil and Kazakhstan Temir Zholy to enhance inventory management efficiency and streamline operations.
The Kazakhstan inventory tags market is expected to witness steady growth in the coming years, driven by factors such as increasing adoption of RFID technology by companies like Kazatomprom and Kazakhtelecom to enhance supply chain management efficiency and streamline inventory tracking processes.
In Kazakhstan, customers show a preference for RFID inventory tags due to their efficiency and accuracy in tracking inventory levels. Companies like Astana Logistics have successfully implemented RFID technology to streamline their inventory management processes, reflecting a growing trend towards adopting advanced tracking solutions in the market.
Key competitors in the Kazakhstan inventory tags market include companies like Zebra Technologies, Honeywell, and Avery Dennison. Zebra Technologies focuses on providing innovative RFID solutions for inventory management, Honeywell offers a wide range of barcode and RFID tags for various industries, while Avery Dennison emphasizes on sustainable and high-quality label solutions for inventory tracking.
Several factors influence the Kazakhstan inventory tags market, including the rising adoption of RFID technology by companies like Kazatomprom for efficient tracking of assets and inventory, the increasing focus on enhancing supply chain visibility amid the growth of e-commerce in the country, and the government's initiatives to promote digitalization and automation in various industries. However, challenges such as concerns over data security and privacy, the high initial investment required for implementing RFID solutions, and the need for training employees on new technologies are shaping the dynamics of this market.
6Wresearch actively monitors the Kazakhstan Inventory Tags Market and publishes its comprehensive annual report, highlighting emerging trends, growth drivers, revenue analysis, and forecast outlook. Our insights help businesses to make data-backed strategic decisions with ongoing market dynamics. Our analysts track relevent industries related to the Kazakhstan Inventory Tags Market, allowing our clients with actionable intelligence and reliable forecasts tailored to emerging regional needs.
Yes, we provide customisation as per your requirements. To learn more, feel free to contact us on sales@6wresearch.com
1 Executive Summary |
2 Introduction |
2.1 Key Highlights of the Report |
2.2 Report Description |
2.3 Market Scope & Segmentation |
2.4 Research Methodology |
2.5 Assumptions |
3 Kazakhstan Inventory Tags Market Overview |
3.1 Kazakhstan Country Macro Economic Indicators |
3.2 Kazakhstan Inventory Tags Market Revenues & Volume, 2022 & 2032F |
3.3 Kazakhstan Inventory Tags Market - Industry Life Cycle |
3.4 Kazakhstan Inventory Tags Market - Porter's Five Forces |
3.5 Kazakhstan Inventory Tags Market Revenues & Volume Share, By Technology, 2022 & 2032F |
3.6 Kazakhstan Inventory Tags Market Revenues & Volume Share, By Label Type, 2022 & 2032F |
3.7 Kazakhstan Inventory Tags Market Revenues & Volume Share, By Printing technology, 2022 & 2032F |
4 Kazakhstan Inventory Tags Market Dynamics |
4.1 Impact Analysis |
4.2 Market Drivers |
4.2.1 Increasing adoption of inventory management systems in Kazakhstan |
4.2.2 Growth in e-commerce and retail sectors driving demand for inventory tags |
4.2.3 Government initiatives promoting digitalization and automation in businesses |
4.3 Market Restraints |
4.3.1 High initial investment required for implementing inventory tagging systems |
4.3.2 Lack of awareness about the benefits of inventory management solutions |
4.3.3 Data security concerns related to digital inventory tagging systems |
5 Kazakhstan Inventory Tags Market Trends |
6 Kazakhstan Inventory Tags Market, By Types |
6.1 Kazakhstan Inventory Tags Market, By Technology |
6.1.1 Overview and Analysis |
6.1.2 Kazakhstan Inventory Tags Market Revenues & Volume, By Technology, 2022-2032F |
6.1.3 Kazakhstan Inventory Tags Market Revenues & Volume, By Barcodes, 2022-2032F |
6.1.4 Kazakhstan Inventory Tags Market Revenues & Volume, By RFID, 2022-2032F |
6.2 Kazakhstan Inventory Tags Market, By Label Type |
6.2.1 Overview and Analysis |
6.2.2 Kazakhstan Inventory Tags Market Revenues & Volume, By Plastic, 2022-2032F |
6.2.3 Kazakhstan Inventory Tags Market Revenues & Volume, By Paper, 2022-2032F |
6.2.4 Kazakhstan Inventory Tags Market Revenues & Volume, By Metal, 2022-2032F |
6.3 Kazakhstan Inventory Tags Market, By Printing technology |
6.3.1 Overview and Analysis |
6.3.2 Kazakhstan Inventory Tags Market Revenues & Volume, By Digital Printing, 2022-2032F |
6.3.3 Kazakhstan Inventory Tags Market Revenues & Volume, By Flexography, 2022-2032F |
6.3.4 Kazakhstan Inventory Tags Market Revenues & Volume, By Lithography, 2022-2032F |
6.3.5 Kazakhstan Inventory Tags Market Revenues & Volume, By Screen Printing, 2022-2032F |
6.3.6 Kazakhstan Inventory Tags Market Revenues & Volume, By Gravure, 2022-2032F |
6.3.7 Kazakhstan Inventory Tags Market Revenues & Volume, By Others, 2022-2032F |
7 Kazakhstan Inventory Tags Market Import-Export Trade Statistics |
7.1 Kazakhstan Inventory Tags Market Export to Major Countries |
7.2 Kazakhstan Inventory Tags Market Imports from Major Countries |
8 Kazakhstan Inventory Tags Market Key Performance Indicators |
8.1 Percentage increase in the number of businesses implementing inventory management systems |
8.2 Growth in the number of e-commerce businesses using inventory tags |
8.3 Adoption rate of RFID technology in inventory management systems |
9 Kazakhstan Inventory Tags Market - Opportunity Assessment |
9.1 Kazakhstan Inventory Tags Market Opportunity Assessment, By Technology, 2022 & 2032F |
9.2 Kazakhstan Inventory Tags Market Opportunity Assessment, By Label Type, 2022 & 2032F |
9.3 Kazakhstan Inventory Tags Market Opportunity Assessment, By Printing technology, 2022 & 2032F |
10 Kazakhstan Inventory Tags Market - Competitive Landscape |
10.1 Kazakhstan Inventory Tags Market Revenue Share, By Companies, 2025 |
10.2 Kazakhstan Inventory Tags Market Competitive Benchmarking, By Operating and Technical Parameters |
11 Company Profiles |
12 Recommendations |
13 Disclaimer |
Global Go To Market Strategy - 2030
Export potential enables firms to identify high-growth global markets with greater confidence by combining advanced trade intelligence with a structured quantitative methodology. The framework analyzes emerging demand trends and country-level import patterns while integrating macroeconomic and trade datasets such as GDP and population forecasts, bilateral import–export flows, tariff structures, elasticity differentials between developed and developing economies, geographic distance, and import demand projections. Using weighted trade values from 2020–2024 as the base period to project country-to-country export potential for 2030, these inputs are operationalized through calculated drivers such as gravity model parameters, tariff impact factors, and projected GDP per-capita growth. Through an analysis of hidden potentials, demand hotspots, and market conditions that are most favorable to success, this method enables firms to focus on target countries, maximize returns, and global expansion with data, backed by accuracy.
By factoring in the projected importer demand gap that is currently unmet and could be potential opportunity, it identifies the potential for the Exporter (Country) among 190 countries, against the general trade analysis, which identifies the biggest importer or exporter.
To discover high-growth global markets and optimize your business strategy:
Click Here
Pricing
- Single User License$ 1,995
- Department License$ 2,400
- Site License$ 3,120
- Global License$ 3,795

Leadership Perspectives from Industry Events
Search
Thought Leadership and Analyst Meet


Our Clients
6WResearch In News
- India Export Attractiveness Tracker 2026
- India Air Conditioner Market Set for Strong Rebound in 2026 After Weather-Led Correction and GST-Driven Recovery: 6Wresearch
- ADAS in India: How Automatic Emergency Braking, Blind Spot Detection & Driver Monitoring are Transforming Road Safety
- Doha a strategic location for EV manufacturing hub: IPA Qatar
- Demand for luxury TVs surging in the GCC, says Samsung
- Empowering Growth: The Thriving Journey of Bangladesh’s Cable Industry
Latest Reports
- Nicaragua RPG Gaming Market (2026-2032)
- New Zealand RPG Gaming Market (2026-2032)
- Netherlands RPG Gaming Market (2026-2032)
- Nauru RPG Gaming Market (2026-2032)
- Namibia RPG Gaming Market (2026-2032)
- Mozambique RPG Gaming Market (2026-2032)
- Montenegro RPG Gaming Market (2026-2032)
- Mongolia RPG Gaming Market (2026-2032)
- Monaco RPG Gaming Market (2026-2032)
- Micronesia RPG Gaming Market (2026-2032)
Industry Events and Analyst Meet

EV India Expo 2026

HIMTEX 2026

India Refining Summit 2026

India EV Show 2026

EV tech India Expo 2026
Whitepaper
- Middle East & Africa Commercial Security Market Click here to view more.
- Middle East & Africa Fire Safety Systems & Equipment Market Click here to view more.
- GCC Drone Market Click here to view more.
- Middle East Lighting Fixture Market Click here to view more.
- GCC Physical & Perimeter Security Market Click here to view more.