Kazakhstan Low Migration Inks Market (2026-2032) Outlook | Analysis, Forecast, Size, Share, Growth, Trends, Companies, Industry, Revenue & Value
Market Forecast By Process (Gravure, Flexography, Off-Set, Digital), By End Use Industry (Food & Beverages, Pharmaceutical, Cosmetics) And Competitive Landscape
| Product Code: ETC4479899 | Publication Date: Jul 2023 | Updated Date: Mar 2026 | Product Type: Report | |
| Publisher: 6Wresearch | Author: Dhaval Chaurasia | No. of Pages: 85 | No. of Figures: 45 | No. of Tables: 25 |
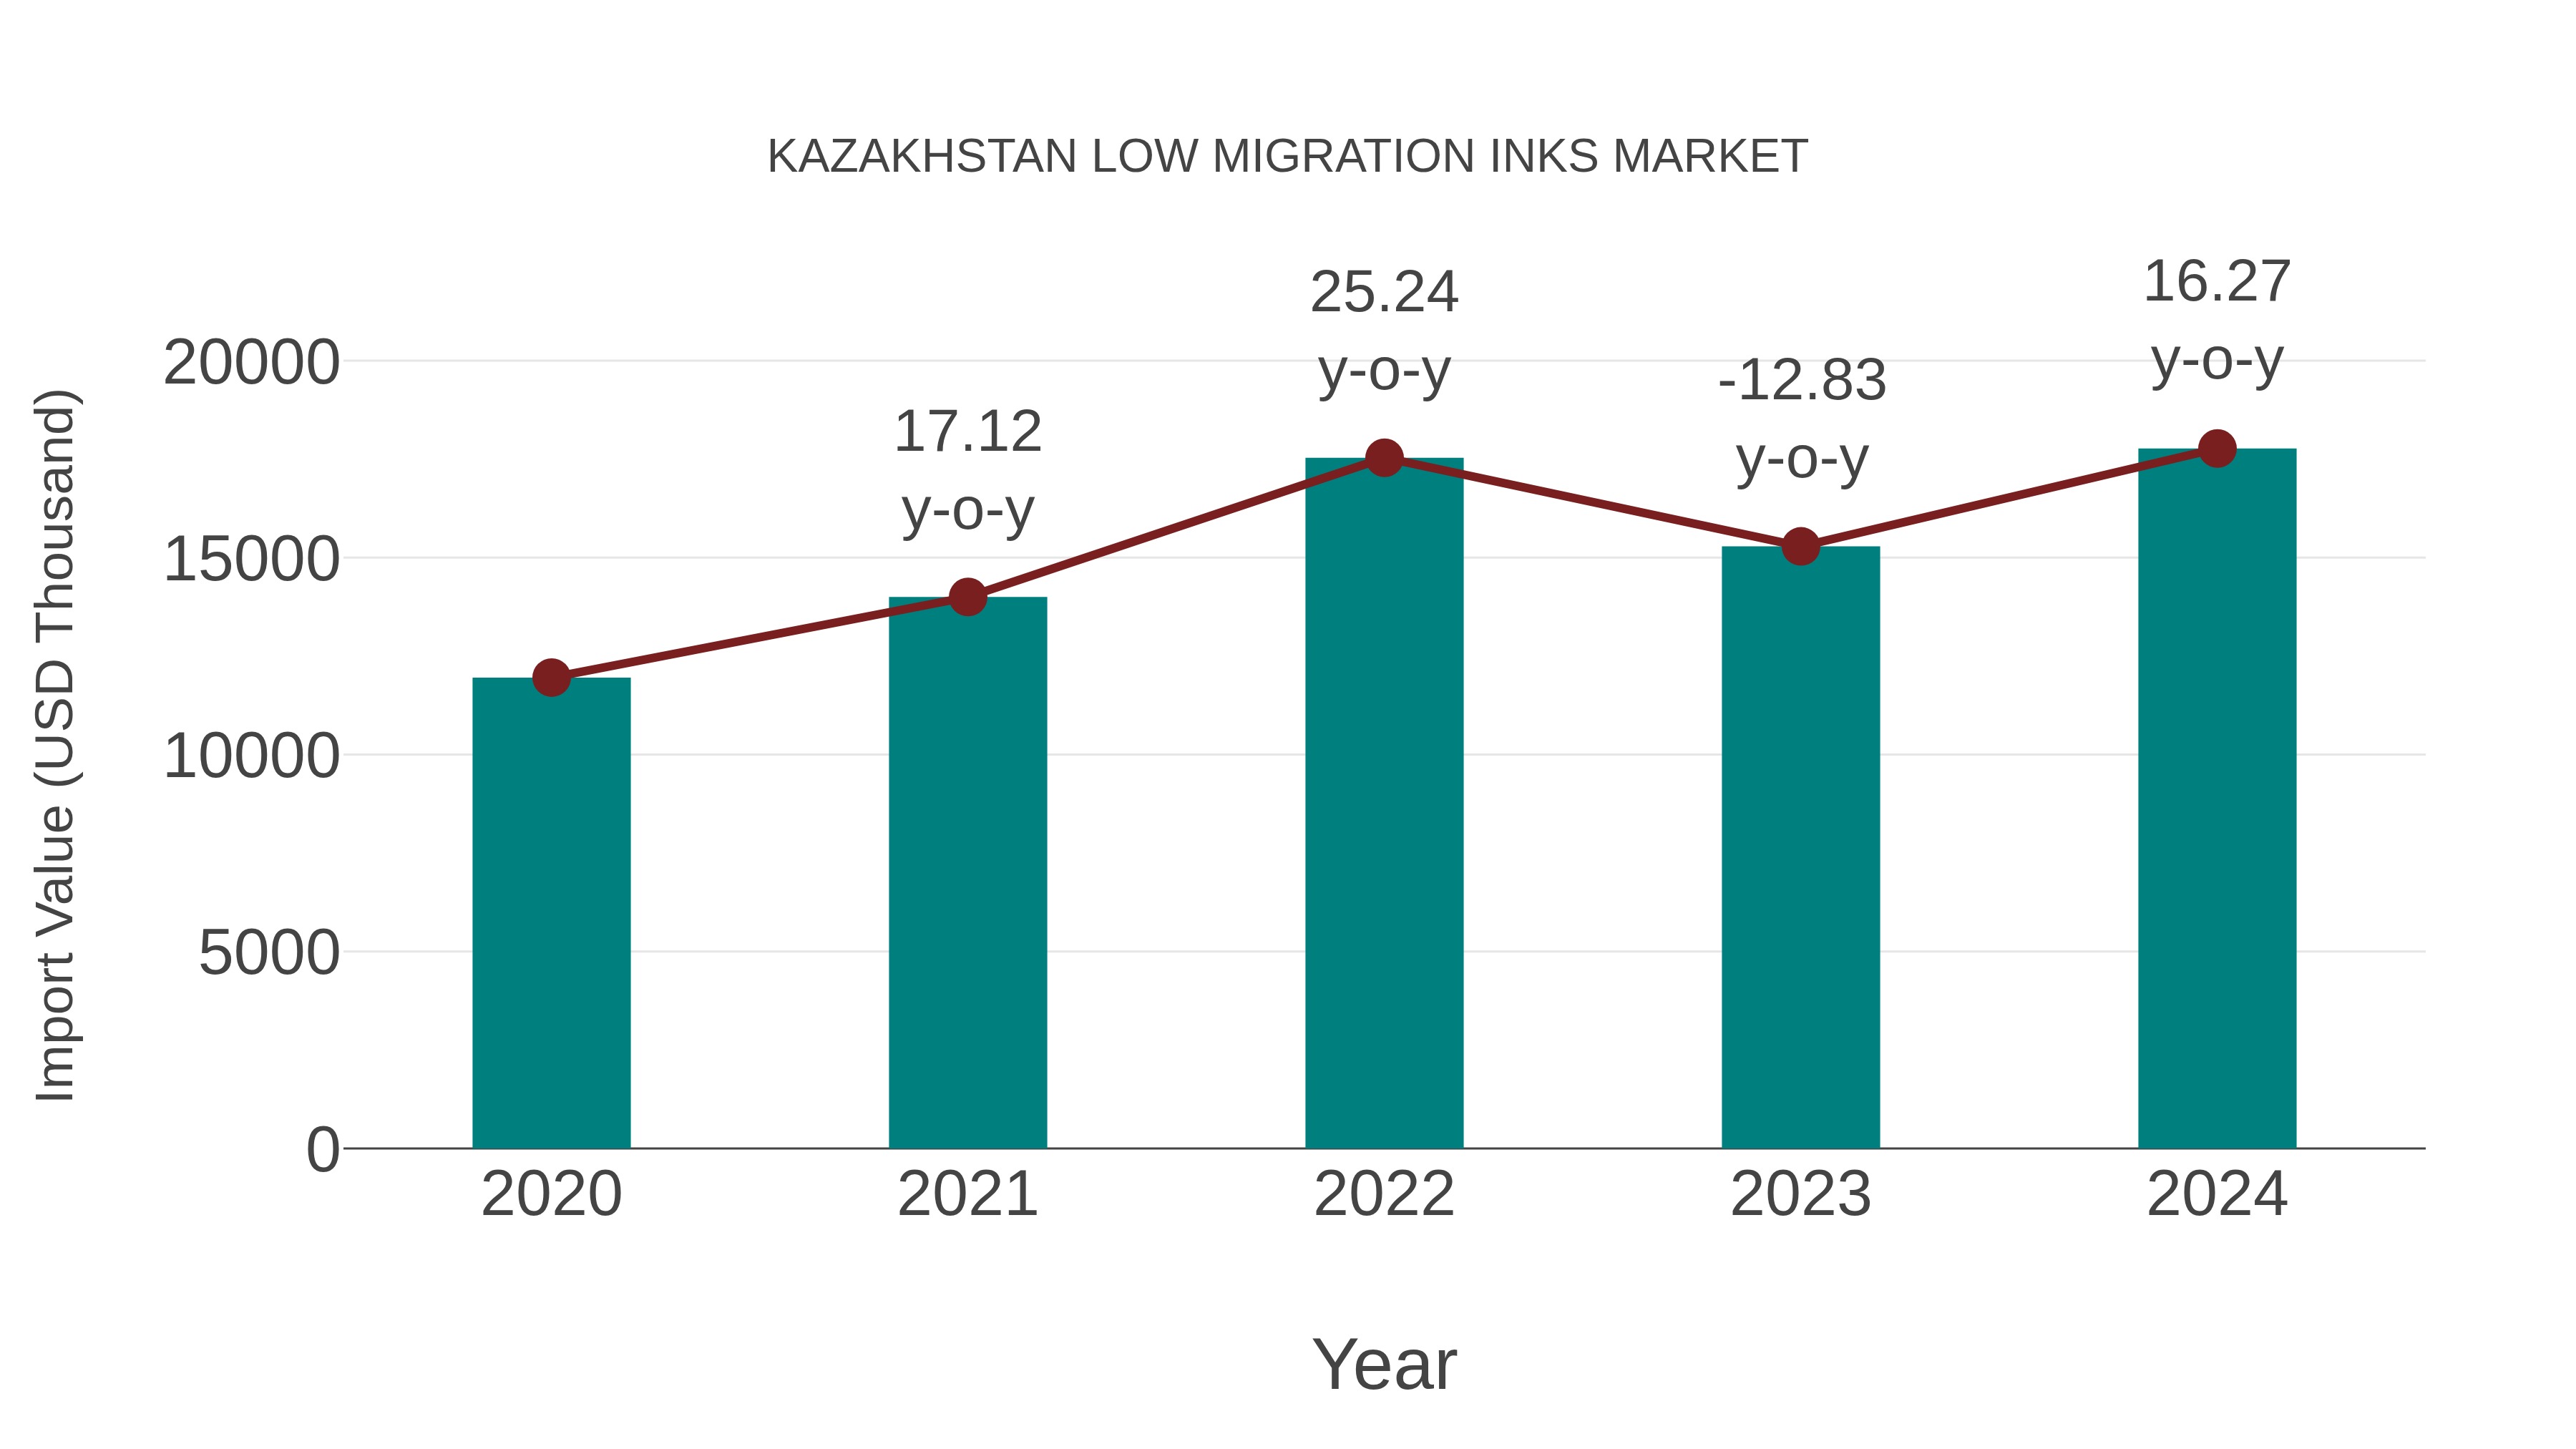
Kazakhstan Low Migration Inks Market: Import Trend Analysis
From 2023 to 2024, Kazakhstan`s import trend for low migration inks showed a notable growth rate of 16.27%, with a compound annual growth rate (CAGR) of 10.42% between 2020 and 2024. This surge in imports could be attributed to an increasing demand for high-quality inks in the packaging industry, potentially driven by advancements in printing technology and evolving consumer preferences.
Kazakhstan Low Migration Inks Market Overview
Driven by stringent regulations and quality requirements in packaging and printing industries, the low migration inks market in Kazakhstan is growing. With a focus on food safety and product integrity, there is an increasing adoption of inks that minimize the risk of migration into packaged products.
Drivers of the market
Regulatory compliance and consumer safety concerns are driving the demand for low migration inks in Kazakhstan. With stringent regulations governing food packaging and labeling, manufacturers are increasingly adopting low migration inks to ensure that printing materials do not transfer harmful substances to food products. Additionally, the expansion of the packaging industry and the demand for high-quality printing solutions further propel the market for low migration inks.
Challenges of the market
In the low migration inks market in Kazakhstan, ensuring compliance with regulatory standards and addressing food safety concerns are significant challenges. Low migration inks are used in packaging materials for food and pharmaceutical products to minimize the risk of ink components migrating into the packaged goods and causing contamination. However, stringent regulations and evolving industry standards require manufacturers to continually monitor and test ink formulations to ensure compliance, which can increase production costs and complexity.
Government Policy of the market
To ensure consumer safety and compliance with international standards, Kazakhstan has implemented stringent regulations governing the use of low migration inks in packaging and printing. The government provides support for businesses transitioning to safer ink formulations through subsidies and awareness campaigns.
Key Highlights of the Report:
- Kazakhstan Low Migration Inks Market Outlook
- Market Size of Kazakhstan Low Migration Inks Market, 2025
- Forecast of Kazakhstan Low Migration Inks Market, 2032
- Historical Data and Forecast of Kazakhstan Low Migration Inks Revenues & Volume for the Period 2022-2032F
- Kazakhstan Low Migration Inks Market Trend Evolution
- Kazakhstan Low Migration Inks Market Drivers and Challenges
- Kazakhstan Low Migration Inks Price Trends
- Kazakhstan Low Migration Inks Porter's Five Forces
- Kazakhstan Low Migration Inks Industry Life Cycle
- Historical Data and Forecast of Kazakhstan Low Migration Inks Market Revenues & Volume By Process for the Period 2022-2032F
- Historical Data and Forecast of Kazakhstan Low Migration Inks Market Revenues & Volume By Gravure for the Period 2022-2032F
- Historical Data and Forecast of Kazakhstan Low Migration Inks Market Revenues & Volume By Flexography for the Period 2022-2032F
- Historical Data and Forecast of Kazakhstan Low Migration Inks Market Revenues & Volume By Off-Set for the Period 2022-2032F
- Historical Data and Forecast of Kazakhstan Low Migration Inks Market Revenues & Volume By Digital for the Period 2022-2032F
- Historical Data and Forecast of Kazakhstan Low Migration Inks Market Revenues & Volume By End Use Industry for the Period 2022-2032F
- Historical Data and Forecast of Kazakhstan Low Migration Inks Market Revenues & Volume By Food & Beverages for the Period 2022-2032F
- Historical Data and Forecast of Kazakhstan Low Migration Inks Market Revenues & Volume By Pharmaceutical for the Period 2022-2032F
- Historical Data and Forecast of Kazakhstan Low Migration Inks Market Revenues & Volume By Cosmetics for the Period 2022-2032F
- Kazakhstan Low Migration Inks Import Export Trade Statistics
- Market Opportunity Assessment By Process
- Market Opportunity Assessment By End Use Industry
- Kazakhstan Low Migration Inks Top Companies Market Share
- Kazakhstan Low Migration Inks Competitive Benchmarking By Technical and Operational Parameters
- Kazakhstan Low Migration Inks Company Profiles
- Kazakhstan Low Migration Inks Key Strategic Recommendations
Kazakhstan Low Migration Inks Market (2026-2032): FAQs
6Wresearch actively monitors the Kazakhstan Low Migration Inks Market and publishes its comprehensive annual report, highlighting emerging trends, growth drivers, revenue analysis, and forecast outlook. Our insights help businesses to make data-backed strategic decisions with ongoing market dynamics. Our analysts track relevent industries related to the Kazakhstan Low Migration Inks Market, allowing our clients with actionable intelligence and reliable forecasts tailored to emerging regional needs.
Yes, we provide customisation as per your requirements. To learn more, feel free to contact us on sales@6wresearch.com
1 Executive Summary |
2 Introduction |
2.1 Key Highlights of the Report |
2.2 Report Description |
2.3 Market Scope & Segmentation |
2.4 Research Methodology |
2.5 Assumptions |
3 Kazakhstan Low Migration Inks Market Overview |
3.1 Kazakhstan Country Macro Economic Indicators |
3.2 Kazakhstan Low Migration Inks Market Revenues & Volume, 2022 & 2032F |
3.3 Kazakhstan Low Migration Inks Market - Industry Life Cycle |
3.4 Kazakhstan Low Migration Inks Market - Porter's Five Forces |
3.5 Kazakhstan Low Migration Inks Market Revenues & Volume Share, By Process, 2022 & 2032F |
3.6 Kazakhstan Low Migration Inks Market Revenues & Volume Share, By End Use Industry, 2022 & 2032F |
4 Kazakhstan Low Migration Inks Market Dynamics |
4.1 Impact Analysis |
4.2 Market Drivers |
4.2.1 Increasing demand for safe and food-grade packaging solutions |
4.2.2 Stringent regulations and guidelines promoting the use of low migration inks |
4.2.3 Growing awareness among consumers about health and safety concerns related to conventional inks |
4.3 Market Restraints |
4.3.1 High initial investment and operational costs associated with transitioning to low migration inks |
4.3.2 Limited availability and higher prices of raw materials for low migration ink production |
5 Kazakhstan Low Migration Inks Market Trends |
6 Kazakhstan Low Migration Inks Market, By Types |
6.1 Kazakhstan Low Migration Inks Market, By Process |
6.1.1 Overview and Analysis |
6.1.2 Kazakhstan Low Migration Inks Market Revenues & Volume, By Process, 2022-2032F |
6.1.3 Kazakhstan Low Migration Inks Market Revenues & Volume, By Gravure, 2022-2032F |
6.1.4 Kazakhstan Low Migration Inks Market Revenues & Volume, By Flexography, 2022-2032F |
6.1.5 Kazakhstan Low Migration Inks Market Revenues & Volume, By Off-Set, 2022-2032F |
6.1.6 Kazakhstan Low Migration Inks Market Revenues & Volume, By Digital, 2022-2032F |
6.2 Kazakhstan Low Migration Inks Market, By End Use Industry |
6.2.1 Overview and Analysis |
6.2.2 Kazakhstan Low Migration Inks Market Revenues & Volume, By Food & Beverages, 2022-2032F |
6.2.3 Kazakhstan Low Migration Inks Market Revenues & Volume, By Pharmaceutical, 2022-2032F |
6.2.4 Kazakhstan Low Migration Inks Market Revenues & Volume, By Cosmetics, 2022-2032F |
7 Kazakhstan Low Migration Inks Market Import-Export Trade Statistics |
7.1 Kazakhstan Low Migration Inks Market Export to Major Countries |
7.2 Kazakhstan Low Migration Inks Market Imports from Major Countries |
8 Kazakhstan Low Migration Inks Market Key Performance Indicators |
8.1 Migration testing compliance rate |
8.2 Number of new product launches featuring low migration inks |
8.3 Percentage of market share held by low migration inks vs. conventional inks |
8.4 Adoption rate of low migration inks among key industries |
8.5 Customer satisfaction levels related to the safety and quality of packaging using low migration inks |
9 Kazakhstan Low Migration Inks Market - Opportunity Assessment |
9.1 Kazakhstan Low Migration Inks Market Opportunity Assessment, By Process, 2022 & 2032F |
9.2 Kazakhstan Low Migration Inks Market Opportunity Assessment, By End Use Industry, 2022 & 2032F |
10 Kazakhstan Low Migration Inks Market - Competitive Landscape |
10.1 Kazakhstan Low Migration Inks Market Revenue Share, By Companies, 2025 |
10.2 Kazakhstan Low Migration Inks Market Competitive Benchmarking, By Operating and Technical Parameters |
11 Company Profiles |
12 Recommendations |
13 Disclaimer |
Export potential assessment - trade Analytics for 2030
Export potential enables firms to identify high-growth global markets with greater confidence by combining advanced trade intelligence with a structured quantitative methodology. The framework analyzes emerging demand trends and country-level import patterns while integrating macroeconomic and trade datasets such as GDP and population forecasts, bilateral import–export flows, tariff structures, elasticity differentials between developed and developing economies, geographic distance, and import demand projections. Using weighted trade values from 2020–2024 as the base period to project country-to-country export potential for 2030, these inputs are operationalized through calculated drivers such as gravity model parameters, tariff impact factors, and projected GDP per-capita growth. Through an analysis of hidden potentials, demand hotspots, and market conditions that are most favorable to success, this method enables firms to focus on target countries, maximize returns, and global expansion with data, backed by accuracy.
By factoring in the projected importer demand gap that is currently unmet and could be potential opportunity, it identifies the potential for the Exporter (Country) among 190 countries, against the general trade analysis, which identifies the biggest importer or exporter.
To discover high-growth global markets and optimize your business strategy:
Click Here
Pricing
- Single User License$ 1,995
- Department License$ 2,400
- Site License$ 3,120
- Global License$ 3,795

Thought Leadership
Search
Thought Leadership and Analyst Meet


Our Clients
Latest Reports
- New Zealand Aseptic Manufacturing Market (2026-2032)
- Netherlands Aseptic Manufacturing Market (2026-2032)
- Nauru Aseptic Manufacturing Market (2026-2032)
- Namibia Aseptic Manufacturing Market (2026-2032)
- Mozambique Aseptic Manufacturing Market (2026-2032)
- Montenegro Aseptic Manufacturing Market (2026-2032)
- Mongolia Aseptic Manufacturing Market (2026-2032)
- Monaco Aseptic Manufacturing Market (2026-2032)
- Micronesia Aseptic Manufacturing Market (2026-2032)
- Mauritius Aseptic Manufacturing Market (2026-2032)
Industry Events and Analyst Meet

HIMTEX 2026

India Refining Summit 2026

India EV Show 2026

EV tech India Expo 2026

Auto Tech Asia 2026
Whitepaper
- Middle East & Africa Commercial Security Market Click here to view more.
- Middle East & Africa Fire Safety Systems & Equipment Market Click here to view more.
- GCC Drone Market Click here to view more.
- Middle East Lighting Fixture Market Click here to view more.
- GCC Physical & Perimeter Security Market Click here to view more.
6WResearch In News
- Doha a strategic location for EV manufacturing hub: IPA Qatar
- Demand for luxury TVs surging in the GCC, says Samsung
- Empowering Growth: The Thriving Journey of Bangladesh’s Cable Industry
- Demand for luxury TVs surging in the GCC, says Samsung
- Video call with a traditional healer? Once unthinkable, it’s now common in South Africa
- Intelligent Buildings To Smooth GCC’s Path To Net Zero