Kazakhstan N-propanol Market Outlook | Industry, Revenue, Forecast, COVID-19 IMPACT, Analysis, Value, Share, Trends, Growth, Companies & Size
Market Forecast By Type (Ethylene Hydrogenation Method, Allyl Alcohol Hydrogenation Method, Other Compounds Byproduct Method), By Application (Coatings, Food Additive, Pharmaceutical, Cosmetics, Others) And Competitive Landscape
| Product Code: ETC335098 | Publication Date: Aug 2022 | Updated Date: Feb 2026 | Product Type: Market Research Report | |
| Publisher: 6Wresearch | Author: Shubham Padhi | No. of Pages: 75 | No. of Figures: 35 | No. of Tables: 20 |
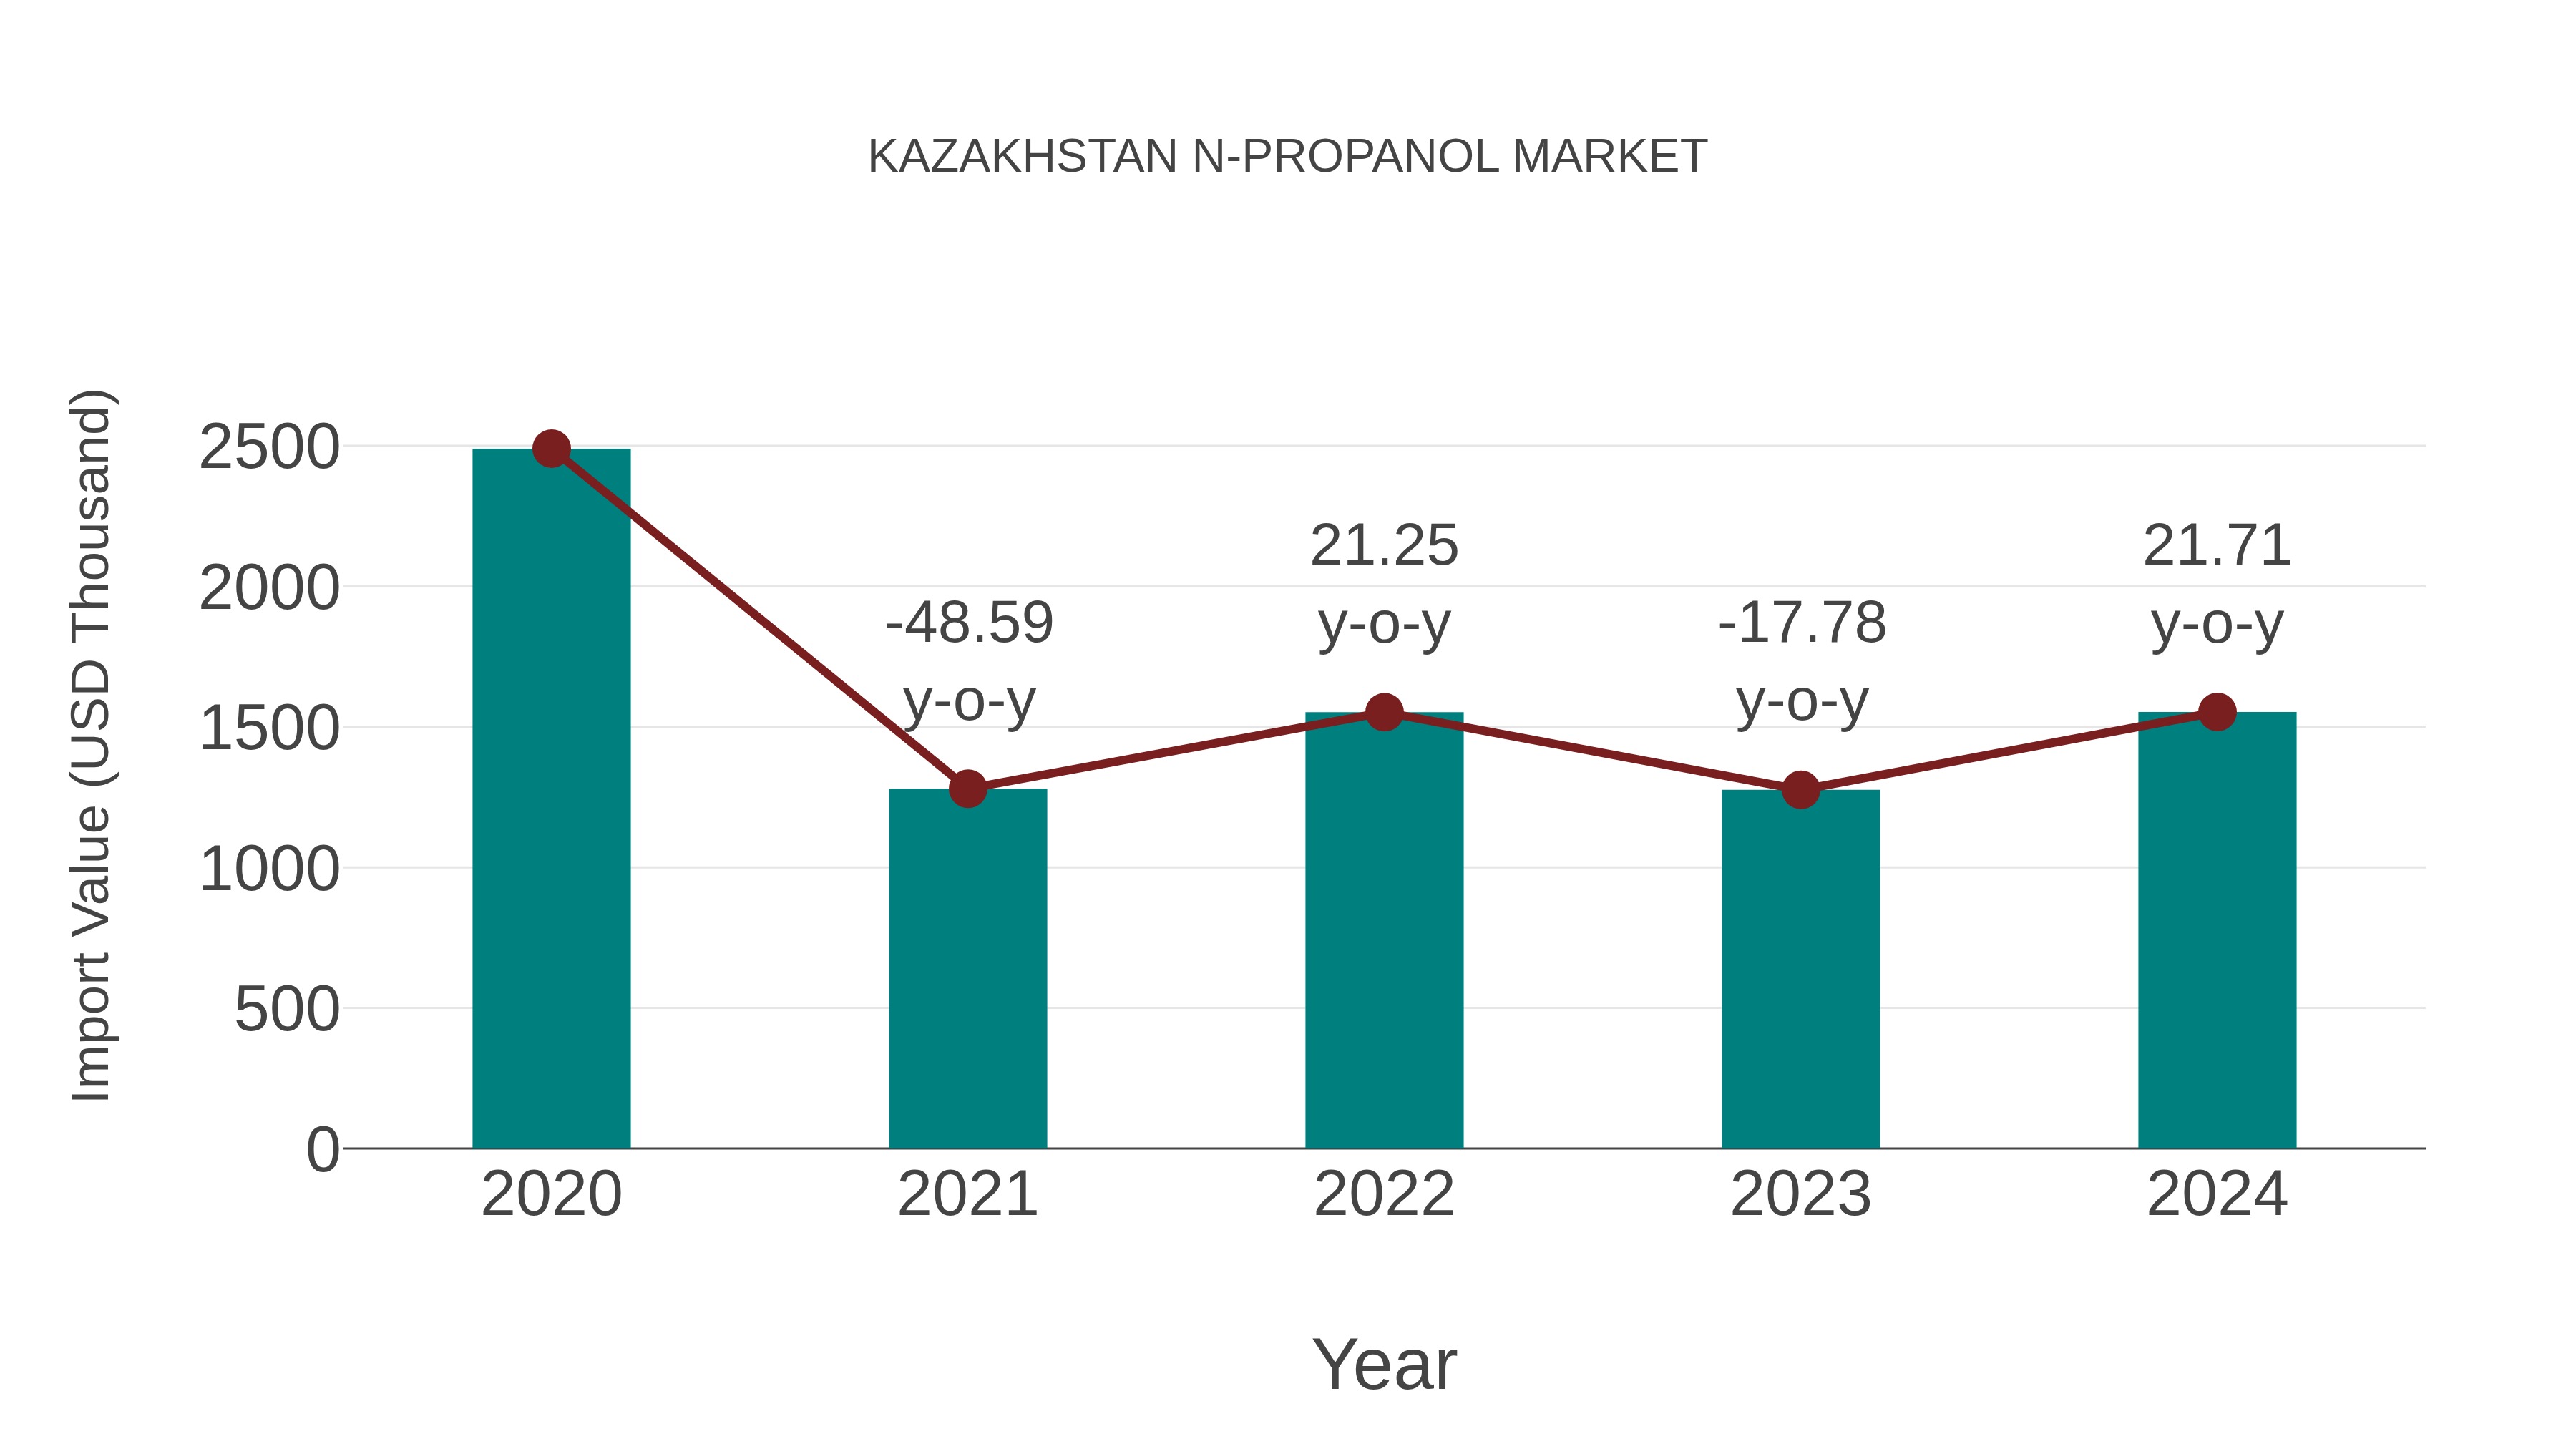
Kazakhstan N-propanol Market: Import Trend Analysis
In the Kazakhstan n-propanol market, import trends showed a growth rate of 21.71% from 2023 to 2024, contrasting with a -11.13% compound annual growth rate (CAGR) from 2020 to 2024. This fluctuation could be attributed to shifting demand patterns or changes in trade policies impacting market stability.
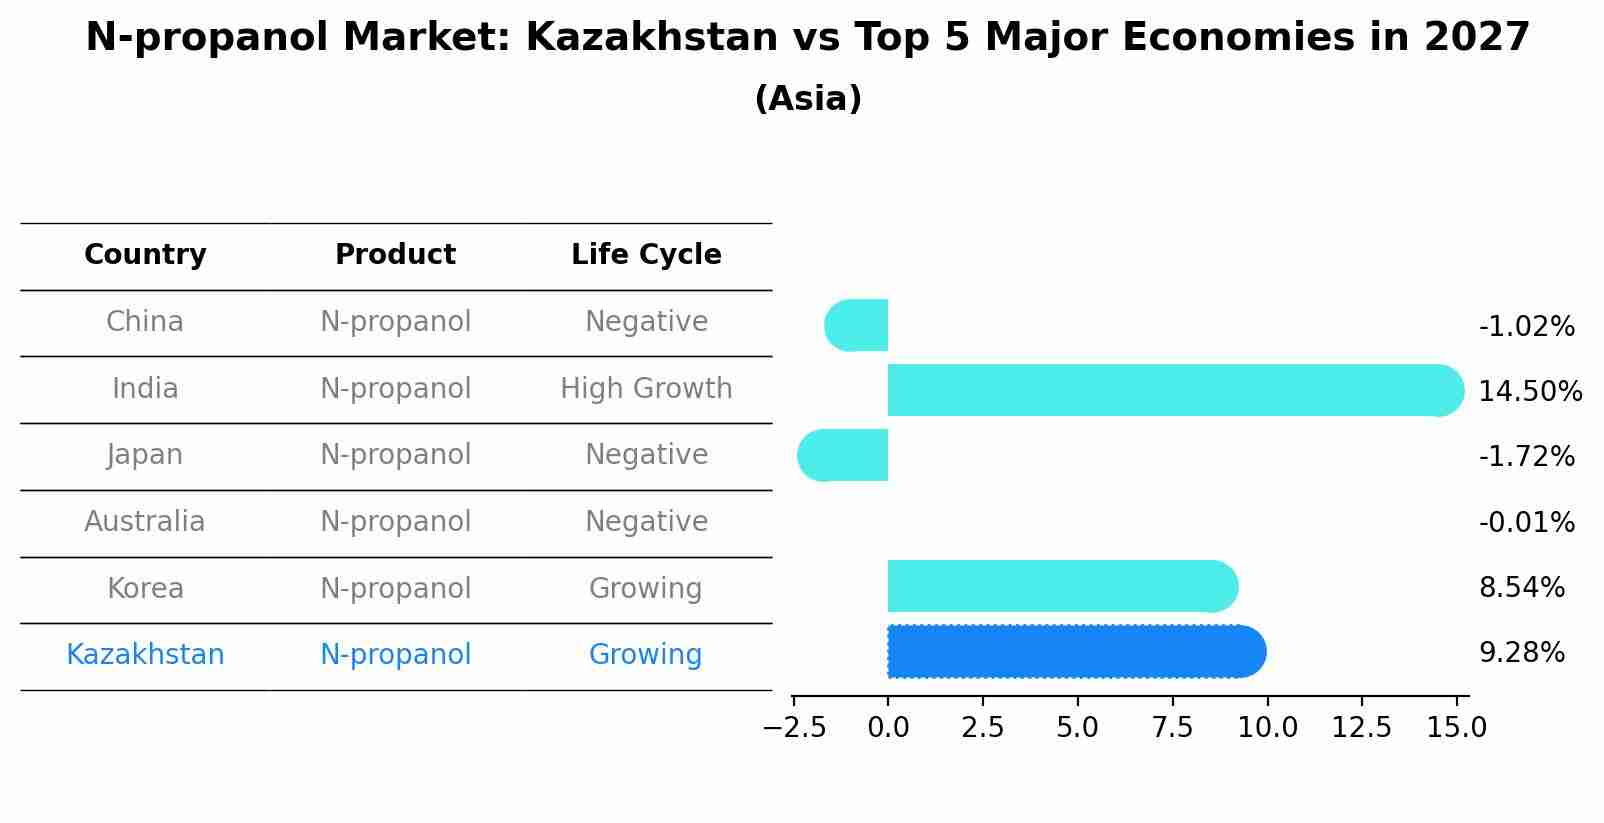
N-propanol Market: Kazakhstan vs Top 5 Major Economies in 2027 (Asia)
By 2027, Kazakhstan's N-propanol market is forecasted to achieve a growing growth rate of 9.28%, with China leading the Asia region, followed by India, Japan, Australia and South Korea.
Kazakhstan N-propanol Market Overview
The Kazakhstan N-propanol market is witnessing growth driven by its applications in manufacturing, pharmaceuticals, and the chemical industry. N-propanol is primarily used as a solvent, chemical intermediate, and in the production of cosmetics and personal care products. The increasing demand for efficient solvents in industrial processes is fueling market expansion. Additionally, the growth of end-use industries, such as paints and coatings, is contributing to the rising consumption of N-propanol in the country.
Drivers of the market
Factors driving the N-propanol market could include its diverse industrial applications such as in pharmaceuticals, coatings, and chemicals, increasing demand from end-use industries, and technological advancements leading to improved production processes.
Challenges of the market
Challenges could involve volatility in raw material prices, fluctuating demand from end-user industries such as pharmaceuticals, paints and coatings, and cosmetics, navigating trade barriers and regulations, and managing competition from alternative solvents and chemicals.
Government Policy of the market
In the N-propanol market, government policies aim to ensure product quality, workplace safety, and environmental protection. Regulations may include chemical safety standards, occupational exposure limits for workers, and wastewater discharge limits for N-propanol manufacturing facilities.
Key Highlights of the Report:
- Kazakhstan N-propanol Market Outlook
- Market Size of Kazakhstan N-propanol Market, 2024
- Forecast of Kazakhstan N-propanol Market, 2031
- Historical Data and Forecast of Kazakhstan N-propanol Revenues & Volume for the Period 2018 - 2031
- Kazakhstan N-propanol Market Trend Evolution
- Kazakhstan N-propanol Market Drivers and Challenges
- Kazakhstan N-propanol Price Trends
- Kazakhstan N-propanol Porter's Five Forces
- Kazakhstan N-propanol Industry Life Cycle
- Historical Data and Forecast of Kazakhstan N-propanol Market Revenues & Volume By Type for the Period 2018 - 2031
- Historical Data and Forecast of Kazakhstan N-propanol Market Revenues & Volume By Ethylene Hydrogenation Method for the Period 2018 - 2031
- Historical Data and Forecast of Kazakhstan N-propanol Market Revenues & Volume By Allyl Alcohol Hydrogenation Method for the Period 2018 - 2031
- Historical Data and Forecast of Kazakhstan N-propanol Market Revenues & Volume By Other Compounds Byproduct Method for the Period 2018 - 2031
- Historical Data and Forecast of Kazakhstan N-propanol Market Revenues & Volume By Application for the Period 2018 - 2031
- Historical Data and Forecast of Kazakhstan N-propanol Market Revenues & Volume By Coatings for the Period 2018 - 2031
- Historical Data and Forecast of Kazakhstan N-propanol Market Revenues & Volume By Food Additive for the Period 2018 - 2031
- Historical Data and Forecast of Kazakhstan N-propanol Market Revenues & Volume By Pharmaceutical for the Period 2018 - 2031
- Historical Data and Forecast of Kazakhstan N-propanol Market Revenues & Volume By Cosmetics for the Period 2018 - 2031
- Historical Data and Forecast of Kazakhstan N-propanol Market Revenues & Volume By Others for the Period 2018 - 2031
- Kazakhstan N-propanol Import Export Trade Statistics
- Market Opportunity Assessment By Type
- Market Opportunity Assessment By Application
- Kazakhstan N-propanol Top Companies Market Share
- Kazakhstan N-propanol Competitive Benchmarking By Technical and Operational Parameters
- Kazakhstan N-propanol Company Profiles
- Kazakhstan N-propanol Key Strategic Recommendations
Frequently Asked Questions About the Market Study (FAQs):
6Wresearch actively monitors the Kazakhstan N-propanol Market and publishes its comprehensive annual report, highlighting emerging trends, growth drivers, revenue analysis, and forecast outlook. Our insights help businesses to make data-backed strategic decisions with ongoing market dynamics. Our analysts track relevent industries related to the Kazakhstan N-propanol Market, allowing our clients with actionable intelligence and reliable forecasts tailored to emerging regional needs.
Yes, we provide customisation as per your requirements. To learn more, feel free to contact us on sales@6wresearch.com
1 Executive Summary |
2 Introduction |
2.1 Key Highlights of the Report |
2.2 Report Description |
2.3 Market Scope & Segmentation |
2.4 Research Methodology |
2.5 Assumptions |
3 Kazakhstan N-propanol Market Overview |
3.1 Kazakhstan Country Macro Economic Indicators |
3.2 Kazakhstan N-propanol Market Revenues & Volume, 2021 & 2031F |
3.3 Kazakhstan N-propanol Market - Industry Life Cycle |
3.4 Kazakhstan N-propanol Market - Porter's Five Forces |
3.5 Kazakhstan N-propanol Market Revenues & Volume Share, By Type, 2021 & 2031F |
3.6 Kazakhstan N-propanol Market Revenues & Volume Share, By Application, 2021 & 2031F |
4 Kazakhstan N-propanol Market Dynamics |
4.1 Impact Analysis |
4.2 Market Drivers |
4.2.1 Growing demand for n-propanol in various industries such as pharmaceuticals, chemicals, and cosmetics due to its use as a solvent and intermediate in manufacturing processes. |
4.2.2 Increasing investments in research and development activities to enhance the production processes and quality of n-propanol. |
4.2.3 Favorable government regulations and policies supporting the growth of the chemical industry in Kazakhstan. |
4.3 Market Restraints |
4.3.1 Fluctuating prices of raw materials used in the production of n-propanol impacting the overall production cost and profitability. |
4.3.2 Intense competition from alternative solvents and chemicals in the market. |
4.3.3 Environmental concerns and regulations regarding the use and disposal of n-propanol affecting production and usage. |
5 Kazakhstan N-propanol Market Trends |
6 Kazakhstan N-propanol Market, By Types |
6.1 Kazakhstan N-propanol Market, By Type |
6.1.1 Overview and Analysis |
6.1.2 Kazakhstan N-propanol Market Revenues & Volume, By Type, 2021-2031F |
6.1.3 Kazakhstan N-propanol Market Revenues & Volume, By Ethylene Hydrogenation Method, 2021-2031F |
6.1.4 Kazakhstan N-propanol Market Revenues & Volume, By Allyl Alcohol Hydrogenation Method, 2021-2031F |
6.1.5 Kazakhstan N-propanol Market Revenues & Volume, By Other Compounds Byproduct Method, 2021-2031F |
6.2 Kazakhstan N-propanol Market, By Application |
6.2.1 Overview and Analysis |
6.2.2 Kazakhstan N-propanol Market Revenues & Volume, By Coatings, 2021-2031F |
6.2.3 Kazakhstan N-propanol Market Revenues & Volume, By Food Additive, 2021-2031F |
6.2.4 Kazakhstan N-propanol Market Revenues & Volume, By Pharmaceutical, 2021-2031F |
6.2.5 Kazakhstan N-propanol Market Revenues & Volume, By Cosmetics, 2021-2031F |
6.2.6 Kazakhstan N-propanol Market Revenues & Volume, By Others, 2021-2031F |
7 Kazakhstan N-propanol Market Import-Export Trade Statistics |
7.1 Kazakhstan N-propanol Market Export to Major Countries |
7.2 Kazakhstan N-propanol Market Imports from Major Countries |
8 Kazakhstan N-propanol Market Key Performance Indicators |
8.1 Percentage increase in research and development investments in the n-propanol industry. |
8.2 Number of new applications or industries adopting n-propanol as a solvent. |
8.3 Compliance rate with environmental regulations and sustainability practices in n-propanol production. |
9 Kazakhstan N-propanol Market - Opportunity Assessment |
9.1 Kazakhstan N-propanol Market Opportunity Assessment, By Type, 2021 & 2031F |
9.2 Kazakhstan N-propanol Market Opportunity Assessment, By Application, 2021 & 2031F |
10 Kazakhstan N-propanol Market - Competitive Landscape |
10.1 Kazakhstan N-propanol Market Revenue Share, By Companies, 2024 |
10.2 Kazakhstan N-propanol Market Competitive Benchmarking, By Operating and Technical Parameters |
11 Company Profiles |
12 Recommendations |
13 Disclaimer |
Export potential assessment - trade Analytics for 2030
Export potential enables firms to identify high-growth global markets with greater confidence by combining advanced trade intelligence with a structured quantitative methodology. The framework analyzes emerging demand trends and country-level import patterns while integrating macroeconomic and trade datasets such as GDP and population forecasts, bilateral import–export flows, tariff structures, elasticity differentials between developed and developing economies, geographic distance, and import demand projections. Using weighted trade values from 2020–2024 as the base period to project country-to-country export potential for 2030, these inputs are operationalized through calculated drivers such as gravity model parameters, tariff impact factors, and projected GDP per-capita growth. Through an analysis of hidden potentials, demand hotspots, and market conditions that are most favorable to success, this method enables firms to focus on target countries, maximize returns, and global expansion with data, backed by accuracy.
By factoring in the projected importer demand gap that is currently unmet and could be potential opportunity, it identifies the potential for the Exporter (Country) among 190 countries, against the general trade analysis, which identifies the biggest importer or exporter.
To discover high-growth global markets and optimize your business strategy:
Click Here
Pricing
- Single User License$ 1,995
- Department License$ 2,400
- Site License$ 3,120
- Global License$ 3,795

Search
Thought Leadership and Analyst Meet


Our Clients
Latest Reports
- France Thermally Conductive Filler Dispersants Market (2026-2032) | Challenges, Restraints, Value, Share, Size, segmentation, Analysis, Trends, Investment Opportunities, Outlook, Pricing, Demand, Forecast, Revenue, Companies, Growth, Drivers, Strategy, Insights, Competition
- Egypt Thermally Conductive Filler Dispersants Market (2026-2032) | Competition, Forecast, Strategy, Value, Insights, Outlook, Investment Opportunities, Pricing, Demand, Share, segmentation, Drivers, Size, Companies, Restraints, Growth, Trends, Revenue, Challenges, Analysis
- Czech Republic Thermally Conductive Filler Dispersants Market (2026-2032) | Forecast, Pricing, Analysis, Drivers, Insights, Size, Demand, Growth, Challenges, segmentation, Competition, Outlook, Trends, Investment Opportunities, Companies, Strategy, Revenue, Share, Value, Restraints
- Colombia Thermally Conductive Filler Dispersants Market (2026-2032) | segmentation, Trends, Share, Drivers, Strategy, Companies, Demand, Insights, Size, Challenges, Value, Competition, Analysis, Growth, Revenue, Restraints, Forecast, Pricing, Outlook, Investment Opportunities
- China Thermally Conductive Filler Dispersants Market (2026-2032) | Restraints, Investment Opportunities, Pricing, Companies, Share, Size, Challenges, Trends, Outlook, Value, Analysis, Competition, Revenue, Drivers, Forecast, Demand, Insights, Growth, Strategy, segmentation
- Chile Thermally Conductive Filler Dispersants Market (2026-2032) | Investment Opportunities, Trends, Value, Restraints, Share, Companies, Forecast, segmentation, Pricing, Challenges, Demand, Size, Analysis, Drivers, Outlook, Growth, Competition, Strategy, Revenue, Insights
- Cambodia Thermally Conductive Filler Dispersants Market (2026-2032) | Analysis, Share, Outlook, Strategy, Pricing, Demand, Size, Growth, segmentation, Insights, Revenue, Forecast, Challenges, Competition, Companies, Investment Opportunities, Trends, Restraints, Value, Drivers
- Brazil Thermally Conductive Filler Dispersants Market (2026-2032) | Restraints, Forecast, Competition, Size, Revenue, Value, Investment Opportunities, Trends, Insights, Outlook, Growth, Analysis, Drivers, segmentation, Pricing, Challenges, Strategy, Share, Companies, Demand
- Bangladesh Thermally Conductive Filler Dispersants Market (2026-2032) | Restraints, Trends, Analysis, Competition, Insights, Forecast, Value, Investment Opportunities, Pricing, Share, Demand, Outlook, Revenue, segmentation, Companies, Drivers, Growth, Size, Challenges, Strategy
- Bahrain Thermally Conductive Filler Dispersants Market (2026-2032) | Trends, Outlook, Pricing, Demand, Value, Competition, Forecast, Growth, segmentation, Revenue, Companies, Analysis, Insights, Size, Drivers, Challenges, Strategy, Investment Opportunities, Share, Restraints
Industry Events and Analyst Meet

HIMTEX 2026

India Refining Summit 2026

India EV Show 2026

EV tech India Expo 2026

Auto Tech Asia 2026
Whitepaper
- Middle East & Africa Commercial Security Market Click here to view more.
- Middle East & Africa Fire Safety Systems & Equipment Market Click here to view more.
- GCC Drone Market Click here to view more.
- Middle East Lighting Fixture Market Click here to view more.
- GCC Physical & Perimeter Security Market Click here to view more.
6WResearch In News
- Doha a strategic location for EV manufacturing hub: IPA Qatar
- Demand for luxury TVs surging in the GCC, says Samsung
- Empowering Growth: The Thriving Journey of Bangladesh’s Cable Industry
- Demand for luxury TVs surging in the GCC, says Samsung
- Video call with a traditional healer? Once unthinkable, it’s now common in South Africa
- Intelligent Buildings To Smooth GCC’s Path To Net Zero