Kazakhstan Organic Acids Market (2020-2026) | Analysis, Share, Revenue, Companies, Outlook, Size, Forecast, COVID-19 IMPACT, Value, Growth, Trends & Industry
Market Forecast By Type (Acetic Acid, Citric Acid, Formic Acid, Lactic Acid, Itaconic Acid, Succinic Acid, Gluconic Acid, Others), By Sources (Biomass, Molasses, Starch, Chemical Synthesis, Argo-Industrial Residue), By End-user (Food & Beverage, Animal Feed, Chemical & Industrial, Pharmaceuticals, Personal Care, Agriculture, Others) And Competitive Landscape
| Product Code: ETC034518 | Publication Date: Jun 2023 | Updated Date: Feb 2026 | Product Type: Report | |
| Publisher: 6Wresearch | Author: Ravi Bhandari | No. of Pages: 70 | No. of Figures: 35 | No. of Tables: 5 |
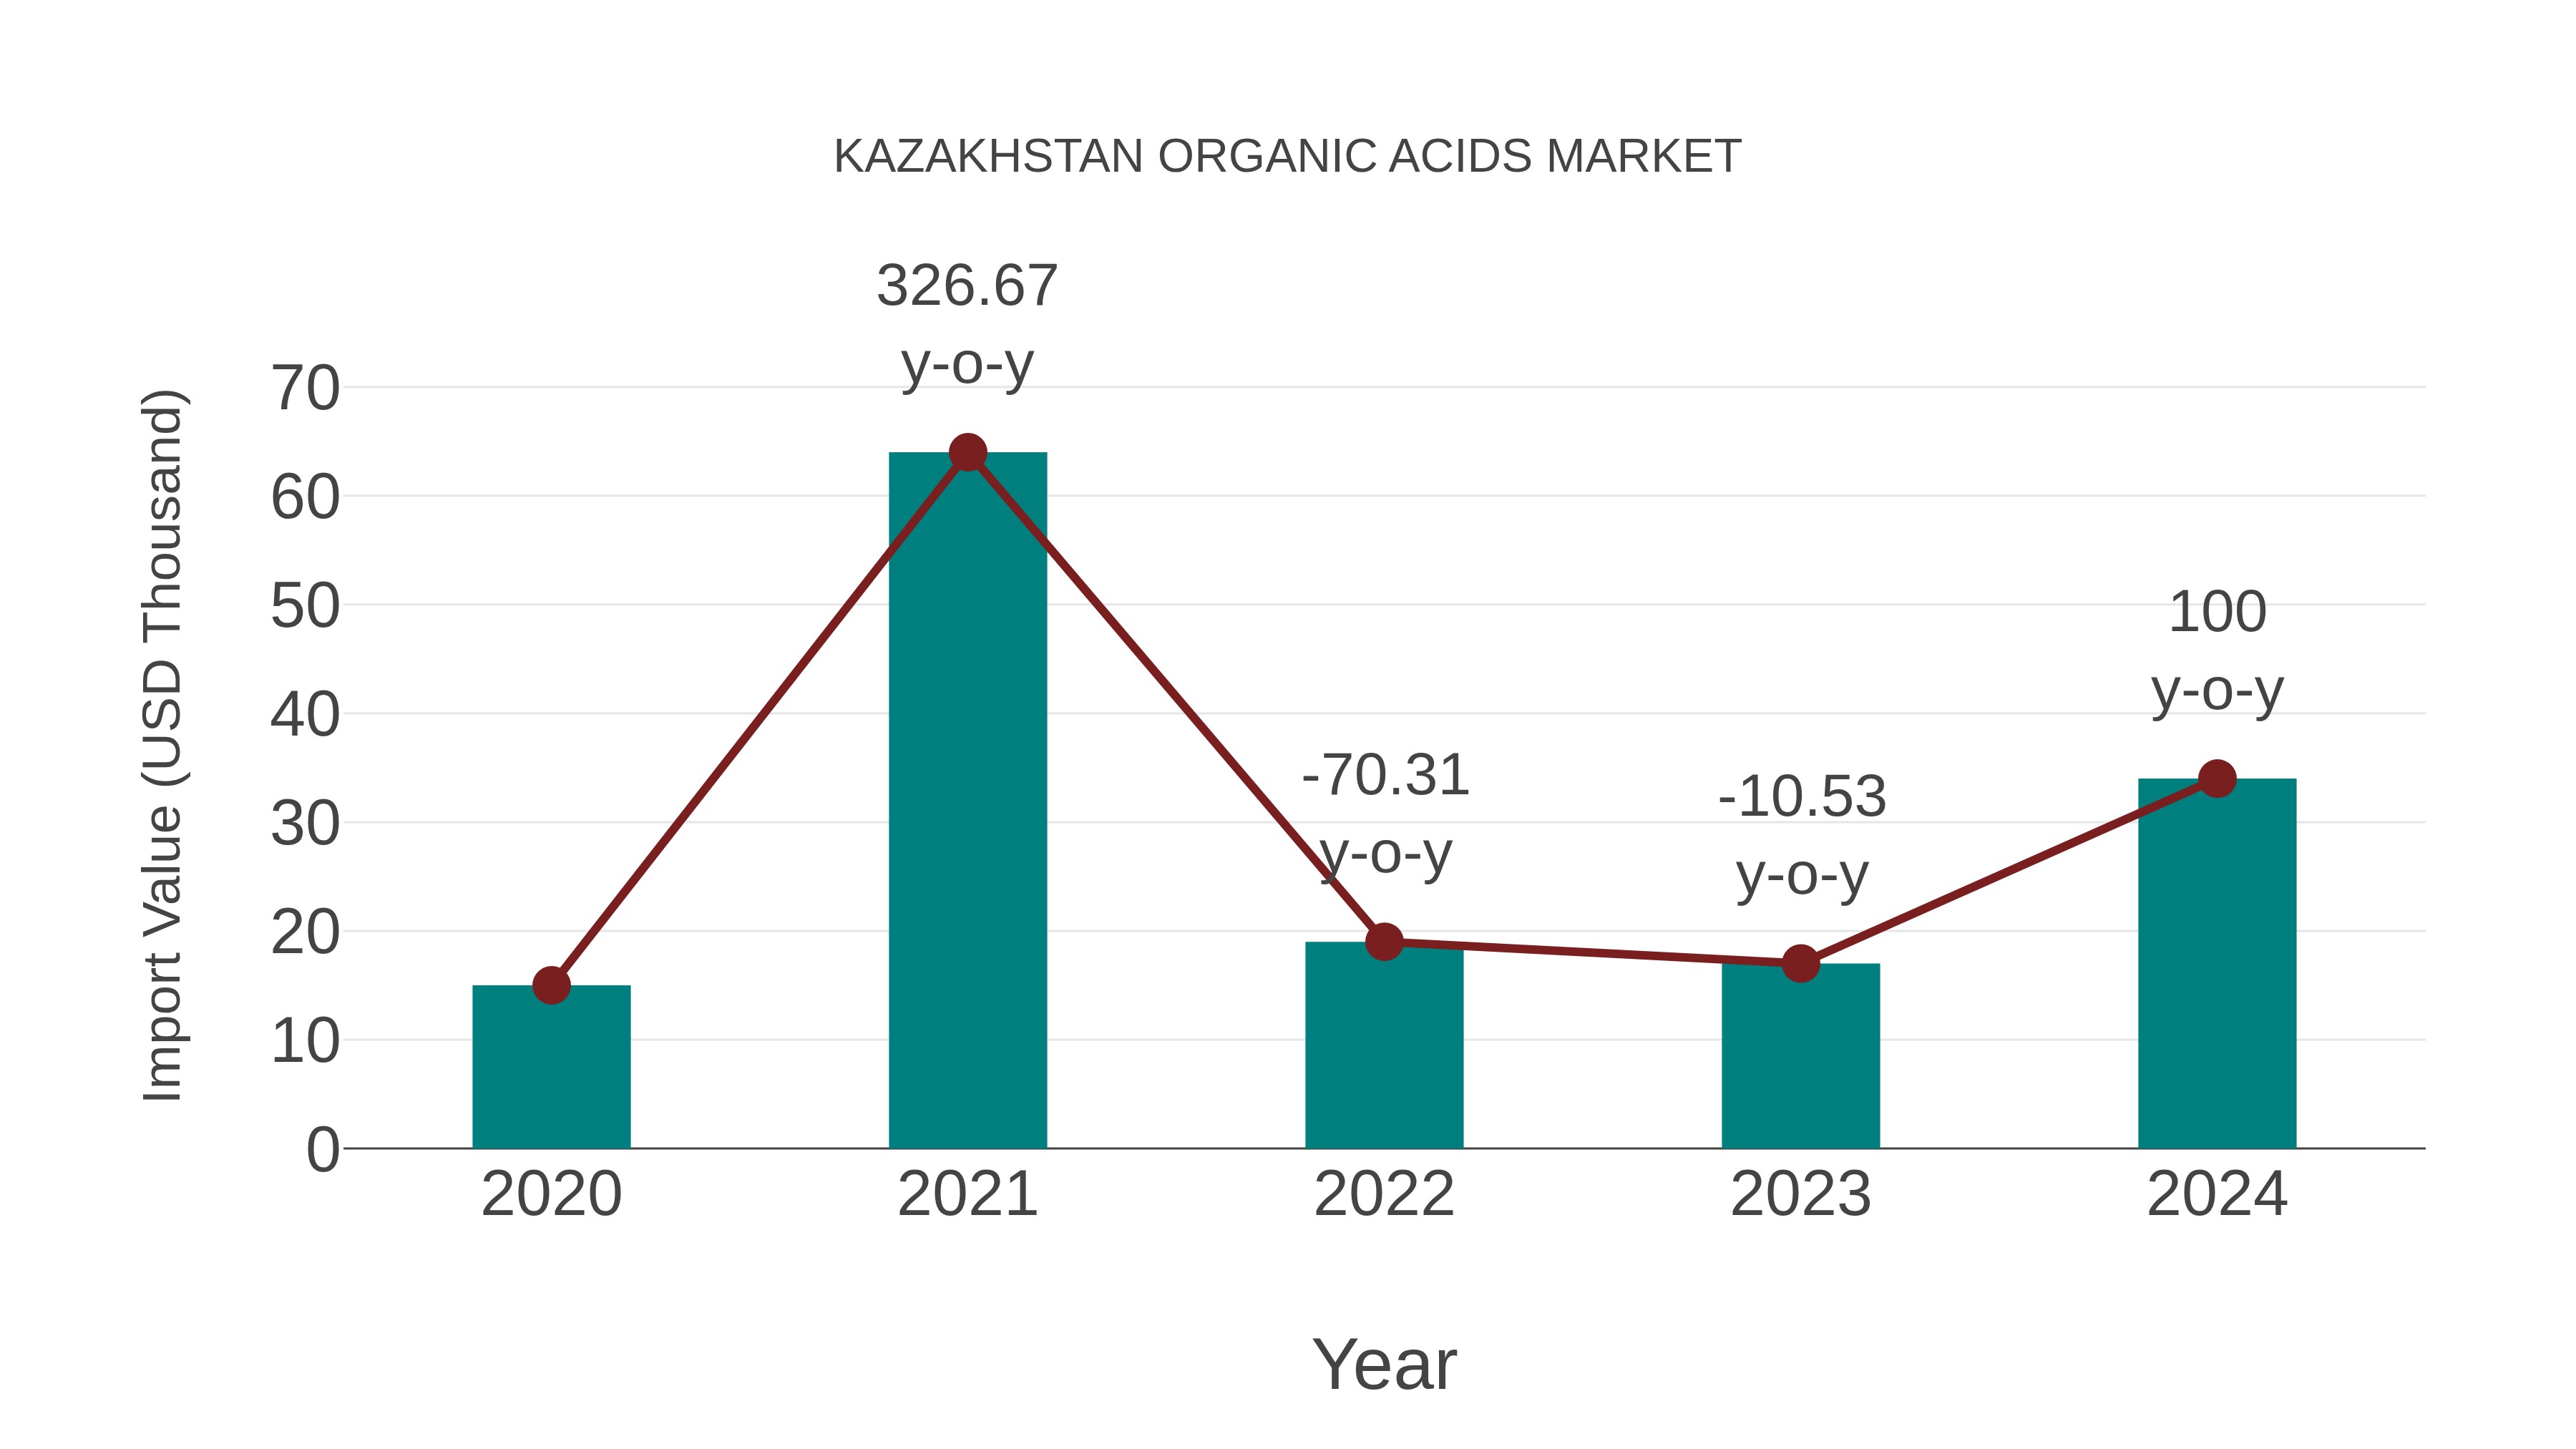
Kazakhstan Organic Acids Market: Import Trend Analysis
In the Kazakhstan organic acids market, the import trend experienced significant growth from 2023 to 2024, with a remarkable 100.0% increase. The compound annual growth rate (CAGR) for the period of 2020-2024 stood at 22.7%. This surge in imports can be attributed to a notable shift in demand towards organic acids, reflecting evolving consumer preferences and increasing industrial applications in the market.
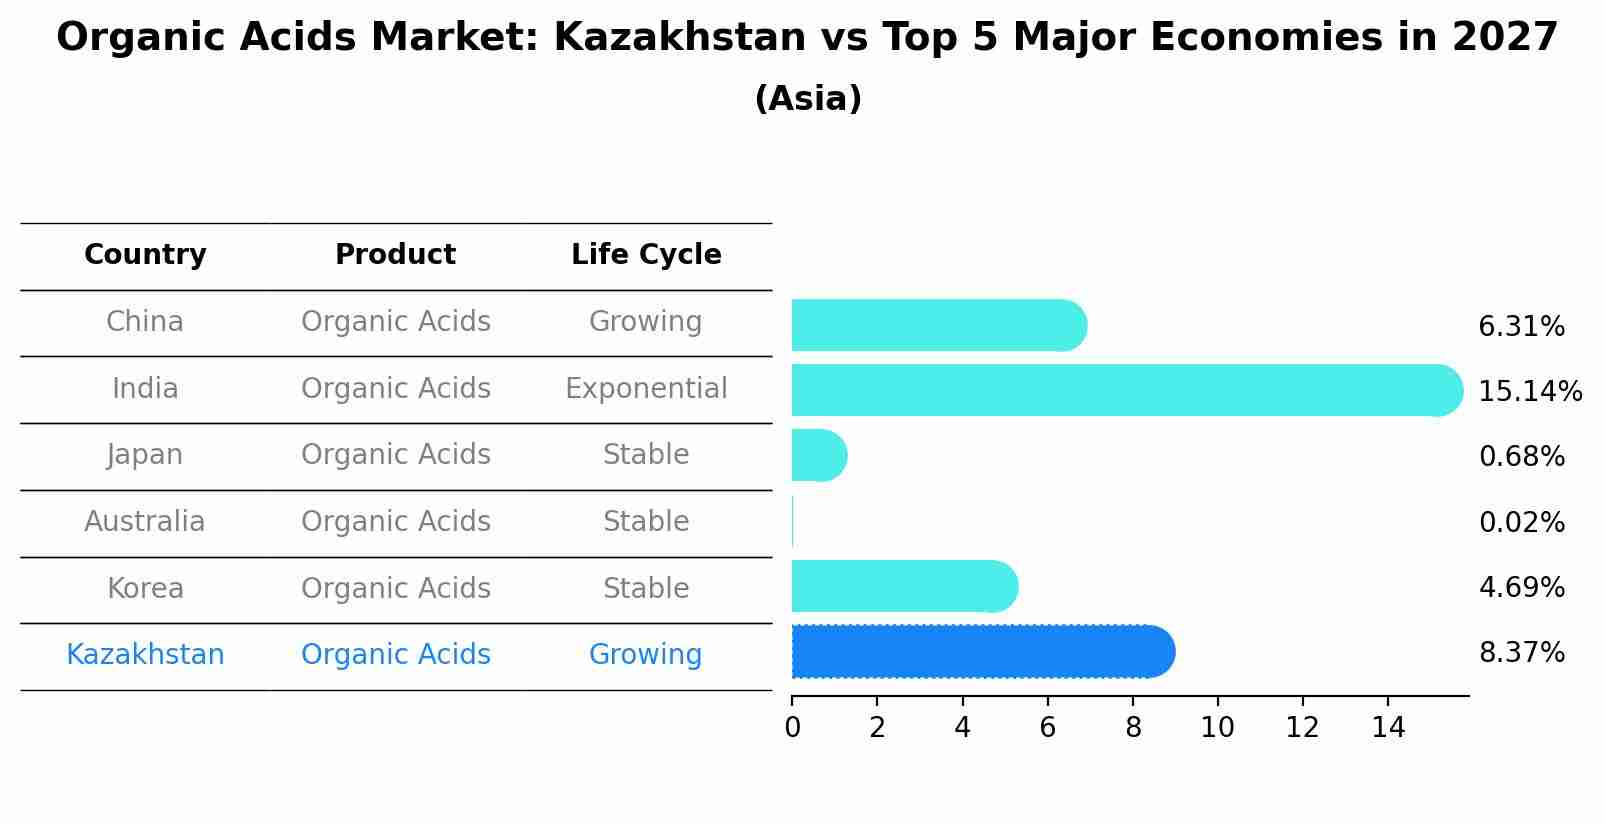
Organic Acids Market: Kazakhstan vs Top 5 Major Economies in 2027 (Asia)
In the Asia region, the Organic Acids market in Kazakhstan is projected to expand at a growing growth rate of 8.37% by 2027. The largest economy is China, followed by India, Japan, Australia and South Korea.
Kazakhstan Organic Acids Market Synopsis
Kazakhstan organic acids market is expected to witness significant growth in the forecast period of 2020-2026. The increasing demand for organic acids due to their wide range of application in industries such as food & beverages, pharmaceuticals, and others are contributing to its rapid growth. Also, the flourishing health and wellness trend among consumers has increased their preference towards natural products with added health benefits which are further driving the sale of organic acids around Kazakhstan region. Additionally, government initiatives towards developing sustainable agriculture practices also provide impetus to this market growth.
Major players operating in Kazakhstan?s organic acid market include Evonik Industries AG, BASF SE, DowDuPont Inc., Tate & Lyle PLC., Corbion Purac NV, Archer Daniels Midland Company (ADM), Agrana Beteiligungs-AG and CHR Hansen Holding A/S among others. These companies are involved in several strategic moves such as mergers & acquisitions and product launches that will help them maintain dominance over the global market share during the forecasted period 2020-2026.
Key Highlights of the Report:
- Kazakhstan Organic Acids Market Outlook
- Market Size of Kazakhstan Organic Acids Market, 2019
- Forecast of Kazakhstan Organic Acids Market, 2026
- Historical Data and Forecast of Kazakhstan Organic Acids Revenues & Volume for the Period 2016 - 2026
- Kazakhstan Organic Acids Market Trend Evolution
- Kazakhstan Organic Acids Market Drivers and Challenges
- Kazakhstan Organic Acids Price Trends
- Kazakhstan Organic Acids Porter's Five Forces
- Kazakhstan Organic Acids Industry Life Cycle
- Historical Data and Forecast of Kazakhstan Organic Acids Market Revenues & Volume By Type for the Period 2016 - 2026
- Historical Data and Forecast of Kazakhstan Organic Acids Market Revenues & Volume By Acetic Acid for the Period 2016 - 2026
- Historical Data and Forecast of Kazakhstan Organic Acids Market Revenues & Volume By Citric Acid for the Period 2016 - 2026
- Historical Data and Forecast of Kazakhstan Organic Acids Market Revenues & Volume By Formic Acid for the Period 2016 - 2026
- Historical Data and Forecast of Kazakhstan Organic Acids Market Revenues & Volume By Lactic Acid for the Period 2016 - 2026
- Historical Data and Forecast of Kazakhstan Organic Acids Market Revenues & Volume By Itaconic Acid for the Period 2016 - 2026
- Historical Data and Forecast of Kazakhstan Organic Acids Market Revenues & Volume By Succinic Acid for the Period 2016 - 2026
- Historical Data and Forecast of Kazakhstan Organic Acids Market Revenues & Volume By Gluconic Acid for the Period 2016 - 2026
- Historical Data and Forecast of Kazakhstan Acetic Acid Organic Acids Market Revenues & Volume By Others for the Period 2016 - 2026
- Historical Data and Forecast of Kazakhstan Organic Acids Market Revenues & Volume By Sources for the Period 2016 - 2026
- Historical Data and Forecast of Kazakhstan Organic Acids Market Revenues & Volume By Biomass for the Period 2016 - 2026
- Historical Data and Forecast of Kazakhstan Organic Acids Market Revenues & Volume By Molasses for the Period 2016 - 2026
- Historical Data and Forecast of Kazakhstan Organic Acids Market Revenues & Volume By Starch for the Period 2016 - 2026
- Historical Data and Forecast of Kazakhstan Organic Acids Market Revenues & Volume By Chemical Synthesis for the Period 2016 - 2026
- Historical Data and Forecast of Kazakhstan Organic Acids Market Revenues & Volume By Argo-Industrial Residue for the Period 2016 - 2026
- Historical Data and Forecast of Kazakhstan Organic Acids Market Revenues & Volume By End-user for the Period 2016 - 2026
- Historical Data and Forecast of Kazakhstan Organic Acids Market Revenues & Volume By Food & Beverage for the Period 2016 - 2026
- Historical Data and Forecast of Kazakhstan Organic Acids Market Revenues & Volume By Animal Feed for the Period 2016 - 2026
- Historical Data and Forecast of Kazakhstan Organic Acids Market Revenues & Volume By Chemical & Industrial for the Period 2016 - 2026
- Historical Data and Forecast of Kazakhstan Organic Acids Market Revenues & Volume By Pharmaceuticals for the Period 2016 - 2026
- Historical Data and Forecast of Kazakhstan Organic Acids Market Revenues & Volume By Personal Care for the Period 2016 - 2026
- Historical Data and Forecast of Kazakhstan Organic Acids Market Revenues & Volume By Agriculture for the Period 2016 - 2026
- Historical Data and Forecast of Kazakhstan Organic Acids Market Revenues & Volume By Others for the Period 2016 - 2026
- Kazakhstan Organic Acids Import Export Trade Statistics
- Market Opportunity Assessment By Type
- Market Opportunity Assessment By Sources
- Market Opportunity Assessment By End-user
- Kazakhstan Organic Acids Top Companies Market Share
- Kazakhstan Organic Acids Competitive Benchmarking By Technical and Operational Parameters
- Kazakhstan Organic Acids Company Profiles
- Kazakhstan Organic Acids Key Strategic Recommendations
Frequently Asked Questions About the Market Study (FAQs):
6Wresearch actively monitors the Kazakhstan Organic Acids Market and publishes its comprehensive annual report, highlighting emerging trends, growth drivers, revenue analysis, and forecast outlook. Our insights help businesses to make data-backed strategic decisions with ongoing market dynamics. Our analysts track relevent industries related to the Kazakhstan Organic Acids Market, allowing our clients with actionable intelligence and reliable forecasts tailored to emerging regional needs.
Yes, we provide customisation as per your requirements. To learn more, feel free to contact us on sales@6wresearch.com
1 Executive Summary |
2 Introduction |
2.1 Key Highlights of the Report |
2.2 Report Description |
2.3 Market Scope & Segmentation |
2.4 Research Methodology |
2.5 Assumptions |
3 Kazakhstan Organic Acids Market Overview |
3.1 Kazakhstan Country Macro Economic Indicators |
3.2 Kazakhstan Organic Acids Market Revenues & Volume, 2019 & 2026F |
3.3 Kazakhstan Organic Acids Market - Industry Life Cycle |
3.4 Kazakhstan Organic Acids Market - Porter's Five Forces |
3.5 Kazakhstan Organic Acids Market Revenues & Volume Share, By Type, 2019 & 2026F |
3.6 Kazakhstan Organic Acids Market Revenues & Volume Share, By Sources, 2019 & 2026F |
3.7 Kazakhstan Organic Acids Market Revenues & Volume Share, By End-user, 2019 & 2026F |
4 Kazakhstan Organic Acids Market Dynamics |
4.1 Impact Analysis |
4.2 Market Drivers |
4.3 Market Restraints |
5 Kazakhstan Organic Acids Market Trends |
6 Kazakhstan Organic Acids Market, By Types |
6.1 Kazakhstan Organic Acids Market, By Type |
6.1.1 Overview and Analysis |
6.1.2 Kazakhstan Organic Acids Market Revenues & Volume, By Type, 2016 - 2026F |
6.1.3 Kazakhstan Organic Acids Market Revenues & Volume, By Acetic Acid, 2016 - 2026F |
6.1.4 Kazakhstan Organic Acids Market Revenues & Volume, By Citric Acid, 2016 - 2026F |
6.1.5 Kazakhstan Organic Acids Market Revenues & Volume, By Formic Acid, 2016 - 2026F |
6.1.6 Kazakhstan Organic Acids Market Revenues & Volume, By Lactic Acid, 2016 - 2026F |
6.1.7 Kazakhstan Organic Acids Market Revenues & Volume, By Itaconic Acid, 2016 - 2026F |
6.1.8 Kazakhstan Organic Acids Market Revenues & Volume, By Succinic Acid, 2016 - 2026F |
6.1.9 Kazakhstan Organic Acids Market Revenues & Volume, By Others, 2016 - 2026F |
6.1.10 Kazakhstan Organic Acids Market Revenues & Volume, By Others, 2016 - 2026F |
6.2 Kazakhstan Organic Acids Market, By Sources |
6.2.1 Overview and Analysis |
6.2.2 Kazakhstan Organic Acids Market Revenues & Volume, By Biomass, 2016 - 2026F |
6.2.3 Kazakhstan Organic Acids Market Revenues & Volume, By Molasses, 2016 - 2026F |
6.2.4 Kazakhstan Organic Acids Market Revenues & Volume, By Starch, 2016 - 2026F |
6.2.5 Kazakhstan Organic Acids Market Revenues & Volume, By Chemical Synthesis, 2016 - 2026F |
6.2.6 Kazakhstan Organic Acids Market Revenues & Volume, By Argo-Industrial Residue, 2016 - 2026F |
6.3 Kazakhstan Organic Acids Market, By End-user |
6.3.1 Overview and Analysis |
6.3.2 Kazakhstan Organic Acids Market Revenues & Volume, By Food & Beverage, 2016 - 2026F |
6.3.3 Kazakhstan Organic Acids Market Revenues & Volume, By Animal Feed, 2016 - 2026F |
6.3.4 Kazakhstan Organic Acids Market Revenues & Volume, By Chemical & Industrial, 2016 - 2026F |
6.3.5 Kazakhstan Organic Acids Market Revenues & Volume, By Pharmaceuticals, 2016 - 2026F |
6.3.6 Kazakhstan Organic Acids Market Revenues & Volume, By Personal Care, 2016 - 2026F |
6.3.7 Kazakhstan Organic Acids Market Revenues & Volume, By Agriculture, 2016 - 2026F |
7 Kazakhstan Organic Acids Market Import-Export Trade Statistics |
7.1 Kazakhstan Organic Acids Market Export to Major Countries |
7.2 Kazakhstan Organic Acids Market Imports from Major Countries |
8 Kazakhstan Organic Acids Market Key Performance Indicators |
9 Kazakhstan Organic Acids Market - Opportunity Assessment |
9.1 Kazakhstan Organic Acids Market Opportunity Assessment, By Type, 2019 & 2026F |
9.2 Kazakhstan Organic Acids Market Opportunity Assessment, By Sources, 2019 & 2026F |
9.3 Kazakhstan Organic Acids Market Opportunity Assessment, By End-user, 2019 & 2026F |
10 Kazakhstan Organic Acids Market - Competitive Landscape |
10.1 Kazakhstan Organic Acids Market Revenue Share, By Companies, 2019 |
10.2 Kazakhstan Organic Acids Market Competitive Benchmarking, By Operating and Technical Parameters |
11 Company Profiles |
12 Recommendations |
13 Disclaimer |
Global Go To Market Strategy - 2030
Export potential enables firms to identify high-growth global markets with greater confidence by combining advanced trade intelligence with a structured quantitative methodology. The framework analyzes emerging demand trends and country-level import patterns while integrating macroeconomic and trade datasets such as GDP and population forecasts, bilateral import–export flows, tariff structures, elasticity differentials between developed and developing economies, geographic distance, and import demand projections. Using weighted trade values from 2020–2024 as the base period to project country-to-country export potential for 2030, these inputs are operationalized through calculated drivers such as gravity model parameters, tariff impact factors, and projected GDP per-capita growth. Through an analysis of hidden potentials, demand hotspots, and market conditions that are most favorable to success, this method enables firms to focus on target countries, maximize returns, and global expansion with data, backed by accuracy.
By factoring in the projected importer demand gap that is currently unmet and could be potential opportunity, it identifies the potential for the Exporter (Country) among 190 countries, against the general trade analysis, which identifies the biggest importer or exporter.
To discover high-growth global markets and optimize your business strategy:
Click Here
Pricing
- Single User License$ 1,995
- Department License$ 2,400
- Site License$ 3,120
- Global License$ 3,795

Leadership Perspectives from Industry Events
Search
Thought Leadership and Analyst Meet


Our Clients
6WResearch In News
- India Air Conditioner Market Set for Strong Rebound in 2026 After Weather-Led Correction and GST-Driven Recovery: 6Wresearch
- ADAS in India: How Automatic Emergency Braking, Blind Spot Detection & Driver Monitoring are Transforming Road Safety
- Doha a strategic location for EV manufacturing hub: IPA Qatar
- Demand for luxury TVs surging in the GCC, says Samsung
- Empowering Growth: The Thriving Journey of Bangladesh’s Cable Industry
- Demand for luxury TVs surging in the GCC, says Samsung
Latest Reports
- Nicaragua RPG Gaming Market (2026-2032)
- New Zealand RPG Gaming Market (2026-2032)
- Netherlands RPG Gaming Market (2026-2032)
- Nauru RPG Gaming Market (2026-2032)
- Namibia RPG Gaming Market (2026-2032)
- Mozambique RPG Gaming Market (2026-2032)
- Montenegro RPG Gaming Market (2026-2032)
- Mongolia RPG Gaming Market (2026-2032)
- Monaco RPG Gaming Market (2026-2032)
- Micronesia RPG Gaming Market (2026-2032)
Industry Events and Analyst Meet

HIMTEX 2026

India Refining Summit 2026

India EV Show 2026

EV tech India Expo 2026

Auto Tech Asia 2026
Whitepaper
- Middle East & Africa Commercial Security Market Click here to view more.
- Middle East & Africa Fire Safety Systems & Equipment Market Click here to view more.
- GCC Drone Market Click here to view more.
- Middle East Lighting Fixture Market Click here to view more.
- GCC Physical & Perimeter Security Market Click here to view more.