Kenya Fruit Pulp Market (2026-2032) Outlook | Value, Analysis, Revenue, Growth, Size, Forecast, Companies, Industry, Trends & Share
Market Forecast By Fruit Type (Mango, Strawberry, Apple, Guava, Berries, Citrus Fruits, Others), By Form (Liquid, Powder), By Application (Food and Beverages), By Distribution (E-Commerce, Convenience Stores, Supermarkets/Hypermarkets, Specialty Stores, Others) And Competitive Landscape
| Product Code: ETC221690 | Publication Date: Aug 2022 | Updated Date: Jul 2026 | Product Type: Market Research Report | |
| Publisher: 6Wresearch | Author: Ravi Bhandari | No. of Pages: 75 | No. of Figures: 35 | No. of Tables: 20 |
Kenya Fruit Pulp Market Size, Share & Growth Rate
The Kenya Fruit Pulp Market was estimated at USD 180 Million in 2025 and is projected to reach USD 250 Million by 2032, growing at a CAGR of 4.8% from 2026 to 2032. This growth trajectory reflects a robust consumer preference for nutritious and convenient food options, driving demand for fruit-based products like juices and desserts. As health consciousness rises, manufacturers are increasingly focusing on offering diverse fruit pulp varieties, appealing to the evolving tastes and dietary preferences of Kenyan consumers.
Kenya Fruit Pulp Market Year-wise Growth Rate and Key Drivers
This graph highlights how the Kenya Fruit Pulp Market has steadily grown over the years, supported by major growth factors.
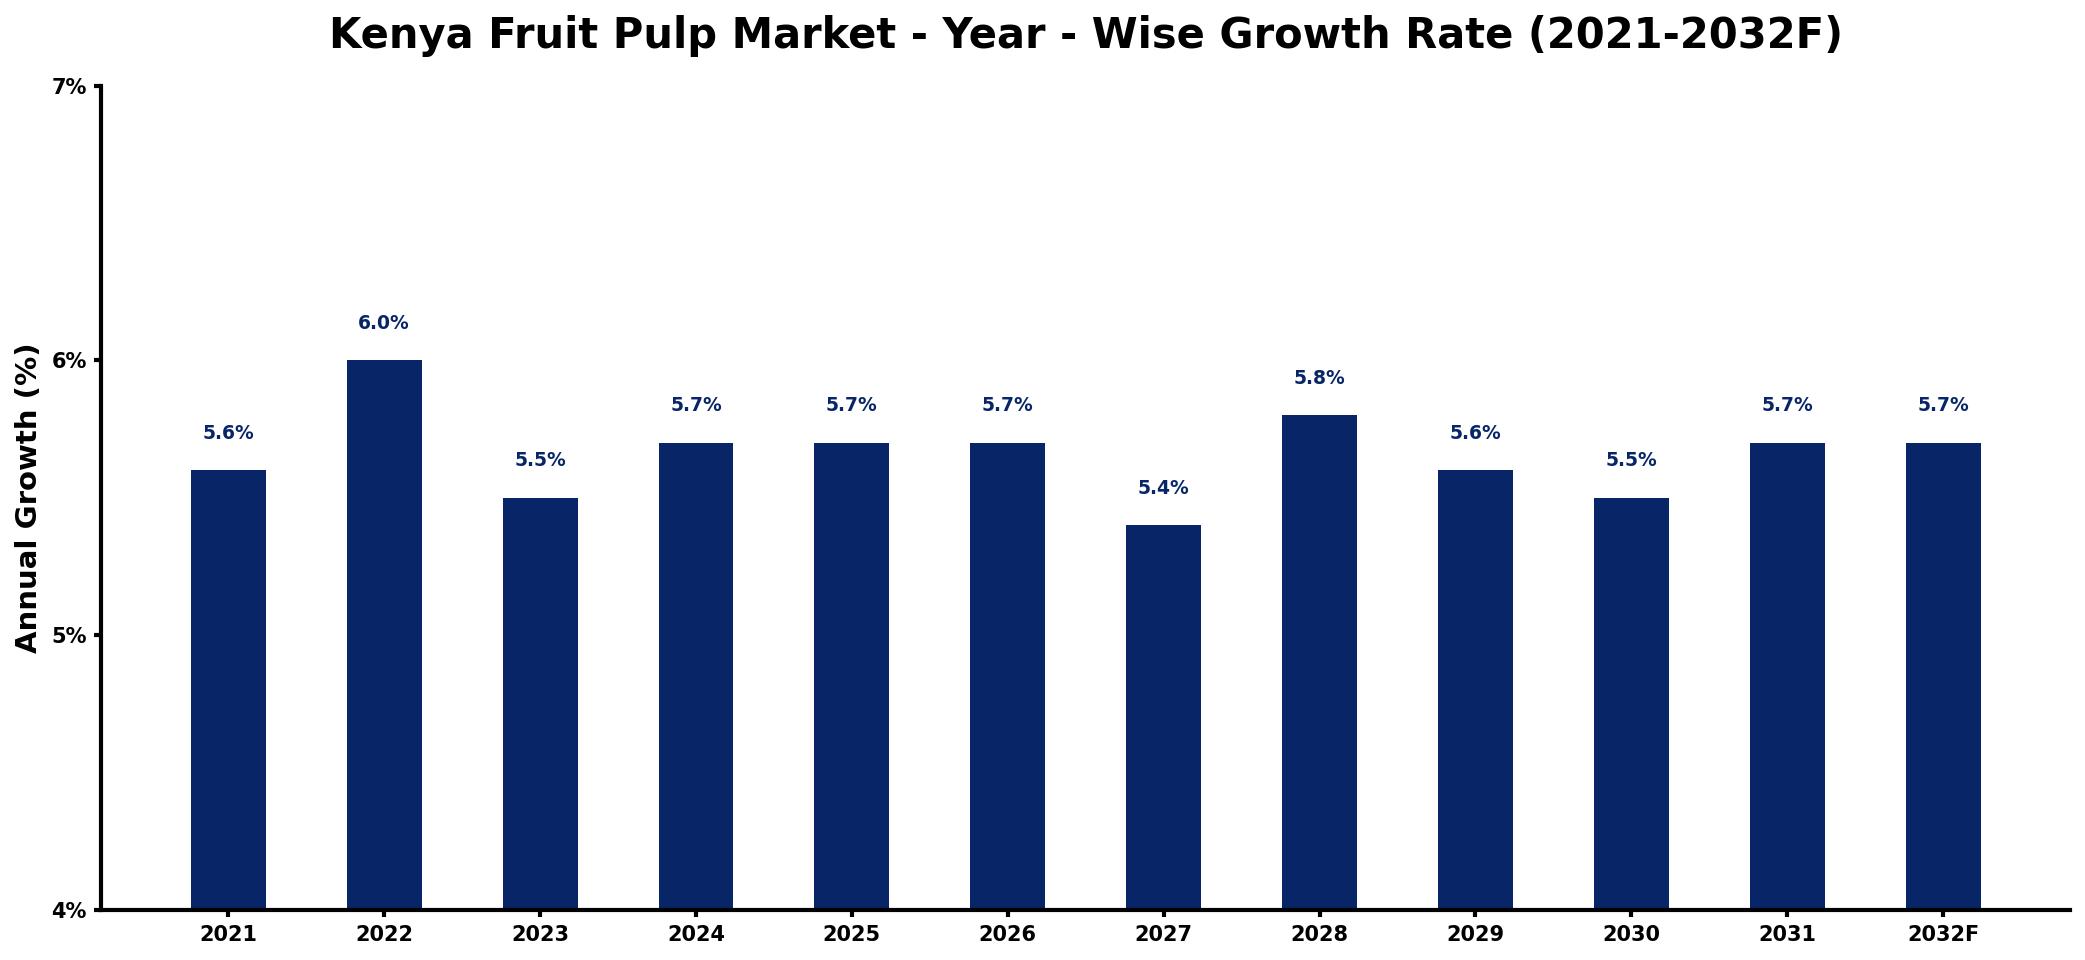
The table below presents the year‑wise growth rates along with the key drivers influencing the market
| Year | Growth Rate | Major Drivers |
| 2021 | 5.6% | Rising consumer health awareness |
| 2022 | 6.0% | Increased demand for natural ingredients |
| 2023 | 5.5% | Expansion of beverage sector offerings |
| 2024 | 5.7% | Growth in food processing industry |
| 2025 | 5.7% | Emerging trends in organic products |
| 2026 | 5.7% | Higher investments in production facilities |
| 2027 | 5.4% | Diversification of product applications |
| 2028 | 5.8% | Strengthening distribution network efficiency |
| 2029 | 5.6% | Growing popularity of convenience products |
| 2030 | 5.5% | Boost in export market opportunities |
| 2031 | 5.7% | Innovations in packaging technologies |
| 2032 | 5.7% | Enhanced consumer spending power |
Note: Market size estimations and growth projections presented in this report are based on 6Wresearch's proprietary forecasting methodology, utilizing the latest available industry data, government publications, and primary research inputs.
Kenya Fruit Pulp Market Synopsis
The Kenya fruit pulp market is experiencing significant momentum, driven by an uptick in consumer demand for natural and health-oriented food products. Recent trends indicate that fruit pulp is gaining traction across various sectors, including beverages and snacks, which has led to a broader acceptance of these products among consumers.
Looking ahead, the market is expected to continue its upward trajectory as innovative processing technologies enhance the quality and availability of fruit pulp. This aligns with the growing emphasis on authentic flavors and ingredient transparency, positioning fruit pulp as a vital component in the processed foods landscape.
Kenya Fruit Pulp Market Key Takeaways
- Strong growth driven by increasing demand for nutritious, convenient food options.
- Diverse fruit pulp varieties cater to changing consumer preferences across the food and beverage industry.
- Technological advancements in fruit processing are enhancing product quality and consistency.
- Regulatory support is fostering improved agricultural practices and food safety standards.
- Competitive market landscape encourages innovation and product diversification.
Evaluation of Restraints in Kenya Fruit Pulp Market
The Kenya fruit pulp market faces several constraints that may hinder its growth trajectory. Primarily, supply chain management remains a significant challenge, often exacerbated by seasonal fluctuations in fruit availability. This inconsistency can impact the supply of raw materials, leading to potential production delays. Additionally, maintaining stringent quality control during processing and transportation is crucial, as any lapses can affect product integrity and consumer trust. Addressing these issues through enhanced logistical networks and quality assurance protocols will be essential for manufacturers aiming to meet rising consumer expectations.
Kenya Fruit Pulp Market Trends
Current trends within the Kenya fruit pulp market indicate a marked shift towards health-conscious consumption patterns. Consumers are increasingly gravitating towards products made from natural ingredients, with an emphasis on organic options. Moreover, the popularity of fruit-based beverages and desserts is surging, leading to greater experimentation with flavors and combinations. Technological advancements in food processing are further shaping the landscape, enabling manufacturers to create innovative products that meet consumer demands for quality and authenticity.
Kenya Fruit Pulp Market Opportunities
Opportunities abound in the Kenya fruit pulp market, particularly for businesses that can tap into the rising trend of health-focused products. Investment in innovative processing technologies presents a chance to improve product quality and reduce waste. Additionally, expanding distribution channels, including e-commerce platforms, offers a pathway to reach a broader consumer base. Companies that align their offerings with local tastes and preferences while maintaining high-quality standards are well-positioned for success in this growing market.
Government Initiatives in the Kenya Fruit Pulp Market
Government policies are playing a pivotal role in shaping the Kenya fruit pulp market, focusing on enhancing agricultural production and food safety. Initiatives aimed at providing support for local farmers help ensure a steady supply of quality fruits for pulp production. Moreover, regulatory agencies are working to establish quality standards that facilitate market access, thereby boosting export competitiveness. These measures not only enhance the domestic market but also strengthen the position of Kenyan fruit pulp on the international stage.
Future Insights of the Kenya Fruit Pulp Market
As we look towards the future, the Kenya fruit pulp market is poised for continued growth. The increasing integration of technology in food processing and a greater emphasis on sustainability will drive innovation. Furthermore, consumer preferences will likely shift towards more diverse and authentic flavors, creating ample room for product differentiation. Manufacturers that are agile and responsive to these changes will thrive, setting the stage for a vibrant and evolving market landscape from 2026 to 2032.
Kenya Fruit Pulp Market Latest Developments (2025 - 2026)
The Kenya fruit pulp market is currently witnessing significant developments, with various stakeholders focusing on improving production efficiency and product quality. Innovative processing techniques are being adopted to enhance flavor retention and nutritional value. Additionally, collaborations among industry players aim to establish stronger supply chain networks, addressing some of the constraints previously noted. This dynamic environment suggests an adaptive market, ready to capitalize on emerging trends and consumer demands.
Kenya Fruit Pulp Market - Key Attractiveness of the Report
- 10 Years of Market Numbers
- Historical Data Starting from 2022 to 2025
- Base Year: 2025
- Forecast Data until 2032
- Key Performance Indicators Impacting the Market
- Major Upcoming Developments and Projects
Key Highlights of the Report:
- Kenya Fruit Pulp Market Outlook
- Market Size of Kenya Fruit Pulp Market, 2025
- Forecast of Kenya Fruit Pulp Market, 2032
- Historical Data and Forecast of Kenya Fruit Pulp Revenues & Volume for the Period 2022-2032F
- Kenya Fruit Pulp Market Trend Evolution
- Kenya Fruit Pulp Market Drivers and Challenges
- Kenya Fruit Pulp Price Trends
- Kenya Fruit Pulp Porter's Five Forces
- Kenya Fruit Pulp Industry Life Cycle
- Historical Data and Forecast of Kenya Fruit Pulp Market Revenues & Volume By Fruit Type for the Period 2022-2032F
- Historical Data and Forecast of Kenya Fruit Pulp Market Revenues & Volume By Mango for the Period 2022-2032F
- Historical Data and Forecast of Kenya Fruit Pulp Market Revenues & Volume By Strawberry for the Period 2022-2032F
- Historical Data and Forecast of Kenya Fruit Pulp Market Revenues & Volume By Apple for the Period 2022-2032F
- Historical Data and Forecast of Kenya Fruit Pulp Market Revenues & Volume By Guava for the Period 2022-2032F
- Historical Data and Forecast of Kenya Fruit Pulp Market Revenues & Volume By Berries for the Period 2022-2032F
- Historical Data and Forecast of Kenya Fruit Pulp Market Revenues & Volume By Citrus Fruits for the Period 2022-2032F
- Historical Data and Forecast of Kenya Fruit Pulp Market Revenues & Volume By Others for the Period 2022-2032F
- Historical Data and Forecast of Kenya Fruit Pulp Market Revenues & Volume By Form for the Period 2022-2032F
- Historical Data and Forecast of Kenya Fruit Pulp Market Revenues & Volume By Liquid for the Period 2022-2032F
- Historical Data and Forecast of Kenya Fruit Pulp Market Revenues & Volume By Powder for the Period 2022-2032F
- Historical Data and Forecast of Kenya Fruit Pulp Market Revenues & Volume By Application for the Period 2022-2032F
- Historical Data and Forecast of Kenya Fruit Pulp Market Revenues & Volume By Food and Beverages for the Period 2022-2032F
- Historical Data and Forecast of Kenya Fruit Pulp Market Revenues & Volume By Distribution for the Period 2022-2032F
- Historical Data and Forecast of Kenya Fruit Pulp Market Revenues & Volume By E-Commerce for the Period 2022-2032F
- Historical Data and Forecast of Kenya Fruit Pulp Market Revenues & Volume By Convenience Stores for the Period 2022-2032F
- Historical Data and Forecast of Kenya Fruit Pulp Market Revenues & Volume By Supermarkets/Hypermarkets for the Period 2022-2032F
- Historical Data and Forecast of Kenya Fruit Pulp Market Revenues & Volume By Specialty Stores for the Period 2022-2032F
- Historical Data and Forecast of Kenya Fruit Pulp Market Revenues & Volume By Others for the Period 2022-2032F
- Kenya Fruit Pulp Import Export Trade Statistics
- Market Opportunity Assessment By Fruit Type
- Market Opportunity Assessment By Form
- Market Opportunity Assessment By Application
- Market Opportunity Assessment By Distribution
- Kenya Fruit Pulp Top Companies Market Share
- Kenya Fruit Pulp Competitive Benchmarking By Technical and Operational Parameters
- Kenya Fruit Pulp Company Profiles
- Kenya Fruit Pulp Key Strategic Recommendations
Frequently Asked Questions About the Market Study (FAQs):
The Kenya Fruit Pulp Market is projected to grow at a CAGR of 4.8% from 2026 to 2032, reaching USD 250 Million by 2032.
The market features a variety of fruit pulps, with mango, pineapple, passion fruit, and guava being particularly popular among consumers and manufacturers.
Advancements in fruit processing technologies are enhancing the quality, consistency, and flavor retention of fruit pulps, thereby boosting their appeal in the food and beverage sector.
Producers grapple with supply chain challenges, including seasonal fluctuations and quality assurance during transportation, impacting overall product availability and consistency.
Government initiatives focus on promoting agricultural production, enhancing food safety standards, and facilitating market access, significantly benefiting fruit pulp producers.
There is a growing consumer preference for natural, healthy food options, which is driving demand for fruit-based products, particularly in beverages and snacks.
6Wresearch actively monitors the Kenya Fruit Pulp Market and publishes its comprehensive annual report, highlighting emerging trends, growth drivers, revenue analysis, and forecast outlook. Our insights help businesses to make data-backed strategic decisions with ongoing market dynamics. Our analysts track relevent industries related to the Kenya Fruit Pulp Market, allowing our clients with actionable intelligence and reliable forecasts tailored to emerging regional needs.
Yes, we provide customisation as per your requirements. To learn more, feel free to contact us on sales@6wresearch.com
1 Executive Summary |
2 Introduction |
2.1 Key Highlights of the Report |
2.2 Report Description |
2.3 Market Scope & Segmentation |
2.4 Research Methodology |
2.5 Assumptions |
3 Kenya Fruit Pulp Market Overview |
3.1 Kenya Country Macro Economic Indicators |
3.2 Kenya Fruit Pulp Market Revenues & Volume, 2022 & 2032F |
3.3 Kenya Fruit Pulp Market - Industry Life Cycle |
3.4 Kenya Fruit Pulp Market - Porter's Five Forces |
3.5 Kenya Fruit Pulp Market Revenues & Volume Share, By Fruit Type, 2022 & 2032F |
3.6 Kenya Fruit Pulp Market Revenues & Volume Share, By Form, 2022 & 2032F |
3.7 Kenya Fruit Pulp Market Revenues & Volume Share, By Application, 2022 & 2032F |
3.8 Kenya Fruit Pulp Market Revenues & Volume Share, By Distribution, 2022 & 2032F |
4 Kenya Fruit Pulp Market Dynamics |
4.1 Impact Analysis |
4.2 Market Drivers |
4.2.1 Increasing consumer awareness about the health benefits of fruit pulp consumption |
4.2.2 Growing demand for natural and organic food products |
4.2.3 Expansion of the food processing industry in Kenya |
4.3 Market Restraints |
4.3.1 Seasonal availability and perishability of fresh fruits |
4.3.2 Fluctuating prices of fruits impacting the cost of fruit pulp production |
4.3.3 Lack of proper infrastructure for cold storage and transportation |
5 Kenya Fruit Pulp Market Trends |
6 Kenya Fruit Pulp Market, By Types |
6.1 Kenya Fruit Pulp Market, By Fruit Type |
6.1.1 Overview and Analysis |
6.1.2 Kenya Fruit Pulp Market Revenues & Volume, By Fruit Type, 2022-2032F |
6.1.3 Kenya Fruit Pulp Market Revenues & Volume, By Mango, 2022-2032F |
6.1.4 Kenya Fruit Pulp Market Revenues & Volume, By Strawberry, 2022-2032F |
6.1.5 Kenya Fruit Pulp Market Revenues & Volume, By Apple, 2022-2032F |
6.1.6 Kenya Fruit Pulp Market Revenues & Volume, By Guava, 2022-2032F |
6.1.7 Kenya Fruit Pulp Market Revenues & Volume, By Berries, 2022-2032F |
6.1.8 Kenya Fruit Pulp Market Revenues & Volume, By Citrus Fruits, 2022-2032F |
6.2 Kenya Fruit Pulp Market, By Form |
6.2.1 Overview and Analysis |
6.2.2 Kenya Fruit Pulp Market Revenues & Volume, By Liquid, 2022-2032F |
6.2.3 Kenya Fruit Pulp Market Revenues & Volume, By Powder, 2022-2032F |
6.3 Kenya Fruit Pulp Market, By Application |
6.3.1 Overview and Analysis |
6.3.2 Kenya Fruit Pulp Market Revenues & Volume, By Food and Beverages, 2022-2032F |
6.4 Kenya Fruit Pulp Market, By Distribution |
6.4.1 Overview and Analysis |
6.4.2 Kenya Fruit Pulp Market Revenues & Volume, By E-Commerce, 2022-2032F |
6.4.3 Kenya Fruit Pulp Market Revenues & Volume, By Convenience Stores, 2022-2032F |
6.4.4 Kenya Fruit Pulp Market Revenues & Volume, By Supermarkets/Hypermarkets, 2022-2032F |
6.4.5 Kenya Fruit Pulp Market Revenues & Volume, By Specialty Stores, 2022-2032F |
6.4.6 Kenya Fruit Pulp Market Revenues & Volume, By Others, 2022-2032F |
7 Kenya Fruit Pulp Market Import-Export Trade Statistics |
7.1 Kenya Fruit Pulp Market Export to Major Countries |
7.2 Kenya Fruit Pulp Market Imports from Major Countries |
8 Kenya Fruit Pulp Market Key Performance Indicators |
8.1 Percentage of market penetration in urban vs. rural areas |
8.2 Rate of new product development and innovation in the fruit pulp market |
8.3 Number of partnerships and collaborations with fruit farmers for sourcing raw materials |
9 Kenya Fruit Pulp Market - Opportunity Assessment |
9.1 Kenya Fruit Pulp Market Opportunity Assessment, By Fruit Type, 2022 & 2032F |
9.2 Kenya Fruit Pulp Market Opportunity Assessment, By Form, 2022 & 2032F |
9.3 Kenya Fruit Pulp Market Opportunity Assessment, By Application, 2022 & 2032F |
9.4 Kenya Fruit Pulp Market Opportunity Assessment, By Distribution, 2022 & 2032F |
10 Kenya Fruit Pulp Market - Competitive Landscape |
10.1 Kenya Fruit Pulp Market Revenue Share, By Companies, 2025 |
10.2 Kenya Fruit Pulp Market Competitive Benchmarking, By Operating and Technical Parameters |
11 Company Profiles |
12 Recommendations |
13 Disclaimer |
Global Go To Market Strategy - 2030
Export potential enables firms to identify high-growth global markets with greater confidence by combining advanced trade intelligence with a structured quantitative methodology. The framework analyzes emerging demand trends and country-level import patterns while integrating macroeconomic and trade datasets such as GDP and population forecasts, bilateral import–export flows, tariff structures, elasticity differentials between developed and developing economies, geographic distance, and import demand projections. Using weighted trade values from 2020–2024 as the base period to project country-to-country export potential for 2030, these inputs are operationalized through calculated drivers such as gravity model parameters, tariff impact factors, and projected GDP per-capita growth. Through an analysis of hidden potentials, demand hotspots, and market conditions that are most favorable to success, this method enables firms to focus on target countries, maximize returns, and global expansion with data, backed by accuracy.
By factoring in the projected importer demand gap that is currently unmet and could be potential opportunity, it identifies the potential for the Exporter (Country) among 190 countries, against the general trade analysis, which identifies the biggest importer or exporter.
To discover high-growth global markets and optimize your business strategy:
Click Here
Pricing
- Single User License$ 1,995
- Department License$ 2,400
- Site License$ 3,120
- Global License$ 3,795

Leadership Perspectives from Industry Events
Search
Thought Leadership and Analyst Meet


Our Clients
6WResearch In News
- India Air Conditioner Market Set for Strong Rebound in 2026 After Weather-Led Correction and GST-Driven Recovery: 6Wresearch
- ADAS in India: How Automatic Emergency Braking, Blind Spot Detection & Driver Monitoring are Transforming Road Safety
- Doha a strategic location for EV manufacturing hub: IPA Qatar
- Demand for luxury TVs surging in the GCC, says Samsung
- Empowering Growth: The Thriving Journey of Bangladesh’s Cable Industry
- Demand for luxury TVs surging in the GCC, says Samsung
Latest Reports
- Nicaragua RPG Gaming Market (2026-2032)
- New Zealand RPG Gaming Market (2026-2032)
- Netherlands RPG Gaming Market (2026-2032)
- Nauru RPG Gaming Market (2026-2032)
- Namibia RPG Gaming Market (2026-2032)
- Mozambique RPG Gaming Market (2026-2032)
- Montenegro RPG Gaming Market (2026-2032)
- Mongolia RPG Gaming Market (2026-2032)
- Monaco RPG Gaming Market (2026-2032)
- Micronesia RPG Gaming Market (2026-2032)
Industry Events and Analyst Meet

EV India Expo 2026

HIMTEX 2026

India Refining Summit 2026

India EV Show 2026

EV tech India Expo 2026
Whitepaper
- Middle East & Africa Commercial Security Market Click here to view more.
- Middle East & Africa Fire Safety Systems & Equipment Market Click here to view more.
- GCC Drone Market Click here to view more.
- Middle East Lighting Fixture Market Click here to view more.
- GCC Physical & Perimeter Security Market Click here to view more.