Kenya Malt Market | Revenue, Size, Companies, Share, Value, Forecast, Trends, Industry, COVID-19 IMPACT, Growth & Analysis
Market Forecast By Type (Malt, Malt Extract, Malt Extract Powder, Malt Flour, Barley malt, Wheat malt, Rye malt), By Application (Beer Industry, Whisky Distilleries, Food industry, Beverages, Pharmaceutical industry) And Competitive Landscape
| Product Code: ETC179109 | Publication Date: Jan 2022 | Updated Date: Aug 2025 | Product Type: Market Research Report | |
| Publisher: 6Wresearch | Author: Ravi Bhandari | No. of Pages: 70 | No. of Figures: 35 | No. of Tables: 5 |
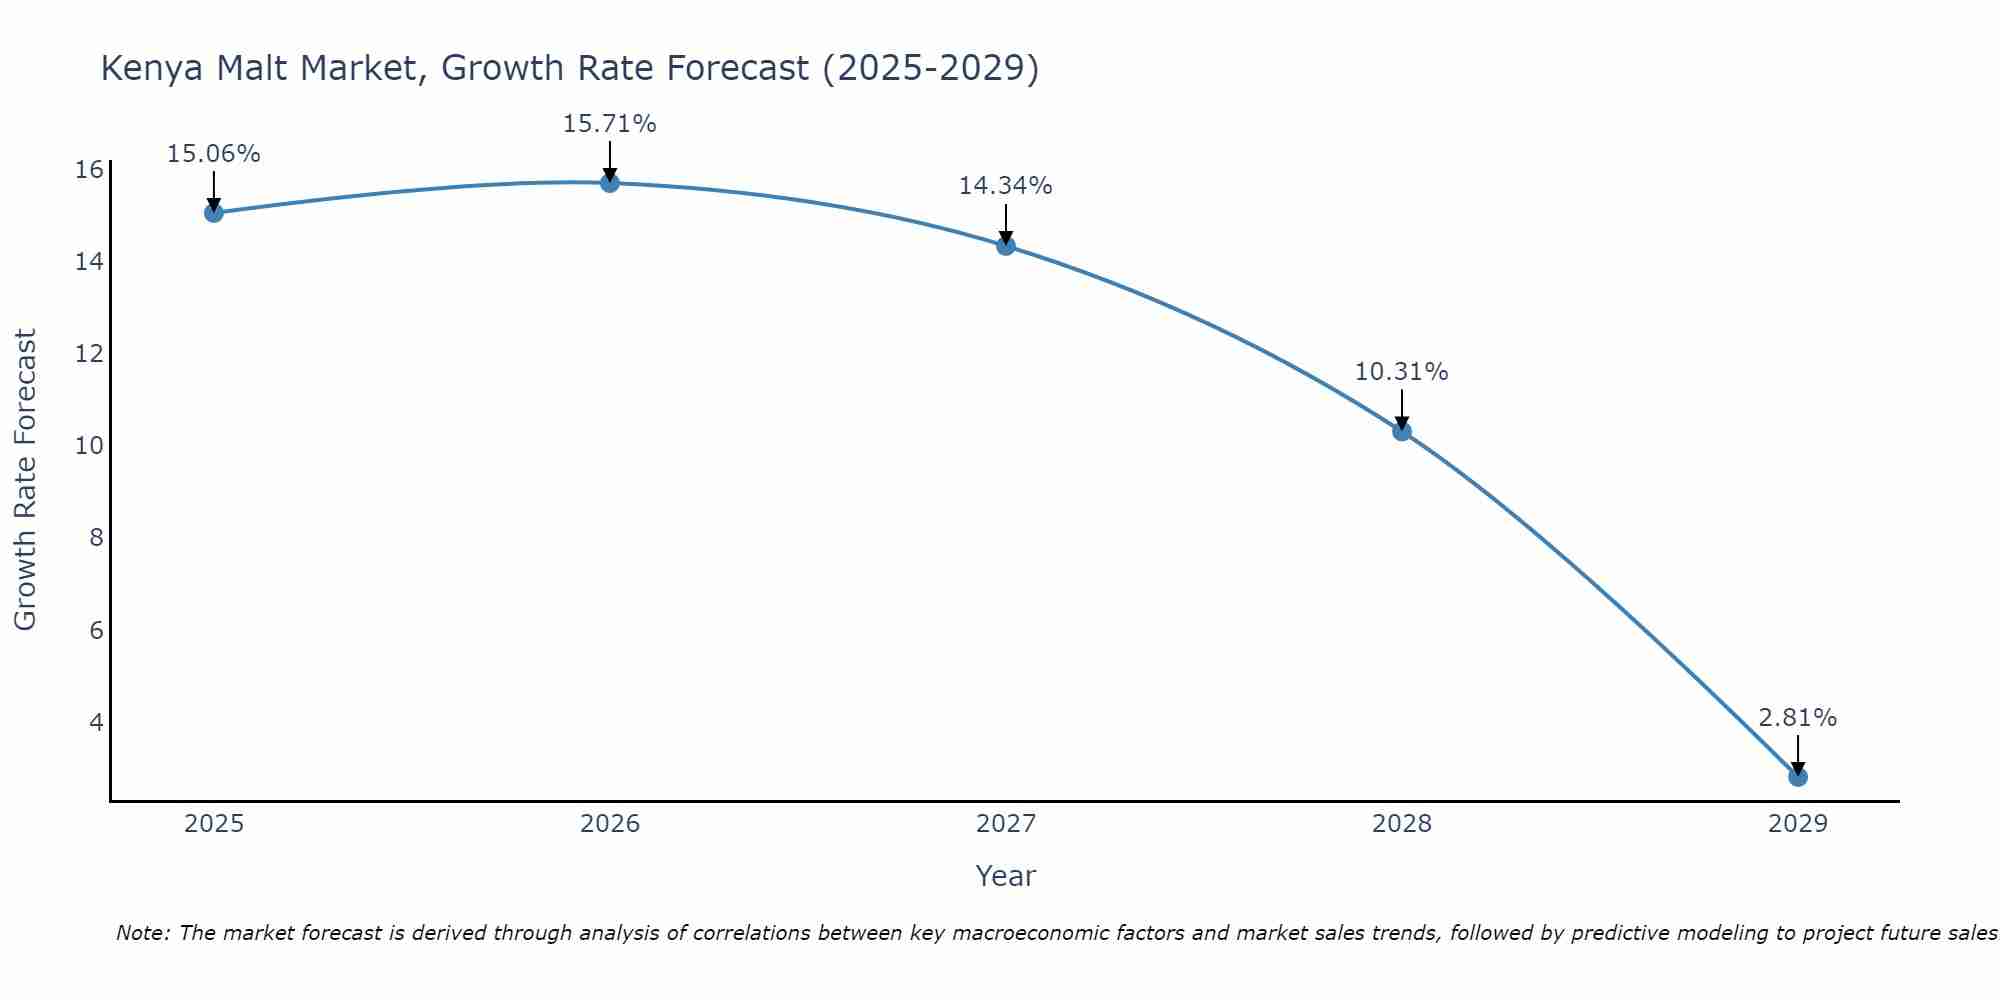
Kenya Malt Market Size Growth Rate
The Kenya Malt Market is projected to witness mixed growth rate patterns during 2025 to 2029. The growth rate begins at 15.06% in 2025, climbs to a high of 15.71% in 2026, and moderates to 2.81% by 2029.
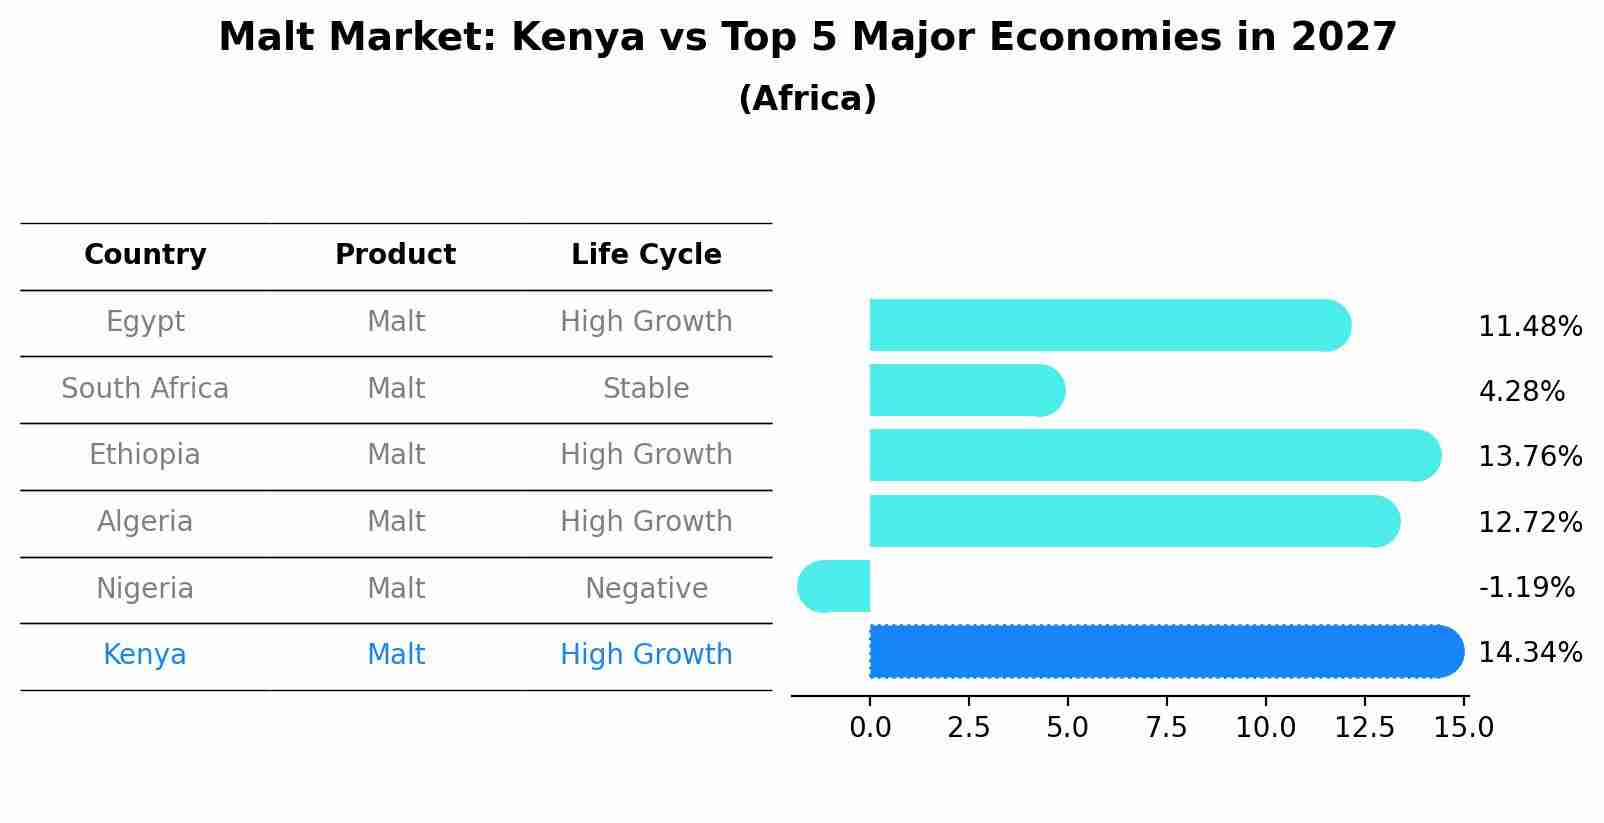
Malt Market: Kenya vs Top 5 Major Economies in 2027 (Africa)
The Malt market in Kenya is projected to grow at a high growth rate of 14.34% by 2027, highlighting the country's increasing focus on advanced technologies within the Africa region, where Egypt holds the dominant position, followed closely by South Africa, Ethiopia, Algeria and Nigeria, shaping overall regional demand.
Kenya Malt Market Overview
The Malt Market in Kenya serves the brewing and food industries. Malt, a key ingredient in beer production, also finds uses in food processing. Market growth is driven by the expanding beverage industry and the increasing popularity of malt-based products.
Drivers of the market
The malt market in Kenya is influenced by the brewing and distilling industries, where malted barley and other grains are used as key ingredients for producing beer, whiskey, and other alcoholic beverages, as well as in food manufacturing for flavor and texture enhancement.
Challenges of the market
The Malt Market in Kenya faces challenges related to the availability and cost of raw materials, as well as the complexities of the malting process. There is significant competition from alternative ingredients used in brewing and food production, which affects market demand. Regulatory compliance with food safety and quality standards adds to the complexity of market operations. The market requires substantial investment in technology and infrastructure to enhance production efficiency and meet quality standards. Additionally, there is a need for continuous innovation and research to develop new malt products and applications.
Government Policy of the market
The Kenya malt market faces challenges related to supply chain disruptions and quality consistency. Market players encounter difficulties in sourcing barley malt and maintaining consistent quality standards due to variations in crop yields and processing techniques. Additionally, addressing pricing pressures and competition from alternative brewing adjuncts poses hurdles for market expansion.
Key Highlights of the Report:
- Kenya Malt Market Outlook
- Market Size of Kenya Malt Market, 2021
- Forecast of Kenya Malt Market, 2028
- Historical Data and Forecast of Kenya Malt Revenues & Volume for the Period 2018 - 2028
- Kenya Malt Market Trend Evolution
- Kenya Malt Market Drivers and Challenges
- Kenya Malt Price Trends
- Kenya Malt Porter's Five Forces
- Kenya Malt Industry Life Cycle
- Historical Data and Forecast of Kenya Malt Market Revenues & Volume By Type for the Period 2018 - 2028
- Historical Data and Forecast of Kenya Malt Market Revenues & Volume By Malt for the Period 2018 - 2028
- Historical Data and Forecast of Kenya Malt Market Revenues & Volume By Malt Extract for the Period 2018 - 2028
- Historical Data and Forecast of Kenya Malt Market Revenues & Volume By Malt Extract Powder for the Period 2018 - 2028
- Historical Data and Forecast of Kenya Malt Market Revenues & Volume By Malt Flour for the Period 2018 - 2028
- Historical Data and Forecast of Kenya Malt Market Revenues & Volume By Barley malt for the Period 2018 - 2028
- Historical Data and Forecast of Kenya Malt Market Revenues & Volume By Wheat malt for the Period 2018 - 2028
- Historical Data and Forecast of Kenya Malt Market Revenues & Volume By Rye malt for the Period 2018 - 2028
- Historical Data and Forecast of Kenya Malt Market Revenues & Volume By Application for the Period 2018 - 2028
- Historical Data and Forecast of Kenya Malt Market Revenues & Volume By Beer Industry for the Period 2018 - 2028
- Historical Data and Forecast of Kenya Malt Market Revenues & Volume By Whisky Distilleries for the Period 2018 - 2028
- Historical Data and Forecast of Kenya Malt Market Revenues & Volume By Food industry for the Period 2018 - 2028
- Historical Data and Forecast of Kenya Malt Market Revenues & Volume By Beverages for the Period 2018 - 2028
- Historical Data and Forecast of Kenya Malt Market Revenues & Volume By Pharmaceutical industry for the Period 2018 - 2028
- Kenya Malt Import Export Trade Statistics
- Market Opportunity Assessment By Type
- Market Opportunity Assessment By Application
- Kenya Malt Top Companies Market Share
- Kenya Malt Competitive Benchmarking By Technical and Operational Parameters
- Kenya Malt Company Profiles
- Kenya Malt Key Strategic Recommendations
Frequently Asked Questions About the Market Study (FAQs):
6Wresearch actively monitors the Kenya Malt Market and publishes its comprehensive annual report, highlighting emerging trends, growth drivers, revenue analysis, and forecast outlook. Our insights help businesses to make data-backed strategic decisions with ongoing market dynamics. Our analysts track relevent industries related to the Kenya Malt Market, allowing our clients with actionable intelligence and reliable forecasts tailored to emerging regional needs.
Yes, we provide customisation as per your requirements. To learn more, feel free to contact us on sales@6wresearch.com
1 Executive Summary |
2 Introduction |
2.1 Key Highlights of the Report |
2.2 Report Description |
2.3 Market Scope & Segmentation |
2.4 Research Methodology |
2.5 Assumptions |
3 Kenya Malt Market Overview |
3.1 Kenya Country Macro Economic Indicators |
3.2 Kenya Malt Market Revenues & Volume, 2021 & 2028F |
3.3 Kenya Malt Market - Industry Life Cycle |
3.4 Kenya Malt Market - Porter's Five Forces |
3.5 Kenya Malt Market Revenues & Volume Share, By Type, 2021 & 2028F |
3.6 Kenya Malt Market Revenues & Volume Share, By Application, 2021 & 2028F |
4 Kenya Malt Market Dynamics |
4.1 Impact Analysis |
4.2 Market Drivers |
4.2.1 Increasing consumer awareness about health benefits of malt-based products |
4.2.2 Growth in disposable income leading to higher spending on premium malt beverages |
4.2.3 Rising popularity of craft malt beverages among young consumers in Kenya |
4.3 Market Restraints |
4.3.1 High competition from other non-alcoholic beverages like juices and soft drinks |
4.3.2 Fluctuating prices of raw materials impacting production costs |
5 Kenya Malt Market Trends |
6 Kenya Malt Market, By Types |
6.1 Kenya Malt Market, By Type |
6.1.1 Overview and Analysis |
6.1.2 Kenya Malt Market Revenues & Volume, By Type, 2018 - 2028F |
6.1.3 Kenya Malt Market Revenues & Volume, By Malt, 2018 - 2028F |
6.1.4 Kenya Malt Market Revenues & Volume, By Malt Extract, 2018 - 2028F |
6.1.5 Kenya Malt Market Revenues & Volume, By Malt Extract Powder, 2018 - 2028F |
6.1.6 Kenya Malt Market Revenues & Volume, By Malt Flour, 2018 - 2028F |
6.1.7 Kenya Malt Market Revenues & Volume, By Barley malt, 2018 - 2028F |
6.1.8 Kenya Malt Market Revenues & Volume, By Wheat malt, 2018 - 2028F |
6.2 Kenya Malt Market, By Application |
6.2.1 Overview and Analysis |
6.2.2 Kenya Malt Market Revenues & Volume, By Beer Industry , 2018 - 2028F |
6.2.3 Kenya Malt Market Revenues & Volume, By Whisky Distilleries, 2018 - 2028F |
6.2.4 Kenya Malt Market Revenues & Volume, By Food industry , 2018 - 2028F |
6.2.5 Kenya Malt Market Revenues & Volume, By Beverages , 2018 - 2028F |
6.2.6 Kenya Malt Market Revenues & Volume, By Pharmaceutical industry, 2018 - 2028F |
7 Kenya Malt Market Import-Export Trade Statistics |
7.1 Kenya Malt Market Export to Major Countries |
7.2 Kenya Malt Market Imports from Major Countries |
8 Kenya Malt Market Key Performance Indicators |
8.1 Number of new malt-based products launched in the market |
8.2 Growth in online and offline distribution channels for malt beverages |
8.3 Percentage increase in consumer engagement on social media platforms for malt brands |
9 Kenya Malt Market - Opportunity Assessment |
9.1 Kenya Malt Market Opportunity Assessment, By Type, 2021 & 2028F |
9.2 Kenya Malt Market Opportunity Assessment, By Application, 2021 & 2028F |
10 Kenya Malt Market - Competitive Landscape |
10.1 Kenya Malt Market Revenue Share, By Companies, 2021 |
10.2 Kenya Malt Market Competitive Benchmarking, By Operating and Technical Parameters |
11 Company Profiles |
12 Recommendations |
13 Disclaimer |
Global Go To Market Strategy - 2030
Export potential enables firms to identify high-growth global markets with greater confidence by combining advanced trade intelligence with a structured quantitative methodology. The framework analyzes emerging demand trends and country-level import patterns while integrating macroeconomic and trade datasets such as GDP and population forecasts, bilateral import–export flows, tariff structures, elasticity differentials between developed and developing economies, geographic distance, and import demand projections. Using weighted trade values from 2020–2024 as the base period to project country-to-country export potential for 2030, these inputs are operationalized through calculated drivers such as gravity model parameters, tariff impact factors, and projected GDP per-capita growth. Through an analysis of hidden potentials, demand hotspots, and market conditions that are most favorable to success, this method enables firms to focus on target countries, maximize returns, and global expansion with data, backed by accuracy.
By factoring in the projected importer demand gap that is currently unmet and could be potential opportunity, it identifies the potential for the Exporter (Country) among 190 countries, against the general trade analysis, which identifies the biggest importer or exporter.
To discover high-growth global markets and optimize your business strategy:
Click Here
Pricing
- Single User License$ 1,995
- Department License$ 2,400
- Site License$ 3,120
- Global License$ 3,795

Leadership Perspectives from Industry Events
Search
Thought Leadership and Analyst Meet


Our Clients
6WResearch In News
- India Export Attractiveness Tracker 2026
- India Air Conditioner Market Set for Strong Rebound in 2026 After Weather-Led Correction and GST-Driven Recovery: 6Wresearch
- ADAS in India: How Automatic Emergency Braking, Blind Spot Detection & Driver Monitoring are Transforming Road Safety
- Doha a strategic location for EV manufacturing hub: IPA Qatar
- Demand for luxury TVs surging in the GCC, says Samsung
- Empowering Growth: The Thriving Journey of Bangladesh’s Cable Industry
Latest Reports
- Nicaragua RPG Gaming Market (2026-2032)
- New Zealand RPG Gaming Market (2026-2032)
- Netherlands RPG Gaming Market (2026-2032)
- Nauru RPG Gaming Market (2026-2032)
- Namibia RPG Gaming Market (2026-2032)
- Mozambique RPG Gaming Market (2026-2032)
- Montenegro RPG Gaming Market (2026-2032)
- Mongolia RPG Gaming Market (2026-2032)
- Monaco RPG Gaming Market (2026-2032)
- Micronesia RPG Gaming Market (2026-2032)
Industry Events and Analyst Meet

EV India Expo 2026

HIMTEX 2026

India Refining Summit 2026

India EV Show 2026

EV tech India Expo 2026
Whitepaper
- Middle East & Africa Commercial Security Market Click here to view more.
- Middle East & Africa Fire Safety Systems & Equipment Market Click here to view more.
- GCC Drone Market Click here to view more.
- Middle East Lighting Fixture Market Click here to view more.
- GCC Physical & Perimeter Security Market Click here to view more.