Kenya Milk Market (2026-2032) | Share, Segmentation, Companies, Value, Outlook, Growth, Trends, Industry, Forecast, Size & Revenue, Analysis, Competitive Landscape
Market Forecast By Product Type (Fresh Milk, UHT Milk, Powdered Milk, Yoghurt, Cheese, Others), By Distribution Channels (Modern Trade (Supermarkets/Hypermarkets), General Trade (Local Dukas/Milk ATMs), Institutional (Schools/Hotels) and Export Markets), By Price Positioning (Premium, Mid-Range, Economy), By Packaging Format (Bulk/Loose Milk, Pouched Milk, Cartons (Tetra Pak), Bottles), By Market Structure (Formal Market, Informal Market), By End User (Household Consumers, Foodservice/HORECA, Institutional Buyers, Industrial/B2B Users) And Competitive Landscape
| Product Code: ETC7807523 | Publication Date: Sep 2024 | Updated Date: Mar 2026 | Product Type: Market Research Report | |
| Publisher: 6Wresearch | Author: Summon Dutta | No. of Pages: 90 | No. of Figures: 25 | No. of Tables: 11 |
Topics Covered in Kenya Milk Market Report
Kenya Milk Market Report thoroughly covers the market by Product Type, by Distribution Channel by Price Positioning, by Packaging Format, by Market Structure and by End User. Kenya Milk Market Outlook report provides an unbiased and detailed analysis of the ongoing Kenya Milk Market trends, opportunities/high growth areas, and market drivers. This would help stakeholders devise and align their market strategies according to the current and future market dynamics.
Kenya Milk Market Synopsis
The Kenya milk market has experienced robust growth between 2022 and 2025, driven by strong demographic momentum and a structural shift toward formal sector consumption. The country’s population, expanded significantly, creating sustained baseline demand for dairy products. This is reflected in formal milk intake, which increased massively between 2020 and 2024, with a notable year-on-year surge between 2023 and 2024. By 2024, total milk production hit massively in litres, reinforcing Kenya’s leading position in Africa’s dairy sector. This growth was further supported by the expansion of organized retail, local and international supermarket chains like Naivas, Quick Mart, and Carrefour expanded their combined outlets, increasing shelf space and cold-chain availability for packaged and value-added dairy products, particularly in high-income urban hubs like Nairobi.
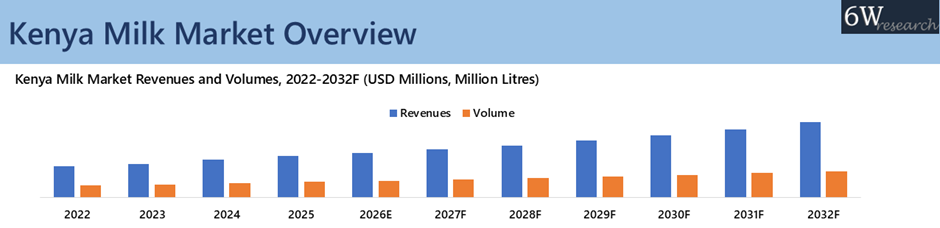
According to 6Wresearch, the Kenya Milk Market size is projected to grow at a CAGR of 9.2% and 7.9% in terms of revenues and volume respectively during 2026–2032. This future growth is expected to be supported by ongoing government-backed formalization initiatives, value-added processing expansion, and rising demand from adjacent food service sectors. Programs such as the "More Milk 2" initiative and the School Milk Programme Expansion are strengthening farmer market linkages, improving milk quality and safety, and creating institutional demand.
Simultaneously, the rapid growth of online food delivery projected to increase by 2027 is boosting demand for milk-based ingredients like butter and cream from bakeries and ready-to-eat food producers. These combined structural drivers are enhancing supply stability, encouraging private sector investment in processing capacity, and positioning the market for sustained long-term growth as the sector continues its transition from informal to organized channels.
Market Segmentation By Product Type
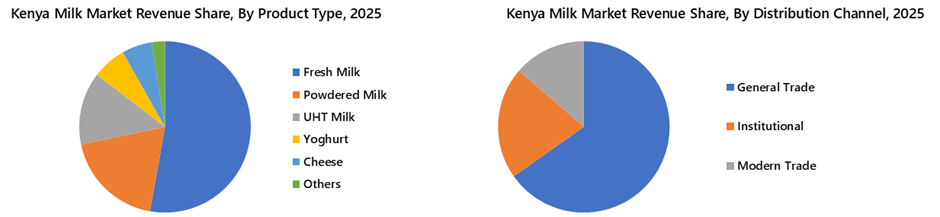
Yoghurt is poised to capture the highest CAGR in both revenue and market share within Kenya’s milk market from 2026 to 2032. The expanding retail footprint and the growing penetration of online food delivery platforms projected to grow by 2027 are enhancing yoghurt’s visibility and accessibility across urban areas. With increasing consumer demand for value-added, healthy dairy products, these factors position yoghurt as a dominant force, driving substantial growth in both volume and revenue.
Market Segmentation By Distribution Channel
Institutional and Export Markets are expected to experience the highest growth in Kenya's milk market from 2026 to 2032, fueled by expanding government-backed school nutrition programs and growing regional trade within East Africa. Additionally, the expanding bakery and foodservice sectors are boosting demand for milk, butter, and cream.
Market Segmentation By Price Positioning
The Mid-Range segment is expected to experience the highest growth in Kenya's milk market from 2026 to 2032, driven by rapid urbanization and a growing middle-income population shifting from economy to branded dairy products. With urbanization projected to reach at least half by 2030 and modern retail chains expanding, consumers increasingly prefer affordable branded milk and yogurt over loose alternatives. This segment benefits from the balance between affordability and premium quality, positioning it as a key driver of Kenya's formalization and rising disposable incomes.
Market Segmentation By Packaging Format
Cartons (Tetra Pak) are expected to see the highest growth in Kenya's milk market from 2026 to 2032, driven by accelerated formalization and expanding modern retail penetration. With supermarkets growing and modern trade increasing annually, demand for shelf-stable, hygienically packaged UHT milk and value-added dairy is rising. Additionally, growing health awareness and the rise of online food delivery are reinforcing consumer preference for Tetra Pak's convenience, extended shelf life, and food safety benefits.
Market Segmentation By Market Structure
The Formal Market is poised for the highest growth in Kenya’s milk sector from 2026 to 2032, fueled by expanding formalization efforts and government-backed dairy programs. With a large volume of milk still sold unprocessed annually, formal intake is set to surpass a set number of milk volume, driven by initiatives like the School Milk Programme and More Milk 2. Additionally, enhanced regional export integration through the African Continental Free Trade Area is accelerating formal market expansion, making this segment the key growth driver as Kenya’s dairy sector transitions from informal to structured, value-added commercialization.
Market Segmentation By End User
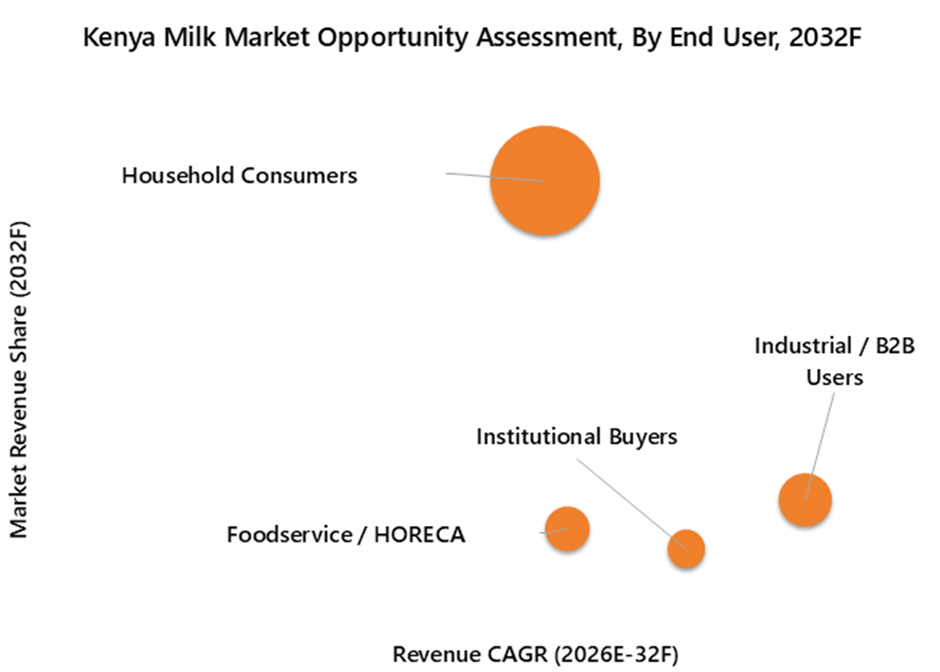
Industrial/B2B Users are set to experience the highest growth in Kenya’s milk market from 2026 to 2032, driven by expanding food processing, bakery, and confectionery sectors that require bulk dairy ingredients. With the bakery industry growing and online food delivery segment projected to grow by 2027, demand for butter, cream, milk powder, and ghee is rising rapidly. This B2B channel benefits from processor consolidation and regional export opportunities under the African Continental Free Trade Area, positioning it as the fastest-growing end-user segment.
Key Attractiveness of the Report
- 10 Years Market Numbers.
- Historical Data Starting from 2022 to 2025
- Base Year: 2025
- Forecast Data until 2032
- Key Performance Indicators Impacting the Market.
- Major Upcoming Developments and Projects.
Key Highlights of the Report:
- Kenya Milk Market Overview
- Kenya Milk Market Outlook
- Kenya Milk Market Forecast
- Historical Data and Forecast of Kenya Milk Market Revenues for the Period 2022-2032F
- Historical Data and Forecast of Kenya Milk Market Revenues, By Product Type, for the Period 2022-2032F
- Historical Data and Forecast of Kenya Milk Market Revenues, By Distribution Channels, for the Period 2022-2032F
- Historical Data and Forecast of Kenya Milk Market Revenues, By Price Positioning, for the Period 2022-2032F
- Historical Data and Forecast of Kenya Milk Market Revenues, By Packaging Format, for the Period 2022-2032F
- Historical Data and Forecast of Kenya Milk Market Revenues, By Market Structure, for the Period 2022-2032F
- Historical Data and Forecast of Kenya Milk Market Revenues, By End User, for the Period 2022-2032F
- Kenya Dairy Consumption & Per-Capita Consumption
- Kenya Milk Production Volumes and Regional Production Hotspots
- Industry Life Cycle
- Porter’s Five Force Analysis
- Kenya Milk Market Drivers and Restraints
Market Scope and Segmentation
The report provides a detailed analysis of the following market segments:
By Product Type
- Fresh Milk
- UHT Milk
- Powdered Milk
- Yoghurt
- Cheese
- Others
By Distribution Channels
- Modern Trade (Supermarkets/Hypermarkets)
- General Trade (Local Dukas/Milk ATMs)
- Institutional (Schools/Hotels) and Export Markets
By Price Positioning
- Premium
- Mid-Range
- Economy
- By Packaging Format
- Bulk / Loose Milk
- Pouched Milk
- Cartons (Tetra Pak)
- Bottles
By Market Structure
- Formal Market
- Informal Market
By End User
- Household Consumers
- Foodservice / HORECA
- Institutional Buyers
- Industrial / B2B Users
Kenya Milk Market (2026-2032): FAQs
Kenya Milk Market is projected to grow at a CAGR of 7.9% from 2026-2032F.
Increasing population growth and government-supported nutrition programs are driving the growth of market.
The market faces restraints due to climate volatility and weak infrastructure.
Kenya Milk Market Report thoroughly covers the market by Product Type, by Distribution Channel by Price Positioning, by Packaging Format, by Market Structure and by End User.
6Wresearch actively monitors the Kenya Milk Market and publishes its comprehensive annual report, highlighting emerging trends, growth drivers, revenue analysis, and forecast outlook. Our insights help businesses to make data-backed strategic decisions with ongoing market dynamics. Our analysts track relevent industries related to the Kenya Milk Market, allowing our clients with actionable intelligence and reliable forecasts tailored to emerging regional needs.
Yes, we provide customisation as per your requirements. To learn more, feel free to contact us on sales@6wresearch.com
| 1. Executive Summary |
| 2. Introduction |
| 2.1. Report Description |
| 2.2. Key Highlights of the Report |
| 2.3. Market Scope & Segmentation |
| 2.4. Research Methodology |
| 2.5. Assumptions |
| 3. Global Milk Market Overview |
| 3.1. Global Milk Market Revenues, 2022-2032F |
| 4. Kenya Milk Market Overview |
| 4.1. Kenya Macroeconomic Indicators |
| 4.2. Kenya Milk Market Revenues and Volume, 2022-2032F |
| 4.3. Kenya Milk Market Industry Life Cycle |
| 4.4. Kenya Milk Market Porter's Five Forces |
| 5. Kenya Milk Market Dynamics |
| 5.1. Impact Analysis |
| 5.2. Market Drivers |
| 5.3. Market Restraints |
| 6. Kenya Milk Market Trends And Evolution |
| 7. Kenya Milk Market Overview, By Product Type |
| 7.1 Kenya Milk Market Revenue Share and Revenues, By Product Type , 2025 & 2032F |
| 7.1.1. Kenya Milk Market Revenues and Revenue Share, By Fresh Milk, 2022-2032F |
| 7.1.2. Kenya Milk Market Revenues and Revenue Share, By UHT Milk, 2022-2032F |
| 7.1.3. Kenya Milk Market Revenues and Revenue Share, By Powdered Milk, 2022-2032F |
| 7.1.4. Kenya Milk Market Revenues and Revenue Share, By Yogurt, 2022-2032F |
| 7.1.5. Kenya Milk Market Revenues and Revenue Share, By Cheese, 2022-2032F |
| 7.1.6. Kenya Milk Market Revenues and Revenue Share, By Others, 2022-2032F |
| 7.2 Kenya Milk Market Volume Share and Volumes, By Product Type , 2025 & 2032F |
| 7.2.1. Kenya Milk Market Volumes and Volume Share, By Fresh Milk, 2022-2032F |
| 7.2.2. Kenya Milk Market Volumes and Volume Share, By UHT Milk, 2022-2032F |
| 7.2.3. Kenya Milk Market Volumes and Volume Share, By Powdered Milk, 2022-2032F |
| 7.2.4. Kenya Milk Market Volumes and Volume Share, By Yoghurt, 2022-2032F |
| 7.2.5. Kenya Milk Market Volumes and Volume Share, By Cheese, 2022-2032F |
| 7.2.6. Kenya Milk Market Volumes and Volume Share, By Others, 2022-2032F |
| 8. Kenya Milk Market Overview, By Distribution Channel |
| 8.1 Kenya Milk Market Revenue and Revenue Share, By Distribution Channel, 2025 & 2032F |
| 8.1.1. Kenya Milk Market Revenues, By Modern Trade (Supermarkets/Hypermarkets), 2025 & 2032F |
| 8.1.2. Kenya Milk Market Revenues, By General Trade (Local Dukas/Milk ATMs), 2025 & 2032F |
| 8.1.3. Kenya Milk Market Revenues, By Institutional (Schools/Hotels) and Export Markets, 2025 & 2032F |
| 9. Kenya Milk Market Overview, By Price Positioning |
| 9.1 Kenya Milk Market Revenue and Revenue Share, By Price Positioning, 2025 & 2032F |
| 9.1.1. Kenya Milk Market Revenues, By Premium, 2025 & 2032F |
| 9.1.2. Kenya Milk Market Revenues, By Mid-Range, 2025 & 2032F |
| 9.1.3. Kenya Milk Market Revenues, By Economy, 2025 & 2032F |
| 10. Kenya Milk Market Overview, By Packaging Format |
| 10.1 Kenya Milk Market Revenue and Revenue Share, By Packaging Format, 2025 & 2032F |
| 10.1.1. Kenya Milk Market Revenues, By Bulk / Loose Milk, 2025 & 2032F |
| 10.1.2. Kenya Milk Market Revenues, By Pouched Milk, 2025 & 2032F |
| 10.1.3. Kenya Milk Market Revenues, By Cartons (Tetra Pak), 2025 & 2032F |
| 10.1.4. Kenya Milk Market Revenues, By Bottles, 2025 & 2032F |
| 11. Kenya Milk Market Overview, By Market Structure |
| 11.1 Kenya Milk Market Revenue and Revenue Share, By Market Structure, 2025 & 2032F |
| 11.1.1. Kenya Milk Market Revenues, By Formal Market, 2025 & 2032F |
| 11.1.2. Kenya Milk Market Revenues, By Informal Market, 2025 & 2032F |
| 12. Kenya Milk Market Overview, By End User |
| 12.1 Kenya Milk Market Revenue and Revenue Share, By End User, 2025 & 2032F |
| 12.1.1. Kenya Milk Market Revenues, By Household Consumers, 2025 & 2032F |
| 12.1.2. Kenya Milk Market Revenues, By Foodservice / HORECA, 2025 & 2032F |
| 12.1.3. Kenya Milk Market Revenues, By Institutional Buyers, 2025 & 2032F |
| 12.1.4. Kenya Milk Market Revenues, By Industrial / B2B Users, 2025 & 2032F |
| 13. Kenya Milk Market Key Performance Indicators |
| 14. Kenya Milk Market Opportunity Assessment |
| 14.1. Kenya Milk Market Opportunity Assessment, By Product Type, 2032F |
| 14.2. Kenya Milk Market Opportunity Assessment, By Distribution Channel, 2032F |
| 14.3. Kenya Milk Market Opportunity Assessment, By Price Positioning, 2032F |
| 14.4. Kenya Milk Market Opportunity Assessment, By Packaging Format, 2032F |
| 14.5. Kenya Milk Market Opportunity Assessment, By Market Structure, 2032F |
| 14.6. Kenya Milk Market Opportunity Assessment, By End User, 2032F |
| 15. Country Dairy Consumption & Per-Capita Consumption |
| 16. National Milk Production Volumes and Regional Production Hotspots |
| 17. Kenya Milk Market Competitive Landscape |
| 17.1. Kenya Milk Market Revenue Ranking/Share, By Top 3 Companies, CY 2025 |
| 17.2. Kenya Milk Market Competitive Benchmarking, By Technical Parameters |
| 17.3. Kenya Milk Market Competitive Benchmarking, By Operating Parameters |
| 18. Company Profiles |
| 18.1 Brookside Dairy Ltd. |
| 18.2 New Kenya Co-Operative Creameries Ltd |
| 18.3 Githunguri Dairy Farmers Co-Operative Society Ltd.) |
| 18.4 Meru Central Dairy Co-operative Union Ltd |
| 18.5 Kinangop Dairy Limited |
| 18.6 Bio Food Products Limited |
| 18.7 Ol Kalou Dairy Co-operative Society Ltd |
| 18.8 Lakeside Dairy Ltd. |
| 18.9 Lato Milk |
| 18.10 Milfresh Dairy Limited |
| 19. Key Strategic Recommendations |
| 20. Disclaimer |
| List of Figures |
| 1. Global Milk Market Revenues, 2022-2032F (US$ Billion) |
| 2. Kenya Milk Market Revenues and Volume, 2022-2032F (US$ Million, Million Litres) |
| 3. Kenya Milk Consumption Growth (2024–2027F) – In Million Litres |
| 4. Kenya YoY Population Growth (2023–2030F) – In Million |
| 5. Kenya Milk Market Revenue Share, By Type, 2025 & 2032F |
| 6. Kenya Milk Market Revenue Share, By Type, 2025 & 2032F |
| 7. Kenya Milk Market Revenue Share, By Distribution Channels, 2025 & 2032F |
| 8. Kenya Milk Market Revenue Share, By Price Positioning, 2025 & 2032F |
| 9. Kenya Milk Market Revenue Share, By Packaging Format , 2025 & 2032F |
| 10. Kenya Milk Market Revenue Share, By Market Structure , 2025 & 2032F |
| 11. Kenya Milk Market Revenue Share, By End User, 2025 & 2032F |
| 12. Percentage Growth of Online Food Platform Customers in Kenya 2023 & 2027 |
| 13. Usage of Online Food Delivery Platform in Kenya 2024 |
| 14. Kenya Milk Market Opportunity Assessment, By Product Type-Revenue Outlook, 2032F |
| 15. Kenya Milk Market Opportunity Assessment, By Product Type-Volume Outlook, 2032F |
| 16. Kenya Milk Market Opportunity Assessment, By Distribution Channels, 2032F |
| 17. Kenya Milk Market Opportunity Assessment, By Price Positioning, 2032F |
| 18. Kenya Milk Market Opportunity Assessment, By Packaging Format, 2032F |
| 19. Kenya Milk Market Opportunity Assessment, By Market Structure, 2032F |
| 20. Kenya Milk Market Opportunity Assessment, By End User, 2032F |
| 21. Kenya Per-Capita Milk Consumption Trend, 2022-2024 (In Litres) |
| 22. Kenya Milk Production Volumes over the years |
| 23. Kenya Milk Production by Region |
| 24. Kenya Milk Market Revenue Ranking, By Companies, CY2025 |
| 25. Kenya Formal Milk Consumption (2022-2024) (in Millions Litres) |
| List of Table |
| 1. Key Dairy Development and Nutritional Initiatives in Kenya |
| 2. Kenya Milk Market Revenues, By Type, 2022-2032F (USD Millions) |
| 3. Kenya Milk Market Volumes, By Type, 2022-2032F (Million Litres) |
| 4. Kenya Milk Market Revenues, By Distribution Channels, 2022-2032F (USD Millions) |
| 5. Kenya Milk Market Revenues, By Price Positioning, 2022-2032F (USD Millions) |
| 6. Kenya Milk Market Revenues, By Packaging Format , 2022-2032F (USD Millions) |
| 7. Kenya Milk Market Revenues, By Market Structure , 2022-2032F (USD Millions) |
| 8. Kenya Milk Market Revenues, By End User, 2022-2032F (USD Millions) |
| 9. Kenya Major Retail Supermarket Chains from 2021-2024 |
| 10. Kenya Production of Dairy Products by Category |
| 11. Kenya’s Annual Per-Capita Milk Consumption |
Global Go To Market Strategy - 2030
Export potential enables firms to identify high-growth global markets with greater confidence by combining advanced trade intelligence with a structured quantitative methodology. The framework analyzes emerging demand trends and country-level import patterns while integrating macroeconomic and trade datasets such as GDP and population forecasts, bilateral import–export flows, tariff structures, elasticity differentials between developed and developing economies, geographic distance, and import demand projections. Using weighted trade values from 2020–2024 as the base period to project country-to-country export potential for 2030, these inputs are operationalized through calculated drivers such as gravity model parameters, tariff impact factors, and projected GDP per-capita growth. Through an analysis of hidden potentials, demand hotspots, and market conditions that are most favorable to success, this method enables firms to focus on target countries, maximize returns, and global expansion with data, backed by accuracy.
By factoring in the projected importer demand gap that is currently unmet and could be potential opportunity, it identifies the potential for the Exporter (Country) among 190 countries, against the general trade analysis, which identifies the biggest importer or exporter.
To discover high-growth global markets and optimize your business strategy:
Click Here
Pricing
- Single User License$ 1,995
- Department License$ 2,400
- Site License$ 3,120
- Global License$ 3,795

Leadership Perspectives from Industry Events
Search
Thought Leadership and Analyst Meet


Our Clients
6WResearch In News
- Doha a strategic location for EV manufacturing hub: IPA Qatar
- Demand for luxury TVs surging in the GCC, says Samsung
- Empowering Growth: The Thriving Journey of Bangladesh’s Cable Industry
- Demand for luxury TVs surging in the GCC, says Samsung
- Video call with a traditional healer? Once unthinkable, it’s now common in South Africa
- Intelligent Buildings To Smooth GCC’s Path To Net Zero
Latest Reports
- Cape Verde Portable Hand-Thrown Extinguisher Market (2026-2032)
- Canada Portable Hand-Thrown Extinguisher Market (2026-2032)
- Cameroon Portable Hand-Thrown Extinguisher Market (2026-2032)
- Burundi Portable Hand-Thrown Extinguisher Market (2026-2032)
- Burkina Faso Portable Hand-Thrown Extinguisher Market (2026-2032)
- Bulgaria Portable Hand-Thrown Extinguisher Market (2026-2032)
- Brunei Portable Hand-Thrown Extinguisher Market (2026-2032)
- Botswana Portable Hand-Thrown Extinguisher Market (2026-2032)
- Bosnia and Herzegovina Portable Hand-Thrown Extinguisher Market (2026-2032)
- Bolivia Portable Hand-Thrown Extinguisher Market (2026-2032)
Industry Events and Analyst Meet

HIMTEX 2026

India Refining Summit 2026

India EV Show 2026

EV tech India Expo 2026

Auto Tech Asia 2026
Whitepaper
- Middle East & Africa Commercial Security Market Click here to view more.
- Middle East & Africa Fire Safety Systems & Equipment Market Click here to view more.
- GCC Drone Market Click here to view more.
- Middle East Lighting Fixture Market Click here to view more.
- GCC Physical & Perimeter Security Market Click here to view more.