Kenya Printed Electronics Market (2026-2032) Outlook | Companies, Trends, Size, Forecast, Revenue, Value, Share, Industry, Growth, Analysis
Market Forecast By Material (Ink, Substrate), By Technology (Screen, Inkjet, Flexographic, Gravure), By Device (Displays, Photovoltaic, Lighting, RFID, Others) And Competitive Landscape
| Product Code: ETC255110 | Publication Date: Aug 2022 | Updated Date: Jul 2026 | Product Type: Market Research Report | |
| Publisher: 6Wresearch | Author: Ravi Bhandari | No. of Pages: 75 | No. of Figures: 35 | No. of Tables: 20 |
Kenya Printed Electronics Market Size, Share & Growth Rate
The Kenya Printed Electronics Market was estimated at USD 446 Million in 2025 and is projected to reach USD 608 Million by 2032, growing at a CAGR of 4.5% from 2026 to 2032. This growth trajectory is primarily fueled by the increasing demand for lightweight and flexible electronic solutions, particularly in wearable and smart device applications. As various industries embrace the Internet of Things (IoT), the integration of printed electronics within these innovations becomes more significant, highlighting a need for advanced printing technologies and methods.
Kenya Printed Electronics Market Year-wise Growth Rate and Key Drivers
This graph highlights how the Kenya Printed Electronics Market has steadily grown over the years, supported by major growth factors.
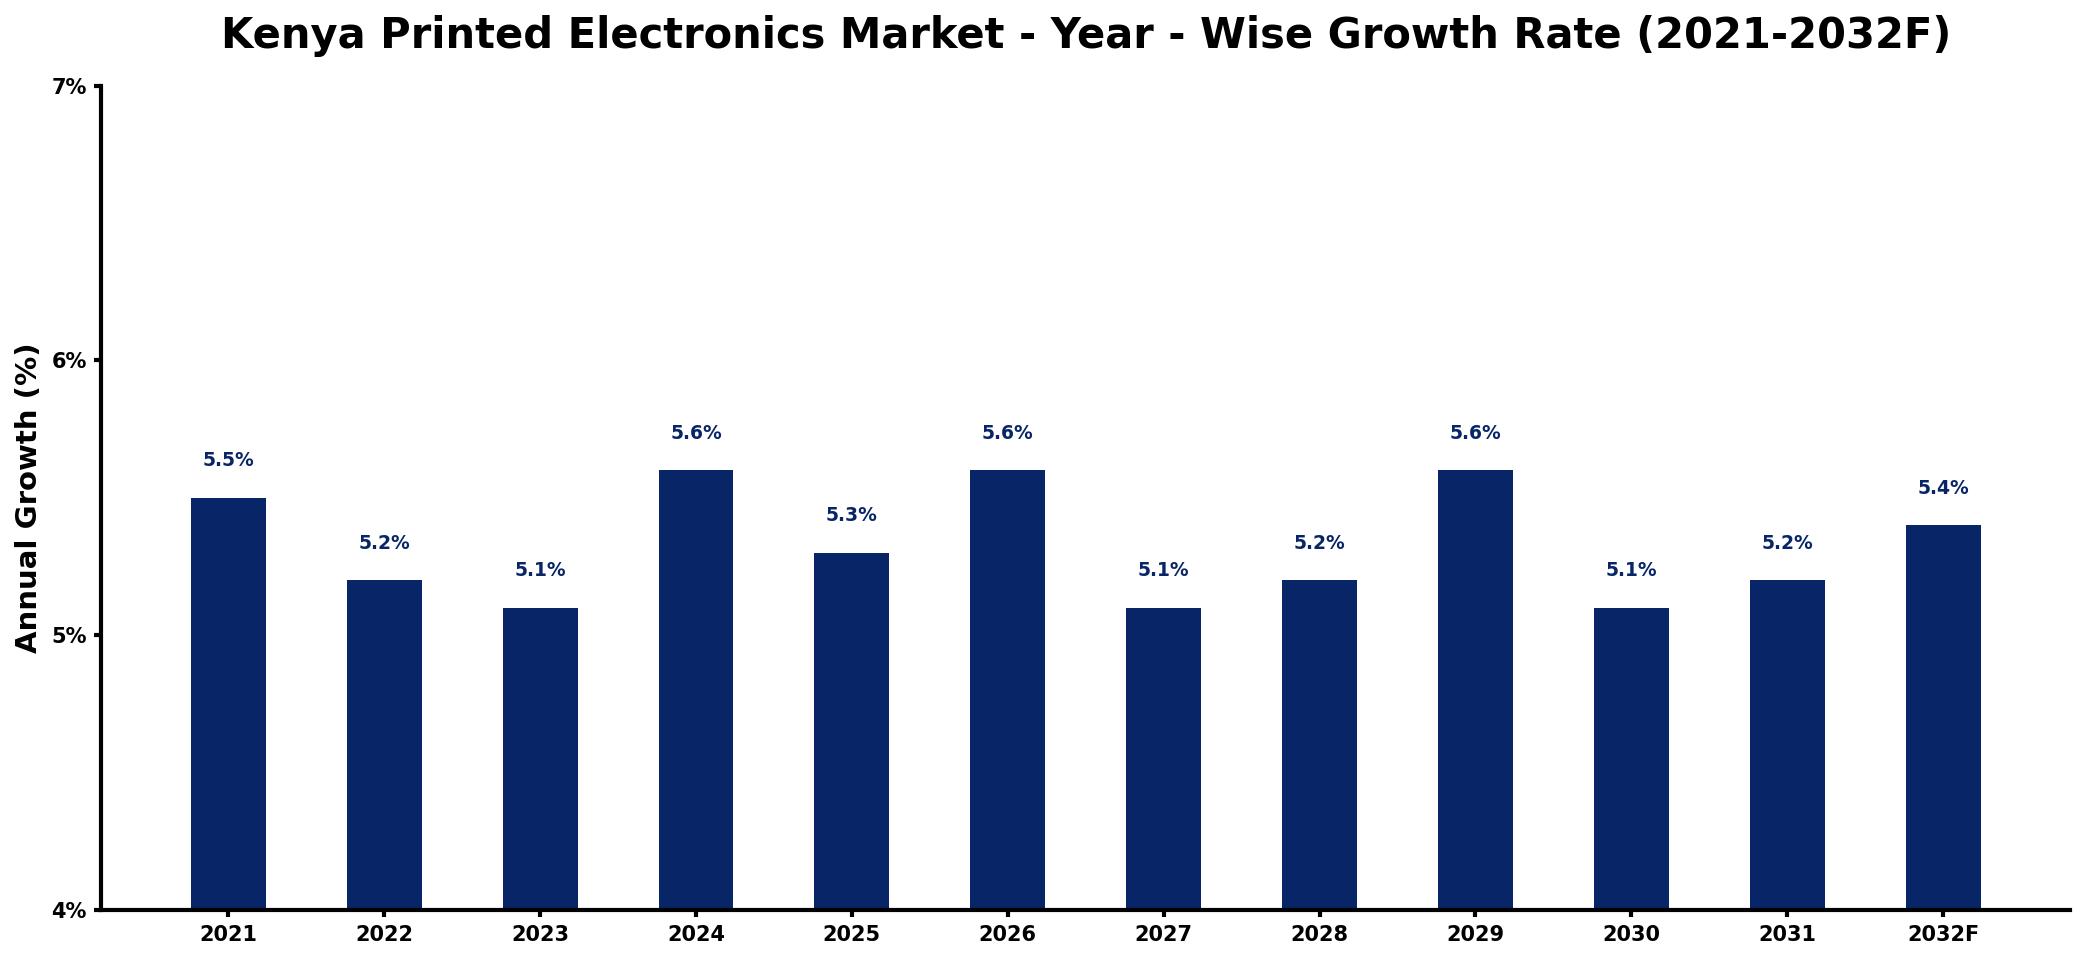
The table below presents the year‑wise growth rates along with the key drivers influencing the market
| Year | Growth Rate | Major Drivers |
| 2021 | 5.5% | Rising demand for smart packaging |
| 2022 | 5.2% | Increased investment in innovation |
| 2023 | 5.1% | Growth in wearable technology applications |
| 2024 | 5.6% | Expansion of renewable energy solutions |
| 2025 | 5.3% | expanding industrial usage applications |
| 2026 | 5.6% | Development of new manufacturing techniques |
| 2027 | 5.1% | Emergence of healthcare monitoring systems |
| 2028 | 5.2% | Boost in sustainable product initiatives |
| 2029 | 5.6% | rising end-use demand growth |
| 2030 | 5.1% | increased pharmaceutical industry usage |
| 2031 | 5.2% | Increase in educational technology funding |
| 2032 | 5.4% | Rising interest in agricultural technology |
Note: Market size estimations and growth projections presented in this report are based on 6Wresearch's proprietary forecasting methodology, utilizing the latest available industry data, government publications, and primary research inputs.
Kenya Printed Electronics Market Synopsis
In Kenya, the push towards smart devices and innovative electronics has created a burgeoning market for printed electronics. The demand for RFID tags and printed sensors has surged, fostering collaboration between technology developers and manufacturers to create efficient electronic solutions.
Furthermore, with the growing interest in sustainable and cost-effective manufacturing processes, the printed electronics sector is seeing substantial investments and innovations. This dynamic environment positions Kenya as a noteworthy player in the printed electronics landscape across Africa.
Kenya Printed Electronics Market Key Takeaways
- The market is bolstered by the rising adoption of flexible electronics in various applications.
- Innovations in printing technology are critical to enhance production scalability and efficiency.
- Government initiatives and policies are increasingly supporting technological advancements in the sector.
- The integration of printed electronics with IoT devices is expected to drive future market growth.
- Material compatibility and regulatory compliance continue to present challenges for market players.
Evaluation of Restraints in Kenya Printed Electronics Market
While the Kenya printed electronics market is ripe with opportunities, it faces notable restraints that hinder its growth potential. The scalability of production remains a critical concern, particularly as manufacturers strive to meet the increasing demand without compromising on durability and performance. Furthermore, issues related to material compatibility and adherence to regulatory standards create complexities that need to be addressed effectively. The interplay of these factors often slows down innovation and hinders the market's ability to fully capitalize on emerging trends.
Kenya Printed Electronics Market Trends
Several key trends are shaping the Kenya printed electronics market, with sustainability at the forefront. Companies are focusing on eco-friendly materials and processes, aligning with global trends towards reducing carbon footprints. Additionally, the rise of IoT continues to influence demand, as printed sensors and circuits become integral components in smart devices. Notably, advancements in conductive inks and printing techniques promise to enhance performance and reliability, paving the way for broader adoption across various sectors.
Kenya Printed Electronics Market Opportunities
Genuine growth and investment opportunities in the Kenya printed electronics market lie in enhancing the capabilities of printing technologies. As demand for wearable technology and smart devices escalates, there is a growing need for innovation in materials and processes. Collaborations between research institutions and industry players can foster breakthroughs in product development, enabling the mass production of high-quality printed electronics. Moreover, tapping into the regional markets for electronic solutions could further amplify growth potential.
Government Initiatives in the Kenya Printed Electronics Market
The Kenyan government has recognized the importance of the printed electronics market and is actively promoting initiatives aimed at technological advancement. Policies encouraging investment in R&D for new materials and printing methods are being fostered. Additionally, public spending on technology infrastructure supports the ecosystem needed for scaling printed electronics production, ultimately facilitating integration into broader industrial applications.
Future Insights of the Kenya Printed Electronics Market
Looking ahead to the period from 2026 to 2032, the Kenya printed electronics market is poised for substantial evolution. As technology continues to advance, we can expect greater integration of printed solutions across various sectors, particularly in healthcare, automotive, and consumer electronics. The demand for smarter, more efficient devices will drive innovations that improve product longevity and performance. By overcoming current barriers, the market has the potential to flourish, positioning Kenya as a regional leader in printed electronics.
Kenya Printed Electronics Market Latest Developments (2025 - 2026)
Recent developments in the Kenya printed electronics market highlight a surge in collaborative projects between private and public sectors, aimed at advancing local production capabilities. Industry events have showcased innovations in flexible electronics, and significant strides are being made in material science to improve the performance of printed components. Regulatory frameworks are also being updated to support new technologies, indicating a supportive environment for market growth.
Kenya Printed Electronics Market - Key Attractiveness of the Report
- 10 Years of Market Numbers
- Historical Data Starting from 2022 to 2025
- Base Year: 2025
- Forecast Data until 2032
- Key Performance Indicators Impacting the Market
- Major Upcoming Developments and Projects
Key Highlights of the Report:
- Kenya Printed Electronics Market Outlook
- Market Size of Kenya Printed Electronics Market, 2025
- Forecast of Kenya Printed Electronics Market, 2032
- Historical Data and Forecast of Kenya Printed Electronics Revenues & Volume for the Period 2022-2032F
- Kenya Printed Electronics Market Trend Evolution
- Kenya Printed Electronics Market Drivers and Challenges
- Kenya Printed Electronics Price Trends
- Kenya Printed Electronics Porter's Five Forces
- Kenya Printed Electronics Industry Life Cycle
- Historical Data and Forecast of Kenya Printed Electronics Market Revenues & Volume By Material for the Period 2022-2032F
- Historical Data and Forecast of Kenya Printed Electronics Market Revenues & Volume By Ink for the Period 2022-2032F
- Historical Data and Forecast of Kenya Printed Electronics Market Revenues & Volume By Substrate for the Period 2022-2032F
- Historical Data and Forecast of Kenya Printed Electronics Market Revenues & Volume By Technology for the Period 2022-2032F
- Historical Data and Forecast of Kenya Printed Electronics Market Revenues & Volume By Screen for the Period 2022-2032F
- Historical Data and Forecast of Kenya Printed Electronics Market Revenues & Volume By Inkjet for the Period 2022-2032F
- Historical Data and Forecast of Kenya Printed Electronics Market Revenues & Volume By Flexographic for the Period 2022-2032F
- Historical Data and Forecast of Kenya Printed Electronics Market Revenues & Volume By Gravure for the Period 2022-2032F
- Historical Data and Forecast of Kenya Printed Electronics Market Revenues & Volume By Device for the Period 2022-2032F
- Historical Data and Forecast of Kenya Printed Electronics Market Revenues & Volume By Displays for the Period 2022-2032F
- Historical Data and Forecast of Kenya Printed Electronics Market Revenues & Volume By Photovoltaic for the Period 2022-2032F
- Historical Data and Forecast of Kenya Printed Electronics Market Revenues & Volume By Lighting for the Period 2022-2032F
- Historical Data and Forecast of Kenya Printed Electronics Market Revenues & Volume By RFID for the Period 2022-2032F
- Historical Data and Forecast of Kenya Printed Electronics Market Revenues & Volume By Others for the Period 2022-2032F
- Kenya Printed Electronics Import Export Trade Statistics
- Market Opportunity Assessment By Material
- Market Opportunity Assessment By Technology
- Market Opportunity Assessment By Device
- Kenya Printed Electronics Top Companies Market Share
- Kenya Printed Electronics Competitive Benchmarking By Technical and Operational Parameters
- Kenya Printed Electronics Company Profiles
- Kenya Printed Electronics Key Strategic Recommendations
Frequently Asked Questions About the Market Study (FAQs):
The market is expected to grow at a CAGR of 4.5% from 2026 to 2032, with estimates indicating a rise from USD 446 Million in 2025 to USD 608 Million by 2032.
The rise of IoT has been instrumental in driving the demand for printed electronics, particularly in the development of smart devices and sensors that enhance connectivity and functionality across various applications.
Notable applications include the integration of printed electronics in healthcare devices, wearables, and smart packaging, emphasizing the importance of lightweight and flexible solutions in modern technology.
Yes, the Kenyan government is actively promoting initiatives that foster investment in research and development, particularly in printing technologies, to enhance local production capabilities and market competitiveness.
Companies in the printed electronics market encounter challenges related to material compatibility, scalability, and performance reliability, which must be addressed to meet the increasing demand and expectations of the industry.
Kenya is emerging as a leader in the printed electronics sector within Africa, with a growing focus on innovation, investment, and partnerships that position it favorably against other regional markets.
6Wresearch actively monitors the Kenya Printed Electronics Market and publishes its comprehensive annual report, highlighting emerging trends, growth drivers, revenue analysis, and forecast outlook. Our insights help businesses to make data-backed strategic decisions with ongoing market dynamics. Our analysts track relevent industries related to the Kenya Printed Electronics Market, allowing our clients with actionable intelligence and reliable forecasts tailored to emerging regional needs.
Yes, we provide customisation as per your requirements. To learn more, feel free to contact us on sales@6wresearch.com
1 Executive Summary |
2 Introduction |
2.1 Key Highlights of the Report |
2.2 Report Description |
2.3 Market Scope & Segmentation |
2.4 Research Methodology |
2.5 Assumptions |
3 Kenya Printed Electronics Market Overview |
3.1 Kenya Country Macro Economic Indicators |
3.2 Kenya Printed Electronics Market Revenues & Volume, 2022 & 2032F |
3.3 Kenya Printed Electronics Market - Industry Life Cycle |
3.4 Kenya Printed Electronics Market - Porter's Five Forces |
3.5 Kenya Printed Electronics Market Revenues & Volume Share, By Material, 2022 & 2032F |
3.6 Kenya Printed Electronics Market Revenues & Volume Share, By Technology, 2022 & 2032F |
3.7 Kenya Printed Electronics Market Revenues & Volume Share, By Device, 2022 & 2032F |
4 Kenya Printed Electronics Market Dynamics |
4.1 Impact Analysis |
4.2 Market Drivers |
4.2.1 Increasing demand for flexible and lightweight electronic devices |
4.2.2 Technological advancements in printed electronics industry |
4.2.3 Rising adoption of Internet of Things (IoT) devices in Kenya |
4.3 Market Restraints |
4.3.1 High initial investment and setup costs for printed electronics manufacturing |
4.3.2 Limited availability of skilled labor and expertise in printed electronics technology in Kenya |
5 Kenya Printed Electronics Market Trends |
6 Kenya Printed Electronics Market, By Types |
6.1 Kenya Printed Electronics Market, By Material |
6.1.1 Overview and Analysis |
6.1.2 Kenya Printed Electronics Market Revenues & Volume, By Material, 2022-2032F |
6.1.3 Kenya Printed Electronics Market Revenues & Volume, By Ink, 2022-2032F |
6.1.4 Kenya Printed Electronics Market Revenues & Volume, By Substrate, 2022-2032F |
6.2 Kenya Printed Electronics Market, By Technology |
6.2.1 Overview and Analysis |
6.2.2 Kenya Printed Electronics Market Revenues & Volume, By Screen, 2022-2032F |
6.2.3 Kenya Printed Electronics Market Revenues & Volume, By Inkjet, 2022-2032F |
6.2.4 Kenya Printed Electronics Market Revenues & Volume, By Flexographic, 2022-2032F |
6.2.5 Kenya Printed Electronics Market Revenues & Volume, By Gravure, 2022-2032F |
6.3 Kenya Printed Electronics Market, By Device |
6.3.1 Overview and Analysis |
6.3.2 Kenya Printed Electronics Market Revenues & Volume, By Displays, 2022-2032F |
6.3.3 Kenya Printed Electronics Market Revenues & Volume, By Photovoltaic, 2022-2032F |
6.3.4 Kenya Printed Electronics Market Revenues & Volume, By Lighting, 2022-2032F |
6.3.5 Kenya Printed Electronics Market Revenues & Volume, By RFID, 2022-2032F |
6.3.6 Kenya Printed Electronics Market Revenues & Volume, By Others, 2022-2032F |
7 Kenya Printed Electronics Market Import-Export Trade Statistics |
7.1 Kenya Printed Electronics Market Export to Major Countries |
7.2 Kenya Printed Electronics Market Imports from Major Countries |
8 Kenya Printed Electronics Market Key Performance Indicators |
8.1 Research and development investment in printed electronics technology |
8.2 Number of partnerships and collaborations in the printed electronics industry in Kenya |
8.3 Adoption rate of printed electronics in key sectors such as healthcare, automotive, and consumer electronics in Kenya |
9 Kenya Printed Electronics Market - Opportunity Assessment |
9.1 Kenya Printed Electronics Market Opportunity Assessment, By Material, 2022 & 2032F |
9.2 Kenya Printed Electronics Market Opportunity Assessment, By Technology, 2022 & 2032F |
9.3 Kenya Printed Electronics Market Opportunity Assessment, By Device, 2022 & 2032F |
10 Kenya Printed Electronics Market - Competitive Landscape |
10.1 Kenya Printed Electronics Market Revenue Share, By Companies, 2025 |
10.2 Kenya Printed Electronics Market Competitive Benchmarking, By Operating and Technical Parameters |
11 Company Profiles |
12 Recommendations |
13 Disclaimer |
Global Go To Market Strategy - 2030
Export potential enables firms to identify high-growth global markets with greater confidence by combining advanced trade intelligence with a structured quantitative methodology. The framework analyzes emerging demand trends and country-level import patterns while integrating macroeconomic and trade datasets such as GDP and population forecasts, bilateral import–export flows, tariff structures, elasticity differentials between developed and developing economies, geographic distance, and import demand projections. Using weighted trade values from 2020–2024 as the base period to project country-to-country export potential for 2030, these inputs are operationalized through calculated drivers such as gravity model parameters, tariff impact factors, and projected GDP per-capita growth. Through an analysis of hidden potentials, demand hotspots, and market conditions that are most favorable to success, this method enables firms to focus on target countries, maximize returns, and global expansion with data, backed by accuracy.
By factoring in the projected importer demand gap that is currently unmet and could be potential opportunity, it identifies the potential for the Exporter (Country) among 190 countries, against the general trade analysis, which identifies the biggest importer or exporter.
To discover high-growth global markets and optimize your business strategy:
Click Here
Pricing
- Single User License$ 1,995
- Department License$ 2,400
- Site License$ 3,120
- Global License$ 3,795

Leadership Perspectives from Industry Events
Search
Thought Leadership and Analyst Meet


Our Clients
6WResearch In News
- India Export Attractiveness Tracker 2026
- India Air Conditioner Market Set for Strong Rebound in 2026 After Weather-Led Correction and GST-Driven Recovery: 6Wresearch
- ADAS in India: How Automatic Emergency Braking, Blind Spot Detection & Driver Monitoring are Transforming Road Safety
- Doha a strategic location for EV manufacturing hub: IPA Qatar
- Demand for luxury TVs surging in the GCC, says Samsung
- Empowering Growth: The Thriving Journey of Bangladesh’s Cable Industry
Latest Reports
- Nicaragua RPG Gaming Market (2026-2032)
- New Zealand RPG Gaming Market (2026-2032)
- Netherlands RPG Gaming Market (2026-2032)
- Nauru RPG Gaming Market (2026-2032)
- Namibia RPG Gaming Market (2026-2032)
- Mozambique RPG Gaming Market (2026-2032)
- Montenegro RPG Gaming Market (2026-2032)
- Mongolia RPG Gaming Market (2026-2032)
- Monaco RPG Gaming Market (2026-2032)
- Micronesia RPG Gaming Market (2026-2032)
Industry Events and Analyst Meet

EV India Expo 2026

HIMTEX 2026

India Refining Summit 2026

India EV Show 2026

EV tech India Expo 2026
Whitepaper
- Middle East & Africa Commercial Security Market Click here to view more.
- Middle East & Africa Fire Safety Systems & Equipment Market Click here to view more.
- GCC Drone Market Click here to view more.
- Middle East Lighting Fixture Market Click here to view more.
- GCC Physical & Perimeter Security Market Click here to view more.