Kenya Urea Formaldehyde Resins Market (2026-2032) Outlook | Value, Share, Companies, Growth, Forecast, Size, Revenue, Trends, Analysis & Industry
Market Forecast By Application (Particle Board, Wood Adhesives, Plywood, Medium Density Fiberboard, Other Applications), By End-user Industry (Automotive, Electrical Appliances, Agriculture, Building and Construction, Other End-user Industries) And Competitive Landscape
| Product Code: ETC235730 | Publication Date: Aug 2022 | Updated Date: Jul 2026 | Product Type: Market Research Report | |
| Publisher: 6Wresearch | Author: Ravi Bhandari | No. of Pages: 75 | No. of Figures: 35 | No. of Tables: 20 |
Kenya Urea Formaldehyde Resins Market Size, Share & Growth Rate
The Kenya Urea Formaldehyde Resins Market was estimated at USD 246 Million in 2025 and is projected to reach USD 320 Million by 2032, growing at a CAGR of 3.8% from 2026 to 2032. This growth is driven by escalating construction activities, particularly in the residential sector, and a burgeoning demand for cost-effective furniture solutions. As Kenyas economy expands, the need for high-performance engineered wood products continues to rise, further propelling the market forward.
Kenya Urea Formaldehyde Resins Market Year-wise Growth Rate and Key Drivers
This graph highlights how the Kenya Urea Formaldehyde Resins Market has steadily grown over the years, supported by major growth factors.
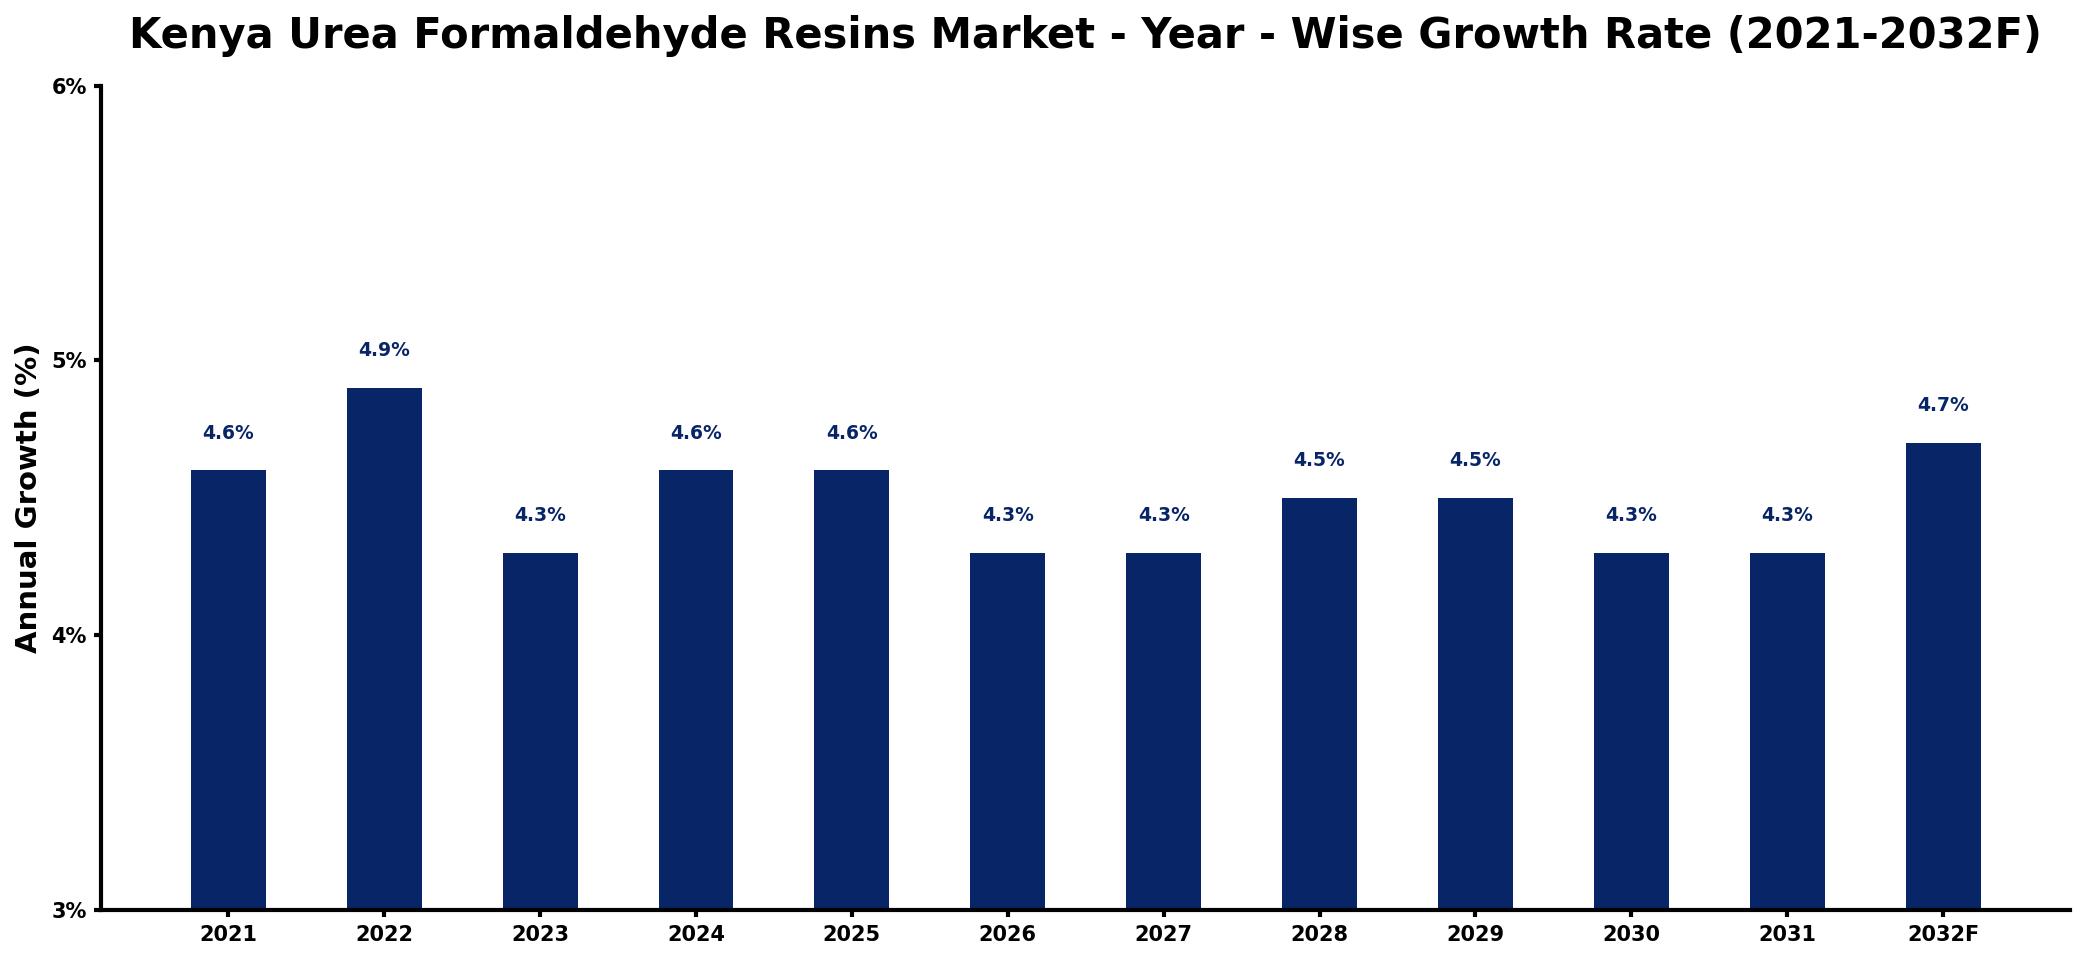
The table below presents the year‑wise growth rates along with the key drivers influencing the market
| Year | Growth Rate | Major Drivers |
| 2021 | 4.6% | Rising construction sector investments |
| 2022 | 4.9% | Increased demand from furniture industry |
| 2023 | 4.3% | Growth in packaging applications |
| 2024 | 4.6% | Expansion of automotive manufacturing |
| 2025 | 4.6% | Advancements in adhesive technologies |
| 2026 | 4.3% | Surge in consumer electronics production |
| 2027 | 4.3% | Boost in home renovation projects |
| 2028 | 4.5% | Development of sustainable building materials |
| 2029 | 4.5% | Rising exports to neighboring countries |
| 2030 | 4.3% | Increased government infrastructure projects |
| 2031 | 4.3% | strengthening underlying market demand |
| 2032 | 4.7% | Emerging trends in renewable energy |
Note: Market size estimations and growth projections presented in this report are based on 6Wresearch's proprietary forecasting methodology, utilizing the latest available industry data, government publications, and primary research inputs.
Kenya Urea Formaldehyde Resins Market Synopsis
Recent momentum in the Kenya Urea Formaldehyde Resins market has reflected an upsurge linked to heightened construction and woodworking activities. However, as the industry evolves, it is shifting towards innovations that address environmental concerns related to formaldehyde emissions.
The path ahead suggests a significant transition as local manufacturers adapt to both regulatory demands and changing consumer preferences for more sustainable and safe products. This evolution not only provides challenges but also presents new avenues for growth in the market.
Kenya Urea Formaldehyde Resins Market Key Takeaways
- Construction and woodworking sectors are primary drivers of market growth.
- Increased demand for engineered wood products is reshaping the market landscape.
- Innovations aimed at reducing formaldehyde emissions are emerging as key trends.
- Regulatory frameworks are evolving to enforce sustainability in production processes.
- Opportunities for local manufacturers to capitalize on sustainable practices are on the rise.
Evaluation of Restraints in Kenya Urea Formaldehyde Resins Market
The Kenya Urea Formaldehyde Resins Market faces several restraints that could hinder its potential growth. Stringent environmental regulations are pivotal, as they compel manufacturers to adapt to safer production methodologies while simultaneously incurring higher operational costs. The heightened awareness and health concerns regarding formaldehyde emissions further complicate this landscape. Additionally, the challenge of maintaining competitive pricing while innovating to create safer formulations limits market expansion potential.
Kenya Urea Formaldehyde Resins Market Trends
The market is currently experiencing significant trends aimed at enhancing product safety and environmental compatibility. Innovations in resin technology, particularly those designed to minimize formaldehyde emissions, are gaining traction. Furthermore, the push for eco-friendly building materials is becoming increasingly influential, as consumers demand products that align with sustainable practices. Manufacturers are also investing in R&D to develop advanced formulations that maintain performance while reducing health risks.
Kenya Urea Formaldehyde Resins Market Opportunities
The landscape for investment and growth within the Kenya Urea Formaldehyde Resins Market is rich with potential. As construction activities continue to surge, particularly in urban areas, opportunities abound for manufacturers who can provide innovative and sustainable products. Embracing research and development into low-emission formulations can set companies apart. Additionally, partnerships with local furniture makers could further enhance market penetration and brand loyalty.
Government Initiatives in the Kenya Urea Formaldehyde Resins Market
The Kenyan government is actively fostering a regulatory environment that promotes sustainability and industrial growth in the Urea Formaldehyde Resins Market. Current policies focus on stringent environmental standards that encourage safe production practices. Incentives for research and development in innovative resin technologies further support local manufacturers, aiming to align the industry with sustainable objectives. These initiatives are vital for ensuring that the market can adapt to both local and international demands for higher safety and quality.
Future Insights of the Kenya Urea Formaldehyde Resins Market
Looking towards 2026-2032, the Kenya Urea Formaldehyde Resins Market is poised for substantial evolution. The dual pressures of regulatory requirements and consumer preferences for eco-friendly products will shape future developments. Anticipated advancements in resin technology, focusing on safety and efficiency, will likely play a critical role. This period may also see increased collaboration among manufacturers, designers, and regulators to cultivate an industry that prioritizes sustainable growth while meeting rising demand.
Kenya Urea Formaldehyde Resins Market Latest Developments (2025 - 2026)
Recent developments in the Kenya Urea Formaldehyde Resins Market indicate a focused effort towards adopting innovative production processes. There has been a marked increase in collaborations among manufacturers to enhance the sustainability of resin formulations. Additionally, advancements in research around reducing emissions have garnered attention, with various entities exploring new technologies aimed at improving safety and efficiency within the industry.
Kenya Urea Formaldehyde Resins Market - Key Attractiveness of the Report
- 10 Years of Market Numbers
- Historical Data Starting from 2022 to 2025
- Base Year: 2025
- Forecast Data until 2032
- Key Performance Indicators Impacting the Market
- Major Upcoming Developments and Projects
Key Highlights of the Report:
- Kenya Urea Formaldehyde Resins Market Outlook
- Market Size of Kenya Urea Formaldehyde Resins Market, 2025
- Forecast of Kenya Urea Formaldehyde Resins Market, 2032
- Historical Data and Forecast of Kenya Urea Formaldehyde Resins Revenues & Volume for the Period 2022-2032F
- Kenya Urea Formaldehyde Resins Market Trend Evolution
- Kenya Urea Formaldehyde Resins Market Drivers and Challenges
- Kenya Urea Formaldehyde Resins Price Trends
- Kenya Urea Formaldehyde Resins Porter's Five Forces
- Kenya Urea Formaldehyde Resins Industry Life Cycle
- Historical Data and Forecast of Kenya Urea Formaldehyde Resins Market Revenues & Volume By Application for the Period 2022-2032F
- Historical Data and Forecast of Kenya Urea Formaldehyde Resins Market Revenues & Volume By Particle Board for the Period 2022-2032F
- Historical Data and Forecast of Kenya Urea Formaldehyde Resins Market Revenues & Volume By Wood Adhesives for the Period 2022-2032F
- Historical Data and Forecast of Kenya Urea Formaldehyde Resins Market Revenues & Volume By Plywood for the Period 2022-2032F
- Historical Data and Forecast of Kenya Urea Formaldehyde Resins Market Revenues & Volume By Medium Density Fiberboard for the Period 2022-2032F
- Historical Data and Forecast of Kenya Urea Formaldehyde Resins Market Revenues & Volume By Other Applications for the Period 2022-2032F
- Historical Data and Forecast of Kenya Urea Formaldehyde Resins Market Revenues & Volume By End-user Industry for the Period 2022-2032F
- Historical Data and Forecast of Kenya Urea Formaldehyde Resins Market Revenues & Volume By Automotive for the Period 2022-2032F
- Historical Data and Forecast of Kenya Urea Formaldehyde Resins Market Revenues & Volume By Electrical Appliances for the Period 2022-2032F
- Historical Data and Forecast of Kenya Urea Formaldehyde Resins Market Revenues & Volume By Agriculture for the Period 2022-2032F
- Historical Data and Forecast of Kenya Urea Formaldehyde Resins Market Revenues & Volume By Building and Construction for the Period 2022-2032F
- Historical Data and Forecast of Kenya Urea Formaldehyde Resins Market Revenues & Volume By Other End-user Industries for the Period 2022-2032F
- Kenya Urea Formaldehyde Resins Import Export Trade Statistics
- Market Opportunity Assessment By Application
- Market Opportunity Assessment By End-user Industry
- Kenya Urea Formaldehyde Resins Top Companies Market Share
- Kenya Urea Formaldehyde Resins Competitive Benchmarking By Technical and Operational Parameters
- Kenya Urea Formaldehyde Resins Company Profiles
- Kenya Urea Formaldehyde Resins Key Strategic Recommendations
Frequently Asked Questions About the Market Study (FAQs):
The growth is primarily driven by the expanding construction sector and increasing demand for affordable engineered wood products. Enhanced focus on quality and safety is further propelling innovation in the market.
The Kenya Urea Formaldehyde Resins Market was estimated at USD 246 Million in 2025 and is projected to reach USD 320 Million by 2032, with a CAGR of 3.8% from 2026 to 2032.
Manufacturers face challenges related to high production costs and stringent environmental regulations. Moreover, maintaining safety standards while ensuring competitive pricing adds to the complexity of operations.
Government policies are heavily influencing the market by enforcing strict environmental regulations and promoting sustainable practices through incentives for innovation in production methods.
Innovations are focusing on reducing formaldehyde emissions, with manufacturers developing advanced formulations that prioritize safety and environmental compatibility, aligning with consumer demand for sustainable products.
6Wresearch actively monitors the Kenya Urea Formaldehyde Resins Market and publishes its comprehensive annual report, highlighting emerging trends, growth drivers, revenue analysis, and forecast outlook. Our insights help businesses to make data-backed strategic decisions with ongoing market dynamics. Our analysts track relevent industries related to the Kenya Urea Formaldehyde Resins Market, allowing our clients with actionable intelligence and reliable forecasts tailored to emerging regional needs.
Yes, we provide customisation as per your requirements. To learn more, feel free to contact us on sales@6wresearch.com
1 Executive Summary |
2 Introduction |
2.1 Key Highlights of the Report |
2.2 Report Description |
2.3 Market Scope & Segmentation |
2.4 Research Methodology |
2.5 Assumptions |
3 Kenya Urea Formaldehyde Resins Market Overview |
3.1 Kenya Country Macro Economic Indicators |
3.2 Kenya Urea Formaldehyde Resins Market Revenues & Volume, 2022 & 2032F |
3.3 Kenya Urea Formaldehyde Resins Market - Industry Life Cycle |
3.4 Kenya Urea Formaldehyde Resins Market - Porter's Five Forces |
3.5 Kenya Urea Formaldehyde Resins Market Revenues & Volume Share, By Application, 2022 & 2032F |
3.6 Kenya Urea Formaldehyde Resins Market Revenues & Volume Share, By End-user Industry, 2022 & 2032F |
4 Kenya Urea Formaldehyde Resins Market Dynamics |
4.1 Impact Analysis |
4.2 Market Drivers |
4.2.1 Increasing demand for eco-friendly and sustainable products in construction and furniture industries |
4.2.2 Growth in the real estate sector leading to higher demand for wood-based products |
4.2.3 Government initiatives promoting the use of green building materials |
4.3 Market Restraints |
4.3.1 Fluctuations in raw material prices impacting production costs |
4.3.2 Competition from alternative synthetic resins such as phenolic resins |
4.3.3 Lack of awareness about the benefits of urea formaldehyde resins among consumers |
5 Kenya Urea Formaldehyde Resins Market Trends |
6 Kenya Urea Formaldehyde Resins Market, By Types |
6.1 Kenya Urea Formaldehyde Resins Market, By Application |
6.1.1 Overview and Analysis |
6.1.2 Kenya Urea Formaldehyde Resins Market Revenues & Volume, By Application, 2022-2032F |
6.1.3 Kenya Urea Formaldehyde Resins Market Revenues & Volume, By Particle Board, 2022-2032F |
6.1.4 Kenya Urea Formaldehyde Resins Market Revenues & Volume, By Wood Adhesives, 2022-2032F |
6.1.5 Kenya Urea Formaldehyde Resins Market Revenues & Volume, By Plywood, 2022-2032F |
6.1.6 Kenya Urea Formaldehyde Resins Market Revenues & Volume, By Medium Density Fiberboard, 2022-2032F |
6.1.7 Kenya Urea Formaldehyde Resins Market Revenues & Volume, By Other Applications, 2022-2032F |
6.2 Kenya Urea Formaldehyde Resins Market, By End-user Industry |
6.2.1 Overview and Analysis |
6.2.2 Kenya Urea Formaldehyde Resins Market Revenues & Volume, By Automotive, 2022-2032F |
6.2.3 Kenya Urea Formaldehyde Resins Market Revenues & Volume, By Electrical Appliances, 2022-2032F |
6.2.4 Kenya Urea Formaldehyde Resins Market Revenues & Volume, By Agriculture, 2022-2032F |
6.2.5 Kenya Urea Formaldehyde Resins Market Revenues & Volume, By Building and Construction, 2022-2032F |
6.2.6 Kenya Urea Formaldehyde Resins Market Revenues & Volume, By Other End-user Industries, 2022-2032F |
7 Kenya Urea Formaldehyde Resins Market Import-Export Trade Statistics |
7.1 Kenya Urea Formaldehyde Resins Market Export to Major Countries |
7.2 Kenya Urea Formaldehyde Resins Market Imports from Major Countries |
8 Kenya Urea Formaldehyde Resins Market Key Performance Indicators |
8.1 Percentage of construction projects using eco-friendly materials |
8.2 Adoption rate of green building certifications in the construction sector |
8.3 Number of new product developments using urea formaldehyde resins in the furniture industry |
9 Kenya Urea Formaldehyde Resins Market - Opportunity Assessment |
9.1 Kenya Urea Formaldehyde Resins Market Opportunity Assessment, By Application, 2022 & 2032F |
9.2 Kenya Urea Formaldehyde Resins Market Opportunity Assessment, By End-user Industry, 2022 & 2032F |
10 Kenya Urea Formaldehyde Resins Market - Competitive Landscape |
10.1 Kenya Urea Formaldehyde Resins Market Revenue Share, By Companies, 2025 |
10.2 Kenya Urea Formaldehyde Resins Market Competitive Benchmarking, By Operating and Technical Parameters |
11 Company Profiles |
12 Recommendations |
13 Disclaimer |
Global Go To Market Strategy - 2030
Export potential enables firms to identify high-growth global markets with greater confidence by combining advanced trade intelligence with a structured quantitative methodology. The framework analyzes emerging demand trends and country-level import patterns while integrating macroeconomic and trade datasets such as GDP and population forecasts, bilateral import–export flows, tariff structures, elasticity differentials between developed and developing economies, geographic distance, and import demand projections. Using weighted trade values from 2020–2024 as the base period to project country-to-country export potential for 2030, these inputs are operationalized through calculated drivers such as gravity model parameters, tariff impact factors, and projected GDP per-capita growth. Through an analysis of hidden potentials, demand hotspots, and market conditions that are most favorable to success, this method enables firms to focus on target countries, maximize returns, and global expansion with data, backed by accuracy.
By factoring in the projected importer demand gap that is currently unmet and could be potential opportunity, it identifies the potential for the Exporter (Country) among 190 countries, against the general trade analysis, which identifies the biggest importer or exporter.
To discover high-growth global markets and optimize your business strategy:
Click Here
Pricing
- Single User License$ 1,995
- Department License$ 2,400
- Site License$ 3,120
- Global License$ 3,795

Leadership Perspectives from Industry Events
Search
Thought Leadership and Analyst Meet


Our Clients
6WResearch In News
- India Air Conditioner Market Set for Strong Rebound in 2026 After Weather-Led Correction and GST-Driven Recovery: 6Wresearch
- ADAS in India: How Automatic Emergency Braking, Blind Spot Detection & Driver Monitoring are Transforming Road Safety
- Doha a strategic location for EV manufacturing hub: IPA Qatar
- Demand for luxury TVs surging in the GCC, says Samsung
- Empowering Growth: The Thriving Journey of Bangladesh’s Cable Industry
- Demand for luxury TVs surging in the GCC, says Samsung
Latest Reports
- Nicaragua RPG Gaming Market (2026-2032)
- New Zealand RPG Gaming Market (2026-2032)
- Netherlands RPG Gaming Market (2026-2032)
- Nauru RPG Gaming Market (2026-2032)
- Namibia RPG Gaming Market (2026-2032)
- Mozambique RPG Gaming Market (2026-2032)
- Montenegro RPG Gaming Market (2026-2032)
- Mongolia RPG Gaming Market (2026-2032)
- Monaco RPG Gaming Market (2026-2032)
- Micronesia RPG Gaming Market (2026-2032)
Industry Events and Analyst Meet

EV India Expo 2026

HIMTEX 2026

India Refining Summit 2026

India EV Show 2026

EV tech India Expo 2026
Whitepaper
- Middle East & Africa Commercial Security Market Click here to view more.
- Middle East & Africa Fire Safety Systems & Equipment Market Click here to view more.
- GCC Drone Market Click here to view more.
- Middle East Lighting Fixture Market Click here to view more.
- GCC Physical & Perimeter Security Market Click here to view more.