Kuwait Decorations and Inclusions Market (2026-2032) | Analysis, Trends, Growth, Size & Revenue, Forecast, Value, Competitive Landscape, Companies, Industry, Share, Outlook, Segmentation
Market Forecast By End-User (Food and Beverage Processing, Bakeries and Pastry Shops, Confectionery Shops, Restaurants and Hotels, Household), By Product Type (Chocolate Sprinkles and Inclusions, Chocolate Shapes, Chocolate Cups and Shells, Sugar Sprinkles and Inclusions, Sugar Shapes, Preserved/Dried Fruit Pieces, Sweetened/Caramelised Nuts, Roasted Nuts), By Distribution Channel (Direct Sales/B2B, Indirect Sales/B2C) And Competitive Landscape
| Product Code: ETC7844289 | Publication Date: Sep 2024 | Updated Date: Feb 2026 | Product Type: Market Research Report | |
| Publisher: 6Wresearch | Author: Sumit Sagar | No. of Pages: 75 | No. of Figures: 35 | No. of Tables: 20 |
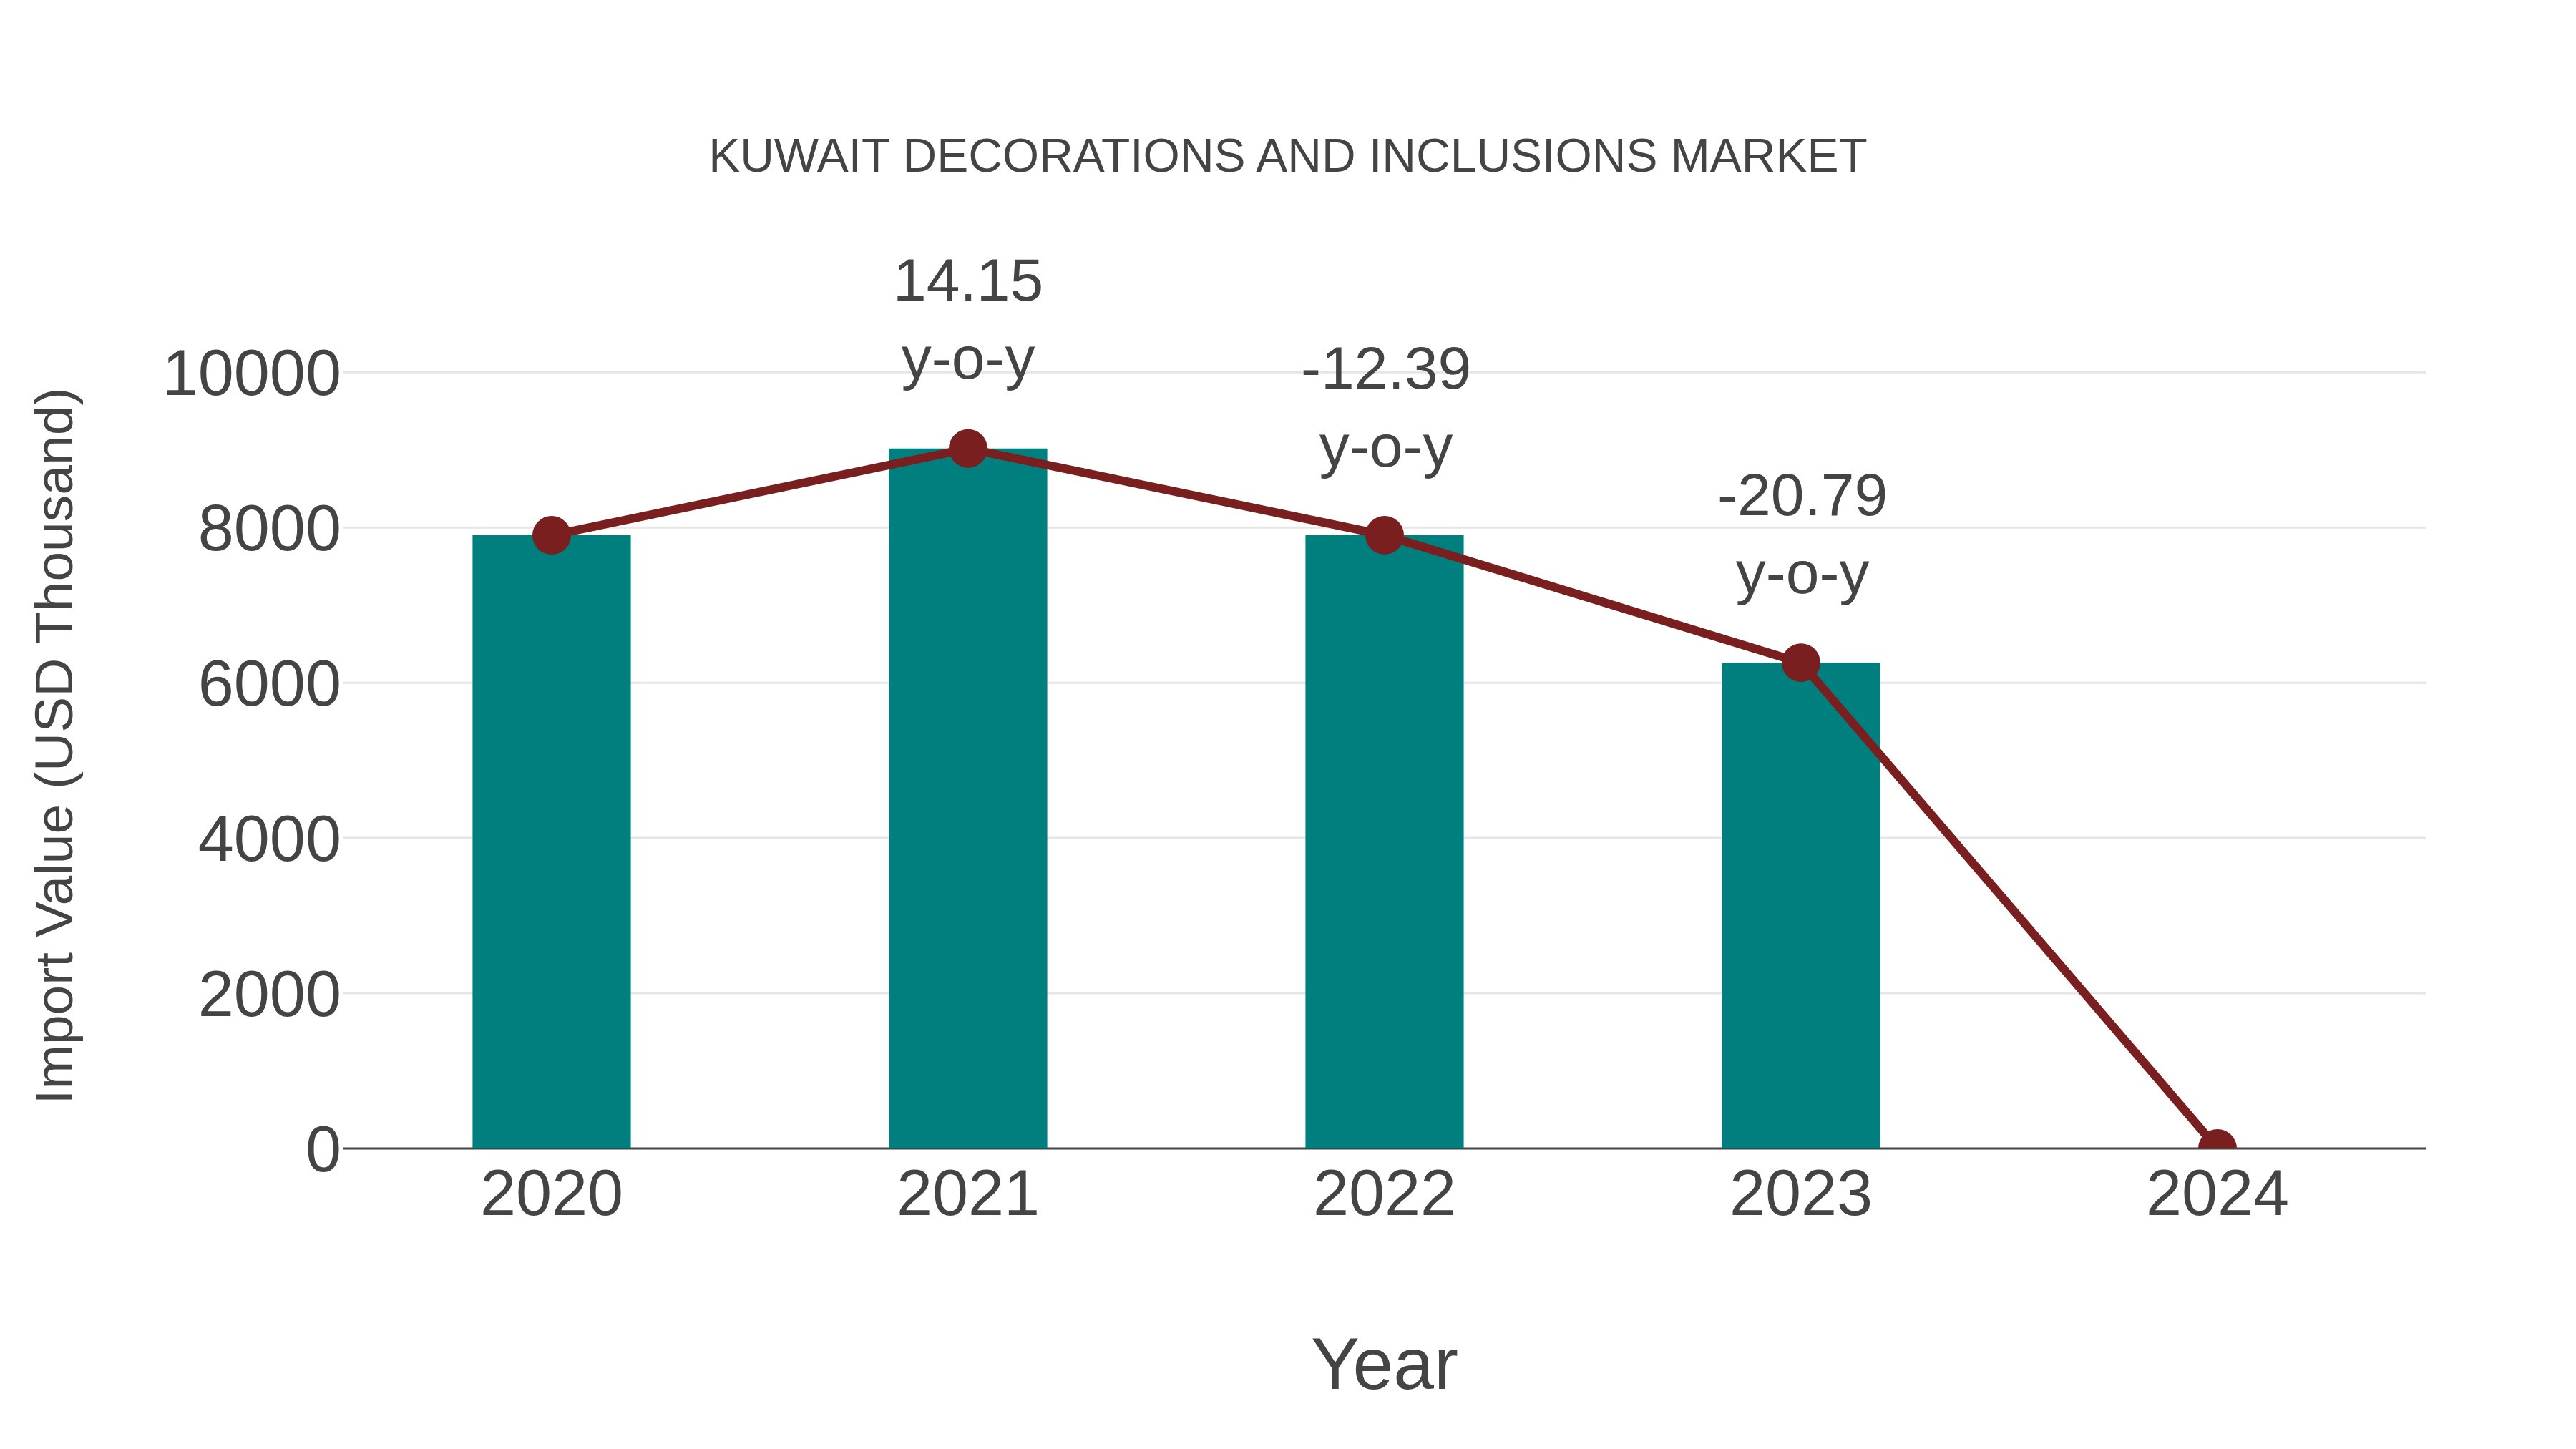
Kuwait Decorations and Inclusions Market: Import Trend Analysis
Kuwait import trend for decorations and inclusions from 2020 to 2024 experienced a negative Compound Annual Growth Rate (CAGR) of -7.47%. This decline suggests a weakening import momentum and potentially a shift in demand for such products, indicating a challenging market environment for traders in this sector.
Key Highlights of the Report:
- Kuwait Decorations and Inclusions Market Outlook
- Market Size of Kuwait Decorations and Inclusions Market, 2025
- Forecast of Kuwait Decorations and Inclusions Market, 2032
- Historical Data and Forecast of Kuwait Decorations and Inclusions Revenues & Volume for the Period 2022-2032F
- Kuwait Decorations and Inclusions Market Trend Evolution
- Kuwait Decorations and Inclusions Market Drivers and Challenges
- Kuwait Decorations and Inclusions Price Trends
- Kuwait Decorations and Inclusions Porter's Five Forces
- Kuwait Decorations and Inclusions Industry Life Cycle
- Historical Data and Forecast of Kuwait Decorations and Inclusions Market Revenues & Volume By End-User for the Period 2022-2032F
- Historical Data and Forecast of Kuwait Decorations and Inclusions Market Revenues & Volume By Food and Beverage Processing for the Period 2022-2032F
- Historical Data and Forecast of Kuwait Decorations and Inclusions Market Revenues & Volume By Bakeries and Pastry Shops for the Period 2022-2032F
- Historical Data and Forecast of Kuwait Decorations and Inclusions Market Revenues & Volume By Confectionery Shops for the Period 2022-2032F
- Historical Data and Forecast of Kuwait Decorations and Inclusions Market Revenues & Volume By Restaurants and Hotels for the Period 2022-2032F
- Historical Data and Forecast of Kuwait Decorations and Inclusions Market Revenues & Volume By Household for the Period 2022-2032F
- Historical Data and Forecast of Kuwait Decorations and Inclusions Market Revenues & Volume By Product Type for the Period 2022-2032F
- Historical Data and Forecast of Kuwait Decorations and Inclusions Market Revenues & Volume By Chocolate Sprinkles and Inclusions for the Period 2022-2032F
- Historical Data and Forecast of Kuwait Decorations and Inclusions Market Revenues & Volume By Chocolate Shapes for the Period 2022-2032F
- Historical Data and Forecast of Kuwait Decorations and Inclusions Market Revenues & Volume By Chocolate Cups and Shells for the Period 2022-2032F
- Historical Data and Forecast of Kuwait Decorations and Inclusions Market Revenues & Volume By Sugar Sprinkles and Inclusions for the Period 2022-2032F
- Historical Data and Forecast of Kuwait Decorations and Inclusions Market Revenues & Volume By Sugar Shapes for the Period 2022-2032F
- Historical Data and Forecast of Kuwait Decorations and Inclusions Market Revenues & Volume By Preserved/Dried Fruit Pieces for the Period 2022-2032F
- Historical Data and Forecast of Kuwait Decorations and Inclusions Market Revenues & Volume By Sweetened/Caramelised Nuts for the Period 2022-2032F
- Historical Data and Forecast of Kuwait Decorations and Inclusions Market Revenues & Volume By Roasted Nuts for the Period 2022-2032F
- Historical Data and Forecast of Kuwait Decorations and Inclusions Market Revenues & Volume By Distribution Channel for the Period 2022-2032F
- Historical Data and Forecast of Kuwait Decorations and Inclusions Market Revenues & Volume By Direct Sales/B2B for the Period 2022-2032F
- Historical Data and Forecast of Kuwait Decorations and Inclusions Market Revenues & Volume By Indirect Sales/B2C for the Period 2022-2032F
- Kuwait Decorations and Inclusions Import Export Trade Statistics
- Market Opportunity Assessment By End-User
- Market Opportunity Assessment By Product Type
- Market Opportunity Assessment By Distribution Channel
- Kuwait Decorations and Inclusions Top Companies Market Share
- Kuwait Decorations and Inclusions Competitive Benchmarking By Technical and Operational Parameters
- Kuwait Decorations and Inclusions Company Profiles
- Kuwait Decorations and Inclusions Key Strategic Recommendations
Frequently Asked Questions About the Market Study (FAQs):
6Wresearch actively monitors the Kuwait Decorations and Inclusions Market and publishes its comprehensive annual report, highlighting emerging trends, growth drivers, revenue analysis, and forecast outlook. Our insights help businesses to make data-backed strategic decisions with ongoing market dynamics. Our analysts track relevent industries related to the Kuwait Decorations and Inclusions Market, allowing our clients with actionable intelligence and reliable forecasts tailored to emerging regional needs.
Yes, we provide customisation as per your requirements. To learn more, feel free to contact us on sales@6wresearch.com
1 Executive Summary |
2 Introduction |
2.1 Key Highlights of the Report |
2.2 Report Description |
2.3 Market Scope & Segmentation |
2.4 Research Methodology |
2.5 Assumptions |
3 Kuwait Decorations and Inclusions Market Overview |
3.1 Kuwait Country Macro Economic Indicators |
3.2 Kuwait Decorations and Inclusions Market Revenues & Volume, 2022 & 2032F |
3.3 Kuwait Decorations and Inclusions Market - Industry Life Cycle |
3.4 Kuwait Decorations and Inclusions Market - Porter's Five Forces |
3.5 Kuwait Decorations and Inclusions Market Revenues & Volume Share, By End-User, 2022 & 2032F |
3.6 Kuwait Decorations and Inclusions Market Revenues & Volume Share, By Product Type, 2022 & 2032F |
3.7 Kuwait Decorations and Inclusions Market Revenues & Volume Share, By Distribution Channel, 2022 & 2032F |
4 Kuwait Decorations and Inclusions Market Dynamics |
4.1 Impact Analysis |
4.2 Market Drivers |
4.2.1 Growing disposable income of consumers in Kuwait, leading to increased spending on decorations and inclusions. |
4.2.2 Rising trend of home renovation and interior decoration projects in Kuwait. |
4.2.3 Increasing awareness and appreciation for unique and personalized home decor items. |
4.2.4 Influence of social media and digital platforms in showcasing and promoting decorative products. |
4.2.5 Growing tourism industry in Kuwait driving demand for decorative items in hotels, resorts, and other commercial spaces. |
4.3 Market Restraints |
4.3.1 Economic fluctuations impacting consumer spending on non-essential items like decorations. |
4.3.2 Competition from international brands and online marketplaces affecting local businesses. |
4.3.3 Limited availability of skilled artisans and craftsmen for creating traditional Kuwaiti decorations. |
4.3.4 Regulatory challenges related to import/export restrictions on certain decorative items. |
4.3.5 Seasonal fluctuations in demand for decorations during specific festivals and events. |
5 Kuwait Decorations and Inclusions Market Trends |
6 Kuwait Decorations and Inclusions Market, By Types |
6.1 Kuwait Decorations and Inclusions Market, By End-User |
6.1.1 Overview and Analysis |
6.1.2 Kuwait Decorations and Inclusions Market Revenues & Volume, By End-User, 2022-2032F |
6.1.3 Kuwait Decorations and Inclusions Market Revenues & Volume, By Food and Beverage Processing, 2022-2032F |
6.1.4 Kuwait Decorations and Inclusions Market Revenues & Volume, By Bakeries and Pastry Shops, 2022-2032F |
6.1.5 Kuwait Decorations and Inclusions Market Revenues & Volume, By Confectionery Shops, 2022-2032F |
6.1.6 Kuwait Decorations and Inclusions Market Revenues & Volume, By Restaurants and Hotels, 2022-2032F |
6.1.7 Kuwait Decorations and Inclusions Market Revenues & Volume, By Household, 2022-2032F |
6.2 Kuwait Decorations and Inclusions Market, By Product Type |
6.2.1 Overview and Analysis |
6.2.2 Kuwait Decorations and Inclusions Market Revenues & Volume, By Chocolate Sprinkles and Inclusions, 2022-2032F |
6.2.3 Kuwait Decorations and Inclusions Market Revenues & Volume, By Chocolate Shapes, 2022-2032F |
6.2.4 Kuwait Decorations and Inclusions Market Revenues & Volume, By Chocolate Cups and Shells, 2022-2032F |
6.2.5 Kuwait Decorations and Inclusions Market Revenues & Volume, By Sugar Sprinkles and Inclusions, 2022-2032F |
6.2.6 Kuwait Decorations and Inclusions Market Revenues & Volume, By Sugar Shapes, 2022-2032F |
6.2.7 Kuwait Decorations and Inclusions Market Revenues & Volume, By Preserved/Dried Fruit Pieces, 2022-2032F |
6.2.8 Kuwait Decorations and Inclusions Market Revenues & Volume, By Roasted Nuts, 2022-2032F |
6.2.9 Kuwait Decorations and Inclusions Market Revenues & Volume, By Roasted Nuts, 2022-2032F |
6.3 Kuwait Decorations and Inclusions Market, By Distribution Channel |
6.3.1 Overview and Analysis |
6.3.2 Kuwait Decorations and Inclusions Market Revenues & Volume, By Direct Sales/B2B, 2022-2032F |
6.3.3 Kuwait Decorations and Inclusions Market Revenues & Volume, By Indirect Sales/B2C, 2022-2032F |
7 Kuwait Decorations and Inclusions Market Import-Export Trade Statistics |
7.1 Kuwait Decorations and Inclusions Market Export to Major Countries |
7.2 Kuwait Decorations and Inclusions Market Imports from Major Countries |
8 Kuwait Decorations and Inclusions Market Key Performance Indicators |
8.1 Customer engagement metrics on social media platforms (likes, shares, comments). |
8.2 Website traffic and online search volume for keywords related to decorations in Kuwait. |
8.3 Number of interior design and home decor exhibitions and events attended by industry players. |
8.4 Percentage of repeat customers or customer retention rate for decorative products. |
8.5 Quality and uniqueness ratings of decorative products by customers through reviews and surveys. |
9 Kuwait Decorations and Inclusions Market - Opportunity Assessment |
9.1 Kuwait Decorations and Inclusions Market Opportunity Assessment, By End-User, 2022 & 2032F |
9.2 Kuwait Decorations and Inclusions Market Opportunity Assessment, By Product Type, 2022 & 2032F |
9.3 Kuwait Decorations and Inclusions Market Opportunity Assessment, By Distribution Channel, 2022 & 2032F |
10 Kuwait Decorations and Inclusions Market - Competitive Landscape |
10.1 Kuwait Decorations and Inclusions Market Revenue Share, By Companies, 2025 |
10.2 Kuwait Decorations and Inclusions Market Competitive Benchmarking, By Operating and Technical Parameters |
11 Company Profiles |
12 Recommendations |
13 Disclaimer |
Global Go To Market Strategy - 2030
Export potential enables firms to identify high-growth global markets with greater confidence by combining advanced trade intelligence with a structured quantitative methodology. The framework analyzes emerging demand trends and country-level import patterns while integrating macroeconomic and trade datasets such as GDP and population forecasts, bilateral import–export flows, tariff structures, elasticity differentials between developed and developing economies, geographic distance, and import demand projections. Using weighted trade values from 2020–2024 as the base period to project country-to-country export potential for 2030, these inputs are operationalized through calculated drivers such as gravity model parameters, tariff impact factors, and projected GDP per-capita growth. Through an analysis of hidden potentials, demand hotspots, and market conditions that are most favorable to success, this method enables firms to focus on target countries, maximize returns, and global expansion with data, backed by accuracy.
By factoring in the projected importer demand gap that is currently unmet and could be potential opportunity, it identifies the potential for the Exporter (Country) among 190 countries, against the general trade analysis, which identifies the biggest importer or exporter.
To discover high-growth global markets and optimize your business strategy:
Click Here
Pricing
- Single User License$ 1,995
- Department License$ 2,400
- Site License$ 3,120
- Global License$ 3,795

Leadership Perspectives from Industry Events
Search
Thought Leadership and Analyst Meet


Our Clients
6WResearch In News
- Doha a strategic location for EV manufacturing hub: IPA Qatar
- Demand for luxury TVs surging in the GCC, says Samsung
- Empowering Growth: The Thriving Journey of Bangladesh’s Cable Industry
- Demand for luxury TVs surging in the GCC, says Samsung
- Video call with a traditional healer? Once unthinkable, it’s now common in South Africa
- Intelligent Buildings To Smooth GCC’s Path To Net Zero
Latest Reports
- New Zealand Aseptic Manufacturing Market (2026-2032)
- Netherlands Aseptic Manufacturing Market (2026-2032)
- Nauru Aseptic Manufacturing Market (2026-2032)
- Namibia Aseptic Manufacturing Market (2026-2032)
- Mozambique Aseptic Manufacturing Market (2026-2032)
- Montenegro Aseptic Manufacturing Market (2026-2032)
- Mongolia Aseptic Manufacturing Market (2026-2032)
- Monaco Aseptic Manufacturing Market (2026-2032)
- Micronesia Aseptic Manufacturing Market (2026-2032)
- Mauritius Aseptic Manufacturing Market (2026-2032)
Industry Events and Analyst Meet

HIMTEX 2026

India Refining Summit 2026

India EV Show 2026

EV tech India Expo 2026

Auto Tech Asia 2026
Whitepaper
- Middle East & Africa Commercial Security Market Click here to view more.
- Middle East & Africa Fire Safety Systems & Equipment Market Click here to view more.
- GCC Drone Market Click here to view more.
- Middle East Lighting Fixture Market Click here to view more.
- GCC Physical & Perimeter Security Market Click here to view more.