Latvia Bio Compatible Dental Materials Market (2026-2032) | Supply, Industry, Competitive, Competition, Drivers, Challenges, Strategic Insights, Investment Trends, Segments, Pricing Analysis, Opportunities, Forecast, Companies, Size, Demand, Outlook, Value, Growth, Consumer Insights, Analysis, Restraints, Share, Trends, Strategy, Segmentation, Revenue
Market Forecast By Material Type (Bio-Ceramics, Bio-Polymers, Bio-Metals), By Application (Dental Crowns, Braces, Dental Implants), By End User (Clinics, Orthodontics, Dental Labs), By Source (Biomass, Plant-Based, Sugar-Based), By Environmental Impact (Biodegradable, Non-Toxic, Durable) And Competitive Landscape
| Product Code: ETC11452789 | Publication Date: Apr 2025 | Updated Date: Apr 2026 | Product Type: Market Research Report | |
| Publisher: 6Wresearch | No. of Pages: 65 | No. of Figures: 34 | No. of Tables: 19 | |
Latvia Bio Compatible Dental Materials Market Size (2020-2030)
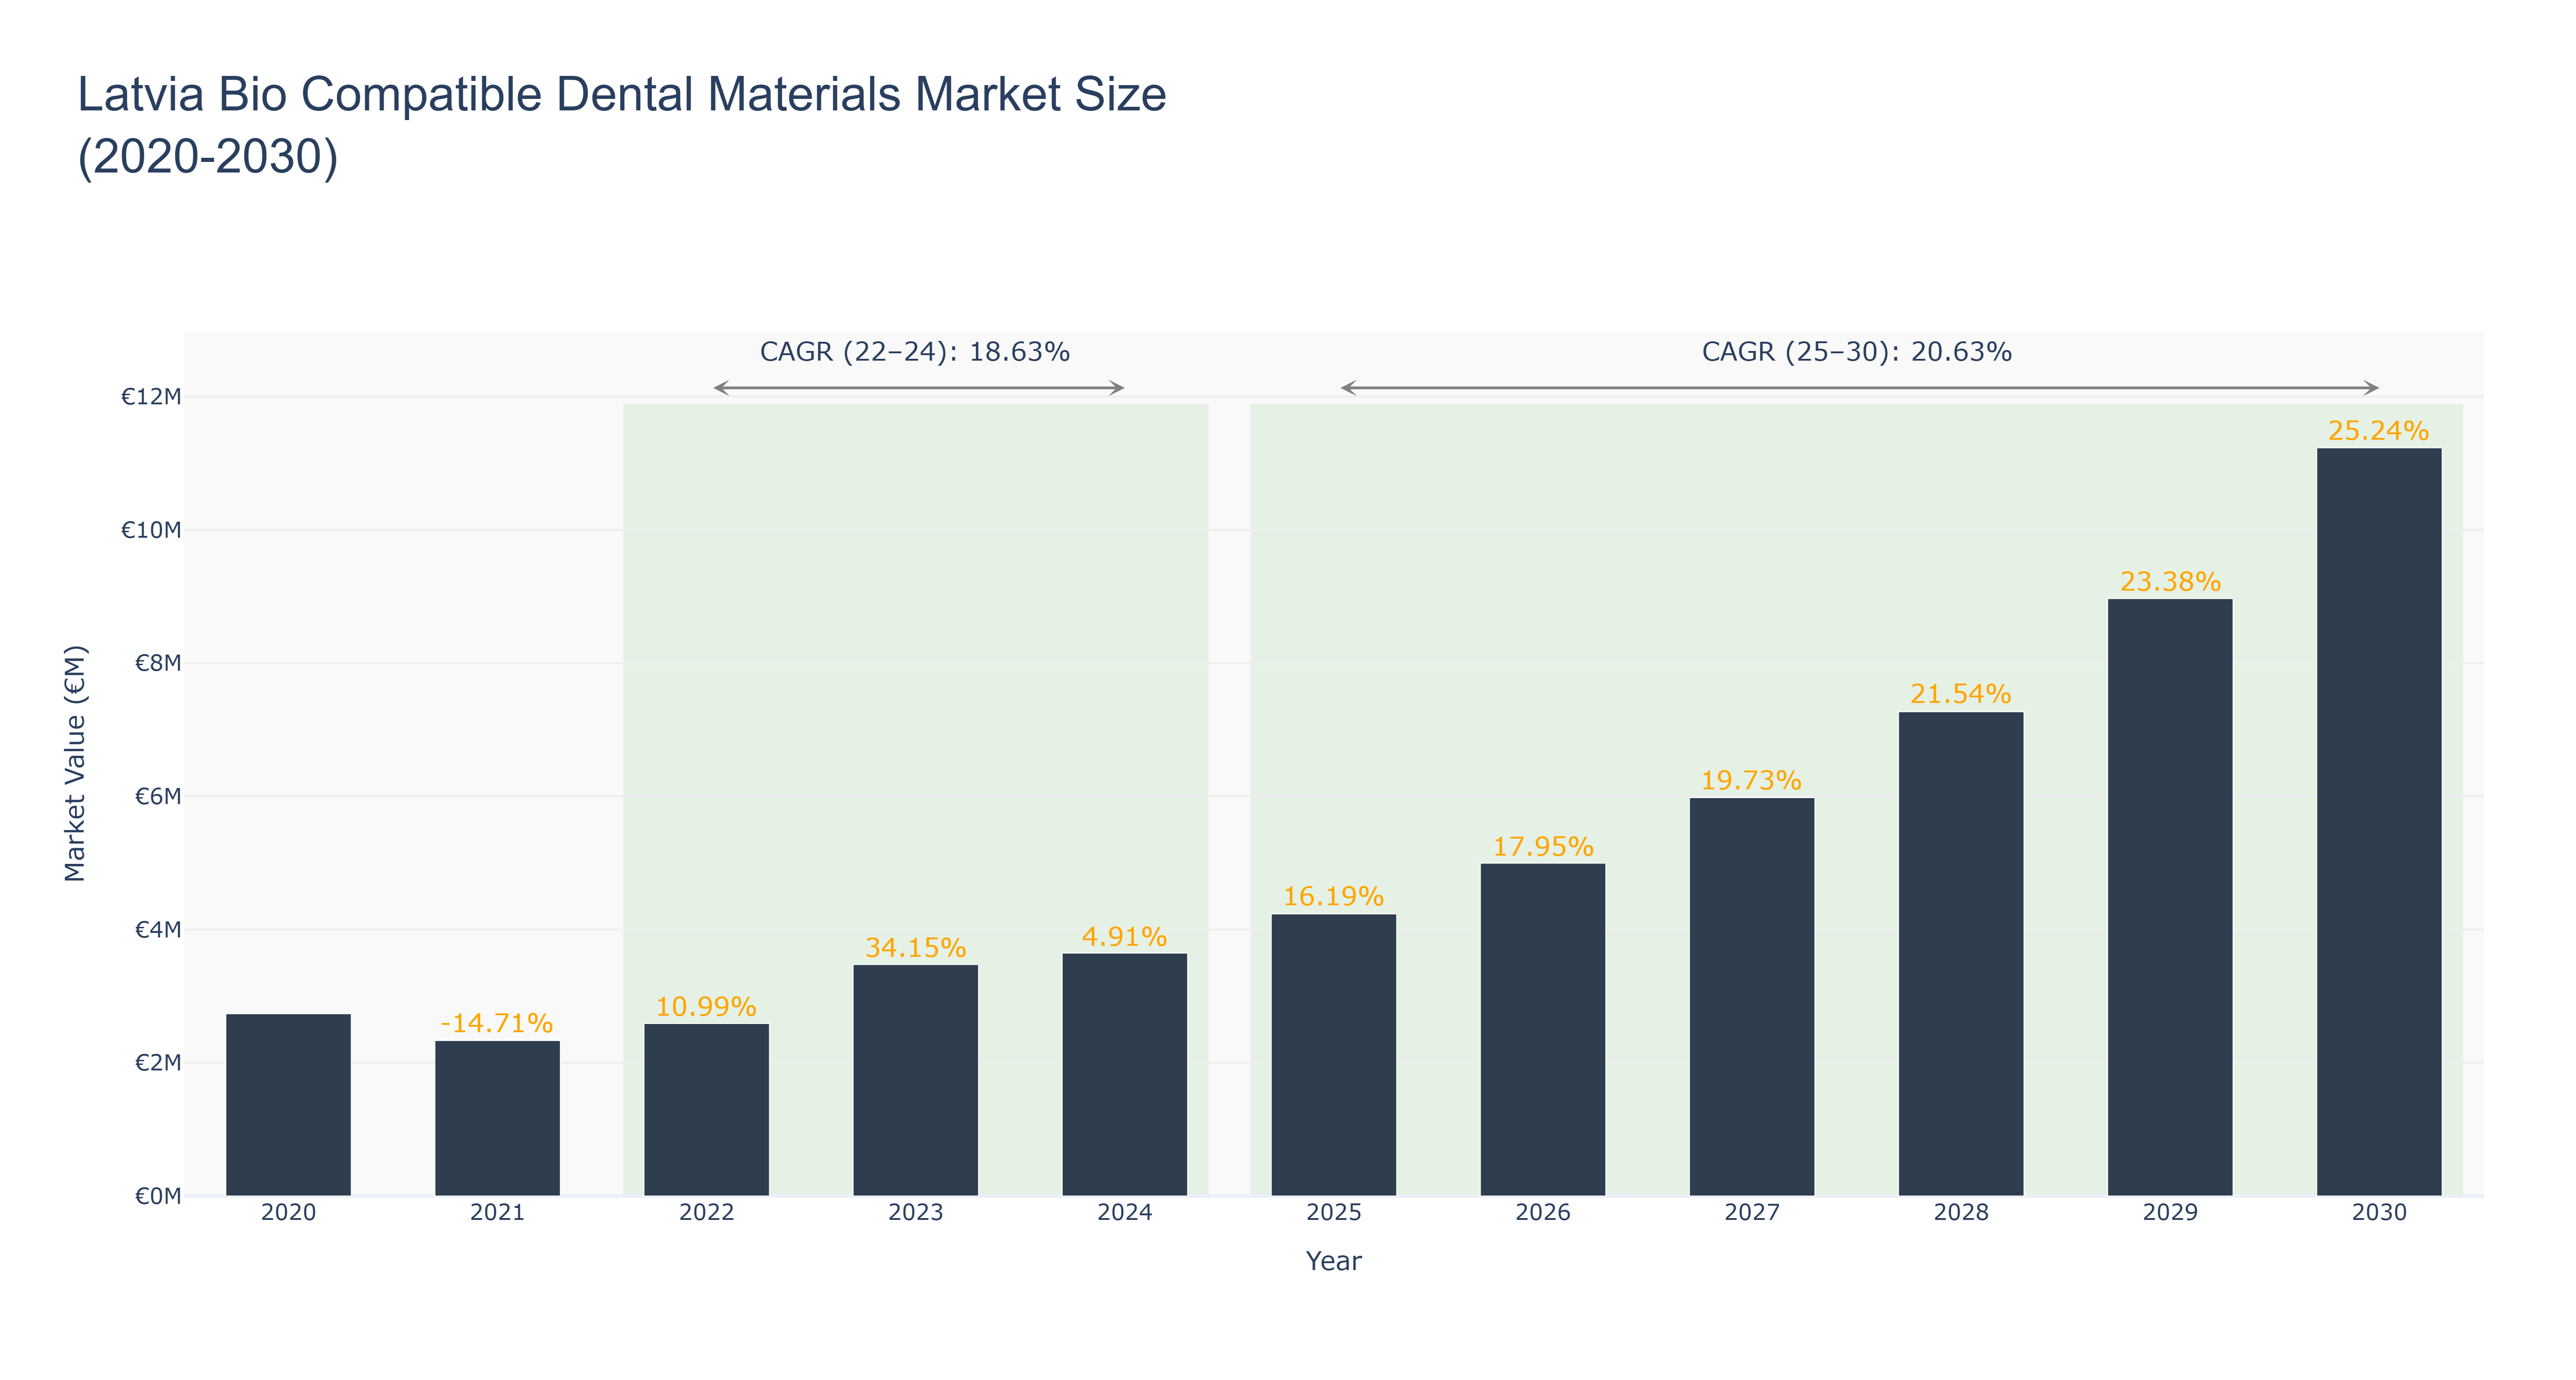
Latvia Bio Compatible Dental Materials Market has shown a promising trend over the years. The peak market size of €11.23 million in 2030 reflects significant growth potential. From 2020 to 2024, the market size increased steadily, reaching €3.65 million in 2024. The forecasted growth from 2025 to 2030 is even more impressive, with an expected market size of €11.23 million in 2030. The CAGR values of 18.63% (2022-24) and 20.63% (2025-30) indicate a robust upward trajectory. Industry drivers such as increasing demand for bio-compatible dental materials and technological advancements in the field are fueling this growth. In the near future, Latvia is set to witness the launch of innovative bio-compatible dental products, further boosting market expansion.
Latvia Bio Compatible Dental Materials Market: Production & Trade Performance (2019-2025)
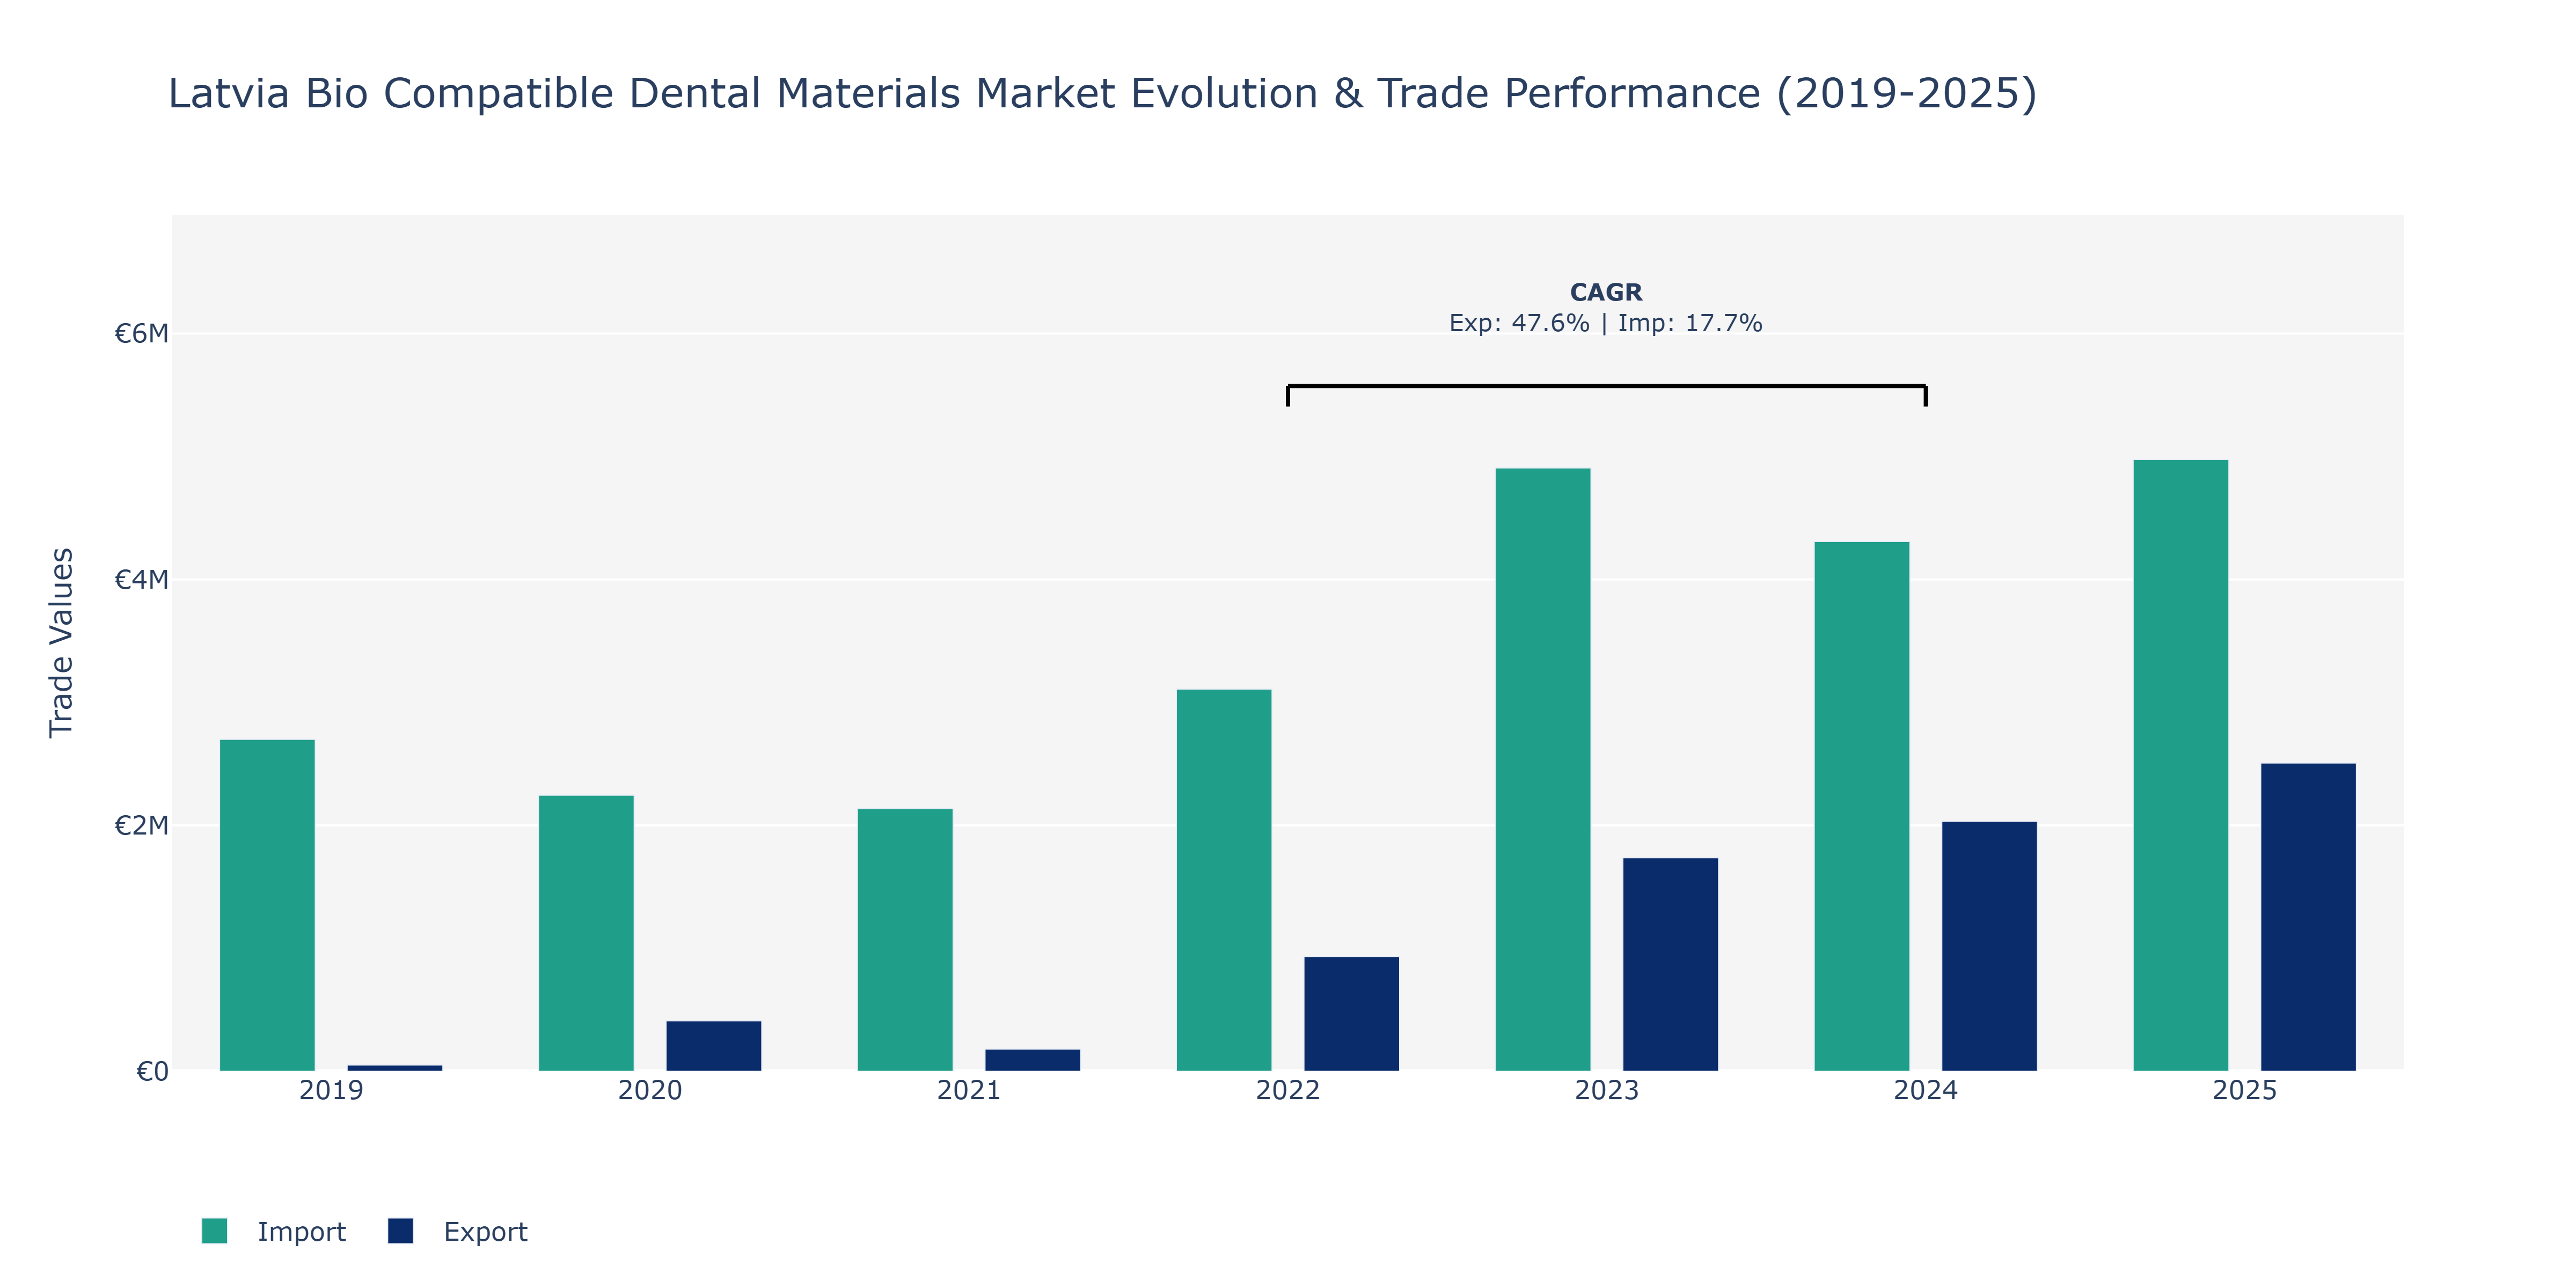
The Latvia Bio Compatible Dental Materials Market witnessed notable fluctuations in exports and imports from 2019 to 2025. Exports started at €49.8 thousand in 2019, experiencing a substantial rise to €2.03 million in 2024 before reaching €2.51 million in 2025. This upward trend can be attributed to the growing global demand for bio-compatible dental materials as dental technologies advance, leading to increased production and export capabilities within Latvia. In contrast, imports began at €2.7 million in 2019, declined to €2.14 million in 2021, then surged to €4.91 million in 2023, and finally reached €4.98 million in 2025. The fluctuating Import value could be linked to changes in international trade agreements, local production capabilities, or shifts in market demand for specific dental materials. To sustain this growth, market players should focus on innovation, quality control, and strategic partnerships to capitalize on the rising global demand for bio-compatible dental materials in the coming years.
Key Highlights of the Report:
- Latvia Bio Compatible Dental Materials Market Outlook
- Market Size of Latvia Bio Compatible Dental Materials Market, 2025
- Forecast of Latvia Bio Compatible Dental Materials Market, 2032
- Historical Data and Forecast of Latvia Bio Compatible Dental Materials Revenues & Volume for the Period 2022 - 2032F
- Latvia Bio Compatible Dental Materials Market Trend Evolution
- Latvia Bio Compatible Dental Materials Market Drivers and Challenges
- Latvia Bio Compatible Dental Materials Price Trends
- Latvia Bio Compatible Dental Materials Porter's Five Forces
- Latvia Bio Compatible Dental Materials Industry Life Cycle
- Historical Data and Forecast of Latvia Bio Compatible Dental Materials Market Revenues & Volume By Material Type for the Period 2022 - 2032F
- Historical Data and Forecast of Latvia Bio Compatible Dental Materials Market Revenues & Volume By Bio-Ceramics for the Period 2022 - 2032F
- Historical Data and Forecast of Latvia Bio Compatible Dental Materials Market Revenues & Volume By Bio-Polymers for the Period 2022 - 2032F
- Historical Data and Forecast of Latvia Bio Compatible Dental Materials Market Revenues & Volume By Bio-Metals for the Period 2022 - 2032F
- Historical Data and Forecast of Latvia Bio Compatible Dental Materials Market Revenues & Volume By Application for the Period 2022 - 2032F
- Historical Data and Forecast of Latvia Bio Compatible Dental Materials Market Revenues & Volume By Dental Crowns for the Period 2022 - 2032F
- Historical Data and Forecast of Latvia Bio Compatible Dental Materials Market Revenues & Volume By Braces for the Period 2022 - 2032F
- Historical Data and Forecast of Latvia Bio Compatible Dental Materials Market Revenues & Volume By Dental Implants for the Period 2022 - 2032F
- Historical Data and Forecast of Latvia Bio Compatible Dental Materials Market Revenues & Volume By End User for the Period 2022 - 2032F
- Historical Data and Forecast of Latvia Bio Compatible Dental Materials Market Revenues & Volume By Clinics for the Period 2022 - 2032F
- Historical Data and Forecast of Latvia Bio Compatible Dental Materials Market Revenues & Volume By Orthodontics for the Period 2022 - 2032F
- Historical Data and Forecast of Latvia Bio Compatible Dental Materials Market Revenues & Volume By Dental Labs for the Period 2022 - 2032F
- Historical Data and Forecast of Latvia Bio Compatible Dental Materials Market Revenues & Volume By Source for the Period 2022 - 2032F
- Historical Data and Forecast of Latvia Bio Compatible Dental Materials Market Revenues & Volume By Biomass for the Period 2022 - 2032F
- Historical Data and Forecast of Latvia Bio Compatible Dental Materials Market Revenues & Volume By Plant-Based for the Period 2022 - 2032F
- Historical Data and Forecast of Latvia Bio Compatible Dental Materials Market Revenues & Volume By Sugar-Based for the Period 2022 - 2032F
- Historical Data and Forecast of Latvia Bio Compatible Dental Materials Market Revenues & Volume By Environmental Impact for the Period 2022 - 2032F
- Historical Data and Forecast of Latvia Bio Compatible Dental Materials Market Revenues & Volume By Biodegradable for the Period 2022 - 2032F
- Historical Data and Forecast of Latvia Bio Compatible Dental Materials Market Revenues & Volume By Non-Toxic for the Period 2022 - 2032F
- Historical Data and Forecast of Latvia Bio Compatible Dental Materials Market Revenues & Volume By Durable for the Period 2022 - 2032F
- Latvia Bio Compatible Dental Materials Import Export Trade Statistics
- Market Opportunity Assessment By Material Type
- Market Opportunity Assessment By Application
- Market Opportunity Assessment By End User
- Market Opportunity Assessment By Source
- Market Opportunity Assessment By Environmental Impact
- Latvia Bio Compatible Dental Materials Top Companies Market Share
- Latvia Bio Compatible Dental Materials Competitive Benchmarking By Technical and Operational Parameters
- Latvia Bio Compatible Dental Materials Company Profiles
- Latvia Bio Compatible Dental Materials Key Strategic Recommendations
Frequently Asked Questions About the Market Study (FAQs):
6Wresearch actively monitors the Latvia Bio Compatible Dental Materials Market and publishes its comprehensive annual report, highlighting emerging trends, growth drivers, revenue analysis, and forecast outlook. Our insights help businesses to make data-backed strategic decisions with ongoing market dynamics. Our analysts track relevent industries related to the Latvia Bio Compatible Dental Materials Market, allowing our clients with actionable intelligence and reliable forecasts tailored to emerging regional needs.
Yes, we provide customisation as per your requirements. To learn more, feel free to contact us on sales@6wresearch.com
1 Executive Summary |
2 Introduction |
2.1 Key Highlights of the Report |
2.2 Report Description |
2.3 Market Scope & Segmentation |
2.4 Research Methodology |
2.5 Assumptions |
3 Latvia Bio Compatible Dental Materials Market Overview |
3.1 Latvia Country Macro Economic Indicators |
3.2 Latvia Bio Compatible Dental Materials Market Revenues & Volume, 2022 & 2032F |
3.3 Latvia Bio Compatible Dental Materials Market - Industry Life Cycle |
3.4 Latvia Bio Compatible Dental Materials Market - Porter's Five Forces |
3.5 Latvia Bio Compatible Dental Materials Market Revenues & Volume Share, By Material Type, 2022 & 2032F |
3.6 Latvia Bio Compatible Dental Materials Market Revenues & Volume Share, By Application, 2022 & 2032F |
3.7 Latvia Bio Compatible Dental Materials Market Revenues & Volume Share, By End User, 2022 & 2032F |
3.8 Latvia Bio Compatible Dental Materials Market Revenues & Volume Share, By Source, 2022 & 2032F |
3.9 Latvia Bio Compatible Dental Materials Market Revenues & Volume Share, By Environmental Impact, 2022 & 2032F |
4 Latvia Bio Compatible Dental Materials Market Dynamics |
4.1 Impact Analysis |
4.2 Market Drivers |
4.2.1 Growing awareness about the benefits of bio-compatible dental materials among consumers and dental professionals. |
4.2.2 Increasing focus on aesthetics and patient safety in dental procedures. |
4.2.3 Technological advancements leading to the development of innovative bio-compatible dental materials. |
4.3 Market Restraints |
4.3.1 High initial costs associated with bio-compatible dental materials compared to traditional materials. |
4.3.2 Limited availability of specialized training for dental professionals in working with bio-compatible materials. |
4.3.3 Regulatory challenges and compliance requirements for bio-compatible dental materials. |
5 Latvia Bio Compatible Dental Materials Market Trends |
6 Latvia Bio Compatible Dental Materials Market, By Types |
6.1 Latvia Bio Compatible Dental Materials Market, By Material Type |
6.1.1 Overview and Analysis |
6.1.2 Latvia Bio Compatible Dental Materials Market Revenues & Volume, By Material Type, 2022 - 2032F |
6.1.3 Latvia Bio Compatible Dental Materials Market Revenues & Volume, By Bio-Ceramics, 2022 - 2032F |
6.1.4 Latvia Bio Compatible Dental Materials Market Revenues & Volume, By Bio-Polymers, 2022 - 2032F |
6.1.5 Latvia Bio Compatible Dental Materials Market Revenues & Volume, By Bio-Metals, 2022 - 2032F |
6.2 Latvia Bio Compatible Dental Materials Market, By Application |
6.2.1 Overview and Analysis |
6.2.2 Latvia Bio Compatible Dental Materials Market Revenues & Volume, By Dental Crowns, 2022 - 2032F |
6.2.3 Latvia Bio Compatible Dental Materials Market Revenues & Volume, By Braces, 2022 - 2032F |
6.2.4 Latvia Bio Compatible Dental Materials Market Revenues & Volume, By Dental Implants, 2022 - 2032F |
6.3 Latvia Bio Compatible Dental Materials Market, By End User |
6.3.1 Overview and Analysis |
6.3.2 Latvia Bio Compatible Dental Materials Market Revenues & Volume, By Clinics, 2022 - 2032F |
6.3.3 Latvia Bio Compatible Dental Materials Market Revenues & Volume, By Orthodontics, 2022 - 2032F |
6.3.4 Latvia Bio Compatible Dental Materials Market Revenues & Volume, By Dental Labs, 2022 - 2032F |
6.4 Latvia Bio Compatible Dental Materials Market, By Source |
6.4.1 Overview and Analysis |
6.4.2 Latvia Bio Compatible Dental Materials Market Revenues & Volume, By Biomass, 2022 - 2032F |
6.4.3 Latvia Bio Compatible Dental Materials Market Revenues & Volume, By Plant-Based, 2022 - 2032F |
6.4.4 Latvia Bio Compatible Dental Materials Market Revenues & Volume, By Sugar-Based, 2022 - 2032F |
6.5 Latvia Bio Compatible Dental Materials Market, By Environmental Impact |
6.5.1 Overview and Analysis |
6.5.2 Latvia Bio Compatible Dental Materials Market Revenues & Volume, By Biodegradable, 2022 - 2032F |
6.5.3 Latvia Bio Compatible Dental Materials Market Revenues & Volume, By Non-Toxic, 2022 - 2032F |
6.5.4 Latvia Bio Compatible Dental Materials Market Revenues & Volume, By Durable, 2022 - 2032F |
7 Latvia Bio Compatible Dental Materials Market Import-Export Trade Statistics |
7.1 Latvia Bio Compatible Dental Materials Market Export to Major Countries |
7.2 Latvia Bio Compatible Dental Materials Market Imports from Major Countries |
8 Latvia Bio Compatible Dental Materials Market Key Performance Indicators |
8.1 Adoption rate of bio-compatible dental materials by dental clinics in Latvia. |
8.2 Number of research studies and publications on the efficacy and safety of bio-compatible dental materials. |
8.3 Percentage of dental professionals attending training programs on bio-compatible materials. |
8.4 Patient satisfaction scores related to treatments using bio-compatible dental materials. |
8.5 Investment in research and development of new bio-compatible dental materials in Latvia. |
9 Latvia Bio Compatible Dental Materials Market - Opportunity Assessment |
9.1 Latvia Bio Compatible Dental Materials Market Opportunity Assessment, By Material Type, 2022 & 2032F |
9.2 Latvia Bio Compatible Dental Materials Market Opportunity Assessment, By Application, 2022 & 2032F |
9.3 Latvia Bio Compatible Dental Materials Market Opportunity Assessment, By End User, 2022 & 2032F |
9.4 Latvia Bio Compatible Dental Materials Market Opportunity Assessment, By Source, 2022 & 2032F |
9.5 Latvia Bio Compatible Dental Materials Market Opportunity Assessment, By Environmental Impact, 2022 & 2032F |
10 Latvia Bio Compatible Dental Materials Market - Competitive Landscape |
10.1 Latvia Bio Compatible Dental Materials Market Revenue Share, By Companies, 2025 |
10.2 Latvia Bio Compatible Dental Materials Market Competitive Benchmarking, By Operating and Technical Parameters |
11 Company Profiles |
12 Recommendations |
13 Disclaimer |
Export potential assessment - trade Analytics for 2030
Export potential enables firms to identify high-growth global markets with greater confidence by combining advanced trade intelligence with a structured quantitative methodology. The framework analyzes emerging demand trends and country-level import patterns while integrating macroeconomic and trade datasets such as GDP and population forecasts, bilateral import–export flows, tariff structures, elasticity differentials between developed and developing economies, geographic distance, and import demand projections. Using weighted trade values from 2020–2024 as the base period to project country-to-country export potential for 2030, these inputs are operationalized through calculated drivers such as gravity model parameters, tariff impact factors, and projected GDP per-capita growth. Through an analysis of hidden potentials, demand hotspots, and market conditions that are most favorable to success, this method enables firms to focus on target countries, maximize returns, and global expansion with data, backed by accuracy.
By factoring in the projected importer demand gap that is currently unmet and could be potential opportunity, it identifies the potential for the Exporter (Country) among 190 countries, against the general trade analysis, which identifies the biggest importer or exporter.
To discover high-growth global markets and optimize your business strategy:
Click Here
Pricing
- Single User License$ 1,995
- Department License$ 2,400
- Site License$ 3,120
- Global License$ 3,795

Search
Thought Leadership and Analyst Meet


Our Clients
Latest Reports
- France Thermally Conductive Filler Dispersants Market (2026-2032) | Challenges, Restraints, Value, Share, Size, segmentation, Analysis, Trends, Investment Opportunities, Outlook, Pricing, Demand, Forecast, Revenue, Companies, Growth, Drivers, Strategy, Insights, Competition
- Egypt Thermally Conductive Filler Dispersants Market (2026-2032) | Competition, Forecast, Strategy, Value, Insights, Outlook, Investment Opportunities, Pricing, Demand, Share, segmentation, Drivers, Size, Companies, Restraints, Growth, Trends, Revenue, Challenges, Analysis
- Czech Republic Thermally Conductive Filler Dispersants Market (2026-2032) | Forecast, Pricing, Analysis, Drivers, Insights, Size, Demand, Growth, Challenges, segmentation, Competition, Outlook, Trends, Investment Opportunities, Companies, Strategy, Revenue, Share, Value, Restraints
- Colombia Thermally Conductive Filler Dispersants Market (2026-2032) | segmentation, Trends, Share, Drivers, Strategy, Companies, Demand, Insights, Size, Challenges, Value, Competition, Analysis, Growth, Revenue, Restraints, Forecast, Pricing, Outlook, Investment Opportunities
- China Thermally Conductive Filler Dispersants Market (2026-2032) | Restraints, Investment Opportunities, Pricing, Companies, Share, Size, Challenges, Trends, Outlook, Value, Analysis, Competition, Revenue, Drivers, Forecast, Demand, Insights, Growth, Strategy, segmentation
- Chile Thermally Conductive Filler Dispersants Market (2026-2032) | Investment Opportunities, Trends, Value, Restraints, Share, Companies, Forecast, segmentation, Pricing, Challenges, Demand, Size, Analysis, Drivers, Outlook, Growth, Competition, Strategy, Revenue, Insights
- Cambodia Thermally Conductive Filler Dispersants Market (2026-2032) | Analysis, Share, Outlook, Strategy, Pricing, Demand, Size, Growth, segmentation, Insights, Revenue, Forecast, Challenges, Competition, Companies, Investment Opportunities, Trends, Restraints, Value, Drivers
- Brazil Thermally Conductive Filler Dispersants Market (2026-2032) | Restraints, Forecast, Competition, Size, Revenue, Value, Investment Opportunities, Trends, Insights, Outlook, Growth, Analysis, Drivers, segmentation, Pricing, Challenges, Strategy, Share, Companies, Demand
- Bangladesh Thermally Conductive Filler Dispersants Market (2026-2032) | Restraints, Trends, Analysis, Competition, Insights, Forecast, Value, Investment Opportunities, Pricing, Share, Demand, Outlook, Revenue, segmentation, Companies, Drivers, Growth, Size, Challenges, Strategy
- Bahrain Thermally Conductive Filler Dispersants Market (2026-2032) | Trends, Outlook, Pricing, Demand, Value, Competition, Forecast, Growth, segmentation, Revenue, Companies, Analysis, Insights, Size, Drivers, Challenges, Strategy, Investment Opportunities, Share, Restraints
Industry Events and Analyst Meet

HIMTEX 2026

India Refining Summit 2026

India EV Show 2026

EV tech India Expo 2026

Auto Tech Asia 2026
Whitepaper
- Middle East & Africa Commercial Security Market Click here to view more.
- Middle East & Africa Fire Safety Systems & Equipment Market Click here to view more.
- GCC Drone Market Click here to view more.
- Middle East Lighting Fixture Market Click here to view more.
- GCC Physical & Perimeter Security Market Click here to view more.
6WResearch In News
- Doha a strategic location for EV manufacturing hub: IPA Qatar
- Demand for luxury TVs surging in the GCC, says Samsung
- Empowering Growth: The Thriving Journey of Bangladesh’s Cable Industry
- Demand for luxury TVs surging in the GCC, says Samsung
- Video call with a traditional healer? Once unthinkable, it’s now common in South Africa
- Intelligent Buildings To Smooth GCC’s Path To Net Zero