Latvia Edible Oils Market (2025-2031) | Industry, Trends, Revenue, Value, Segmentation, Companies, Forecast, Growth, Share, Outlook, Analysis & Size
Market Forecast By Type (Palm Oil, Soybean Oil, Sunflower Oil, Rapeseed Oil, Olive Oil), By Packaging Type (Pouches, Jars, Cans, Bottles), By End Use (Domestic, Food Service , Industrial) And Competitive Landscape
| Product Code: ETC5791121 | Publication Date: Nov 2023 | Updated Date: Apr 2026 | Product Type: Market Research Report | |
| Publisher: 6Wresearch | Author: Ravi Bhandari | No. of Pages: 60 | No. of Figures: 30 | No. of Tables: 5 |
Latvia Edible Oils Market Size (2020-2030)

Latvia Edible Oils Market has seen a decline in market size from €0.75 million in 2020 to €0.62 million in 2024, with a negative growth trend. The market is forecasted to continue shrinking, with an expected size of €0.40 million by 2030. The CAGR for the period 2022-24 stands at -8.96%, while for 2025-30, it is projected at -6.96%. The downturn can be attributed to changing consumer preferences towards healthier alternatives and increased competition in the market. To counter this trend, industry players are focusing on product innovation and marketing strategies to retain market share. Looking ahead, the Latvia Edible Oils Market is expected to witness advancements in sustainable sourcing practices and technological innovations to meet evolving consumer demands for eco-friendly products.
Latvia Edible Oils Market: Production & Trade Performance (2019-2025)
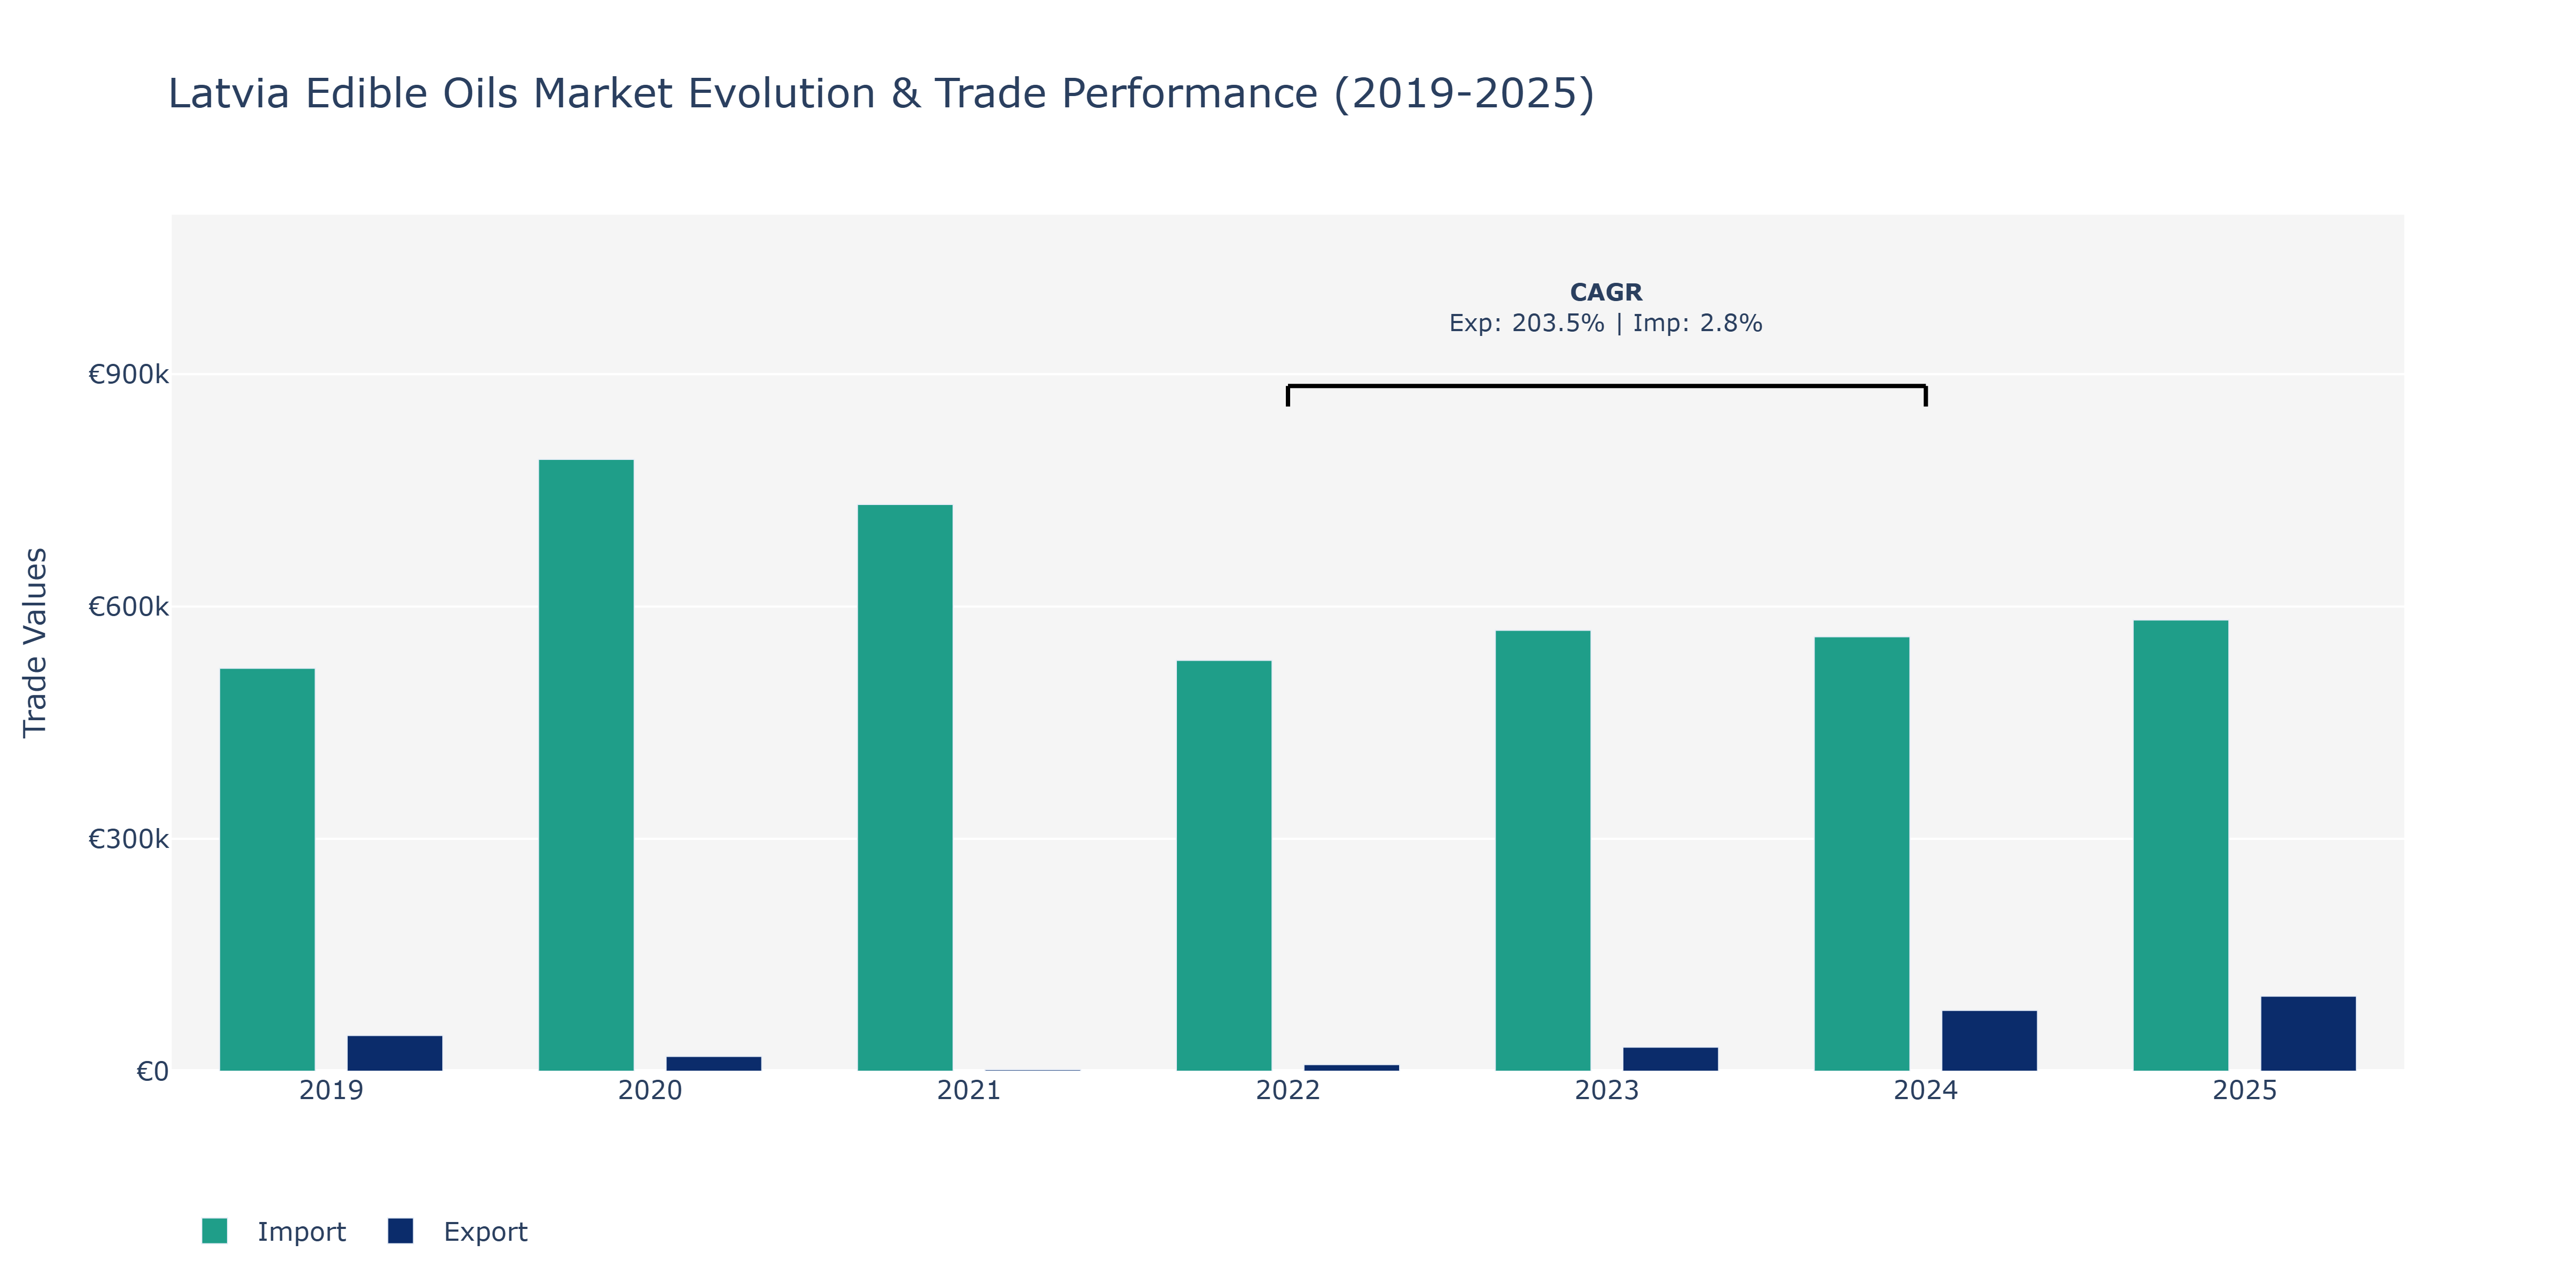
In the Latvia Edible Oils Market, exports experienced notable fluctuations over the years. Beginning at €46.08 thousand in 2019, the export value decreased sharply in 2020 to €19.09 thousand and further plummeted to €1.84 thousand in 2021 before rebounding in 2022 to €8.52 thousand. A substantial surge was witnessed in 2023, reaching €31.05 thousand, and peaking at €78.52 thousand in 2024. This significant growth could be attributed to increased demand for high-quality edible oils from foreign markets and improved production efficiency within the country. Conversely, imports demonstrated a more stable trend, starting at €520.3 thousand in 2019 and consistently decreasing to €561.02 thousand in 2024. The market's import dynamics may have been influenced by global price fluctuations of edible oils, trade agreements affecting import volumes, and shifts in consumer preferences towards domestically produced oils, aligning with the industry trend of promoting local products and sustainability practices.
Key Highlights of the Report:
- Latvia Edible Oils Market Outlook
- Market Size of Latvia Edible Oils Market, 2024
- Forecast of Latvia Edible Oils Market, 2031
- Historical Data and Forecast of Latvia Edible Oils Revenues & Volume for the Period 2021-2031
- Latvia Edible Oils Market Trend Evolution
- Latvia Edible Oils Market Drivers and Challenges
- Latvia Edible Oils Price Trends
- Latvia Edible Oils Porter`s Five Forces
- Latvia Edible Oils Industry Life Cycle
- Historical Data and Forecast of Latvia Edible Oils Market Revenues & Volume By Type for the Period 2021-2031
- Historical Data and Forecast of Latvia Edible Oils Market Revenues & Volume By Palm Oil for the Period 2021-2031
- Historical Data and Forecast of Latvia Edible Oils Market Revenues & Volume By Soybean Oil for the Period 2021-2031
- Historical Data and Forecast of Latvia Edible Oils Market Revenues & Volume By Sunflower Oil for the Period 2021-2031
- Historical Data and Forecast of Latvia Edible Oils Market Revenues & Volume By Rapeseed Oil for the Period 2021-2031
- Historical Data and Forecast of Latvia Edible Oils Market Revenues & Volume By Olive Oil for the Period 2021-2031
- Historical Data and Forecast of Latvia Edible Oils Market Revenues & Volume By Packaging Type for the Period 2021-2031
- Historical Data and Forecast of Latvia Edible Oils Market Revenues & Volume By Pouches for the Period 2021-2031
- Historical Data and Forecast of Latvia Edible Oils Market Revenues & Volume By Jars for the Period 2021-2031
- Historical Data and Forecast of Latvia Edible Oils Market Revenues & Volume By Cans for the Period 2021-2031
- Historical Data and Forecast of Latvia Edible Oils Market Revenues & Volume By Bottles for the Period 2021-2031
- Historical Data and Forecast of Latvia Edible Oils Market Revenues & Volume By End Use for the Period 2021-2031
- Historical Data and Forecast of Latvia Edible Oils Market Revenues & Volume By Domestic for the Period 2021-2031
- Historical Data and Forecast of Latvia Edible Oils Market Revenues & Volume By Food Service for the Period 2021-2031
- Historical Data and Forecast of Latvia Edible Oils Market Revenues & Volume By Industrial for the Period 2021-2031
- Latvia Edible Oils Import Export Trade Statistics
- Market Opportunity Assessment By Type
- Market Opportunity Assessment By Packaging Type
- Market Opportunity Assessment By End Use
- Latvia Edible Oils Top Companies Market Share
- Latvia Edible Oils Competitive Benchmarking By Technical and Operational Parameters
- Latvia Edible Oils Company Profiles
- Latvia Edible Oils Key Strategic Recommendations
Frequently Asked Questions About the Market Study (FAQs):
6Wresearch actively monitors the Latvia Edible Oils Market and publishes its comprehensive annual report, highlighting emerging trends, growth drivers, revenue analysis, and forecast outlook. Our insights help businesses to make data-backed strategic decisions with ongoing market dynamics. Our analysts track relevent industries related to the Latvia Edible Oils Market, allowing our clients with actionable intelligence and reliable forecasts tailored to emerging regional needs.
Yes, we provide customisation as per your requirements. To learn more, feel free to contact us on sales@6wresearch.com
1 Executive Summary |
2 Introduction |
2.1 Key Highlights of the Report |
2.2 Report Description |
2.3 Market Scope & Segmentation |
2.4 Research Methodology |
2.5 Assumptions |
3 Latvia Edible Oils Market Overview |
3.1 Latvia Country Macro Economic Indicators |
3.2 Latvia Edible Oils Market Revenues & Volume, 2021 & 2031F |
3.3 Latvia Edible Oils Market - Industry Life Cycle |
3.4 Latvia Edible Oils Market - Porter's Five Forces |
3.5 Latvia Edible Oils Market Revenues & Volume Share, By Type, 2021 & 2031F |
3.6 Latvia Edible Oils Market Revenues & Volume Share, By Packaging Type, 2021 & 2031F |
3.7 Latvia Edible Oils Market Revenues & Volume Share, By End Use, 2021 & 2031F |
4 Latvia Edible Oils Market Dynamics |
4.1 Impact Analysis |
4.2 Market Drivers |
4.2.1 Increasing awareness about the health benefits of using edible oils |
4.2.2 Growing demand for organic and natural edible oils |
4.2.3 Rising disposable income leading to higher spending on premium edible oils |
4.3 Market Restraints |
4.3.1 Fluctuating prices of raw materials such as seeds and nuts |
4.3.2 Stringent government regulations on food processing and labeling |
4.3.3 Intense competition among edible oil manufacturers |
5 Latvia Edible Oils Market Trends |
6 Latvia Edible Oils Market Segmentations |
6.1 Latvia Edible Oils Market, By Type |
6.1.1 Overview and Analysis |
6.1.2 Latvia Edible Oils Market Revenues & Volume, By Palm Oil, 2021-2031F |
6.1.3 Latvia Edible Oils Market Revenues & Volume, By Soybean Oil, 2021-2031F |
6.1.4 Latvia Edible Oils Market Revenues & Volume, By Sunflower Oil, 2021-2031F |
6.1.5 Latvia Edible Oils Market Revenues & Volume, By Rapeseed Oil, 2021-2031F |
6.1.6 Latvia Edible Oils Market Revenues & Volume, By Olive Oil, 2021-2031F |
6.2 Latvia Edible Oils Market, By Packaging Type |
6.2.1 Overview and Analysis |
6.2.2 Latvia Edible Oils Market Revenues & Volume, By Pouches, 2021-2031F |
6.2.3 Latvia Edible Oils Market Revenues & Volume, By Jars, 2021-2031F |
6.2.4 Latvia Edible Oils Market Revenues & Volume, By Cans, 2021-2031F |
6.2.5 Latvia Edible Oils Market Revenues & Volume, By Bottles, 2021-2031F |
6.3 Latvia Edible Oils Market, By End Use |
6.3.1 Overview and Analysis |
6.3.2 Latvia Edible Oils Market Revenues & Volume, By Domestic, 2021-2031F |
6.3.3 Latvia Edible Oils Market Revenues & Volume, By Food Service , 2021-2031F |
6.3.4 Latvia Edible Oils Market Revenues & Volume, By Industrial, 2021-2031F |
7 Latvia Edible Oils Market Import-Export Trade Statistics |
7.1 Latvia Edible Oils Market Export to Major Countries |
7.2 Latvia Edible Oils Market Imports from Major Countries |
8 Latvia Edible Oils Market Key Performance Indicators |
8.1 Consumer preference for healthier cooking oils |
8.2 Adoption rate of organic edible oils in the market |
8.3 Retail sales of premium edible oils |
8.4 Consumer feedback and ratings on product quality and packaging |
8.5 Percentage of market share held by domestic manufacturers |
9 Latvia Edible Oils Market - Opportunity Assessment |
9.1 Latvia Edible Oils Market Opportunity Assessment, By Type, 2021 & 2031F |
9.2 Latvia Edible Oils Market Opportunity Assessment, By Packaging Type, 2021 & 2031F |
9.3 Latvia Edible Oils Market Opportunity Assessment, By End Use, 2021 & 2031F |
10 Latvia Edible Oils Market - Competitive Landscape |
10.1 Latvia Edible Oils Market Revenue Share, By Companies, 2024 |
10.2 Latvia Edible Oils Market Competitive Benchmarking, By Operating and Technical Parameters |
11 Company Profiles |
12 Recommendations | 13 Disclaimer |
Export potential assessment - trade Analytics for 2030
Export potential enables firms to identify high-growth global markets with greater confidence by combining advanced trade intelligence with a structured quantitative methodology. The framework analyzes emerging demand trends and country-level import patterns while integrating macroeconomic and trade datasets such as GDP and population forecasts, bilateral import–export flows, tariff structures, elasticity differentials between developed and developing economies, geographic distance, and import demand projections. Using weighted trade values from 2020–2024 as the base period to project country-to-country export potential for 2030, these inputs are operationalized through calculated drivers such as gravity model parameters, tariff impact factors, and projected GDP per-capita growth. Through an analysis of hidden potentials, demand hotspots, and market conditions that are most favorable to success, this method enables firms to focus on target countries, maximize returns, and global expansion with data, backed by accuracy.
By factoring in the projected importer demand gap that is currently unmet and could be potential opportunity, it identifies the potential for the Exporter (Country) among 190 countries, against the general trade analysis, which identifies the biggest importer or exporter.
To discover high-growth global markets and optimize your business strategy:
Click Here
Pricing
- Single User License$ 1,995
- Department License$ 2,400
- Site License$ 3,120
- Global License$ 3,795

Search
Thought Leadership and Analyst Meet


Our Clients
Latest Reports
- France Thermally Conductive Filler Dispersants Market (2026-2032) | Challenges, Restraints, Value, Share, Size, segmentation, Analysis, Trends, Investment Opportunities, Outlook, Pricing, Demand, Forecast, Revenue, Companies, Growth, Drivers, Strategy, Insights, Competition
- Egypt Thermally Conductive Filler Dispersants Market (2026-2032) | Competition, Forecast, Strategy, Value, Insights, Outlook, Investment Opportunities, Pricing, Demand, Share, segmentation, Drivers, Size, Companies, Restraints, Growth, Trends, Revenue, Challenges, Analysis
- Czech Republic Thermally Conductive Filler Dispersants Market (2026-2032) | Forecast, Pricing, Analysis, Drivers, Insights, Size, Demand, Growth, Challenges, segmentation, Competition, Outlook, Trends, Investment Opportunities, Companies, Strategy, Revenue, Share, Value, Restraints
- Colombia Thermally Conductive Filler Dispersants Market (2026-2032) | segmentation, Trends, Share, Drivers, Strategy, Companies, Demand, Insights, Size, Challenges, Value, Competition, Analysis, Growth, Revenue, Restraints, Forecast, Pricing, Outlook, Investment Opportunities
- China Thermally Conductive Filler Dispersants Market (2026-2032) | Restraints, Investment Opportunities, Pricing, Companies, Share, Size, Challenges, Trends, Outlook, Value, Analysis, Competition, Revenue, Drivers, Forecast, Demand, Insights, Growth, Strategy, segmentation
- Chile Thermally Conductive Filler Dispersants Market (2026-2032) | Investment Opportunities, Trends, Value, Restraints, Share, Companies, Forecast, segmentation, Pricing, Challenges, Demand, Size, Analysis, Drivers, Outlook, Growth, Competition, Strategy, Revenue, Insights
- Cambodia Thermally Conductive Filler Dispersants Market (2026-2032) | Analysis, Share, Outlook, Strategy, Pricing, Demand, Size, Growth, segmentation, Insights, Revenue, Forecast, Challenges, Competition, Companies, Investment Opportunities, Trends, Restraints, Value, Drivers
- Brazil Thermally Conductive Filler Dispersants Market (2026-2032) | Restraints, Forecast, Competition, Size, Revenue, Value, Investment Opportunities, Trends, Insights, Outlook, Growth, Analysis, Drivers, segmentation, Pricing, Challenges, Strategy, Share, Companies, Demand
- Bangladesh Thermally Conductive Filler Dispersants Market (2026-2032) | Restraints, Trends, Analysis, Competition, Insights, Forecast, Value, Investment Opportunities, Pricing, Share, Demand, Outlook, Revenue, segmentation, Companies, Drivers, Growth, Size, Challenges, Strategy
- Bahrain Thermally Conductive Filler Dispersants Market (2026-2032) | Trends, Outlook, Pricing, Demand, Value, Competition, Forecast, Growth, segmentation, Revenue, Companies, Analysis, Insights, Size, Drivers, Challenges, Strategy, Investment Opportunities, Share, Restraints
Industry Events and Analyst Meet

HIMTEX 2026

India Refining Summit 2026

India EV Show 2026

EV tech India Expo 2026

Auto Tech Asia 2026
Whitepaper
- Middle East & Africa Commercial Security Market Click here to view more.
- Middle East & Africa Fire Safety Systems & Equipment Market Click here to view more.
- GCC Drone Market Click here to view more.
- Middle East Lighting Fixture Market Click here to view more.
- GCC Physical & Perimeter Security Market Click here to view more.
6WResearch In News
- Doha a strategic location for EV manufacturing hub: IPA Qatar
- Demand for luxury TVs surging in the GCC, says Samsung
- Empowering Growth: The Thriving Journey of Bangladesh’s Cable Industry
- Demand for luxury TVs surging in the GCC, says Samsung
- Video call with a traditional healer? Once unthinkable, it’s now common in South Africa
- Intelligent Buildings To Smooth GCC’s Path To Net Zero