Latvia Mini Powder Puff Market (2026-2032) | Analysis, Size, Industry, Share, Segmentation, Value, Revenue, Forecast, Companies, Trends, Outlook & Growth
Market Forecast By Product Type (Wet Puff, Dry Puff), By Applications (Daliy Use, Performing Use) And Competitive Landscape
| Product Code: ETC5100737 | Publication Date: Nov 2023 | Updated Date: Apr 2026 | Product Type: Market Research Report | |
| Publisher: 6Wresearch | Author: Shubham Padhi | No. of Pages: 60 | No. of Figures: 30 | No. of Tables: 5 |
Latvia Mini Powder Puff Market Size (2020-2030)
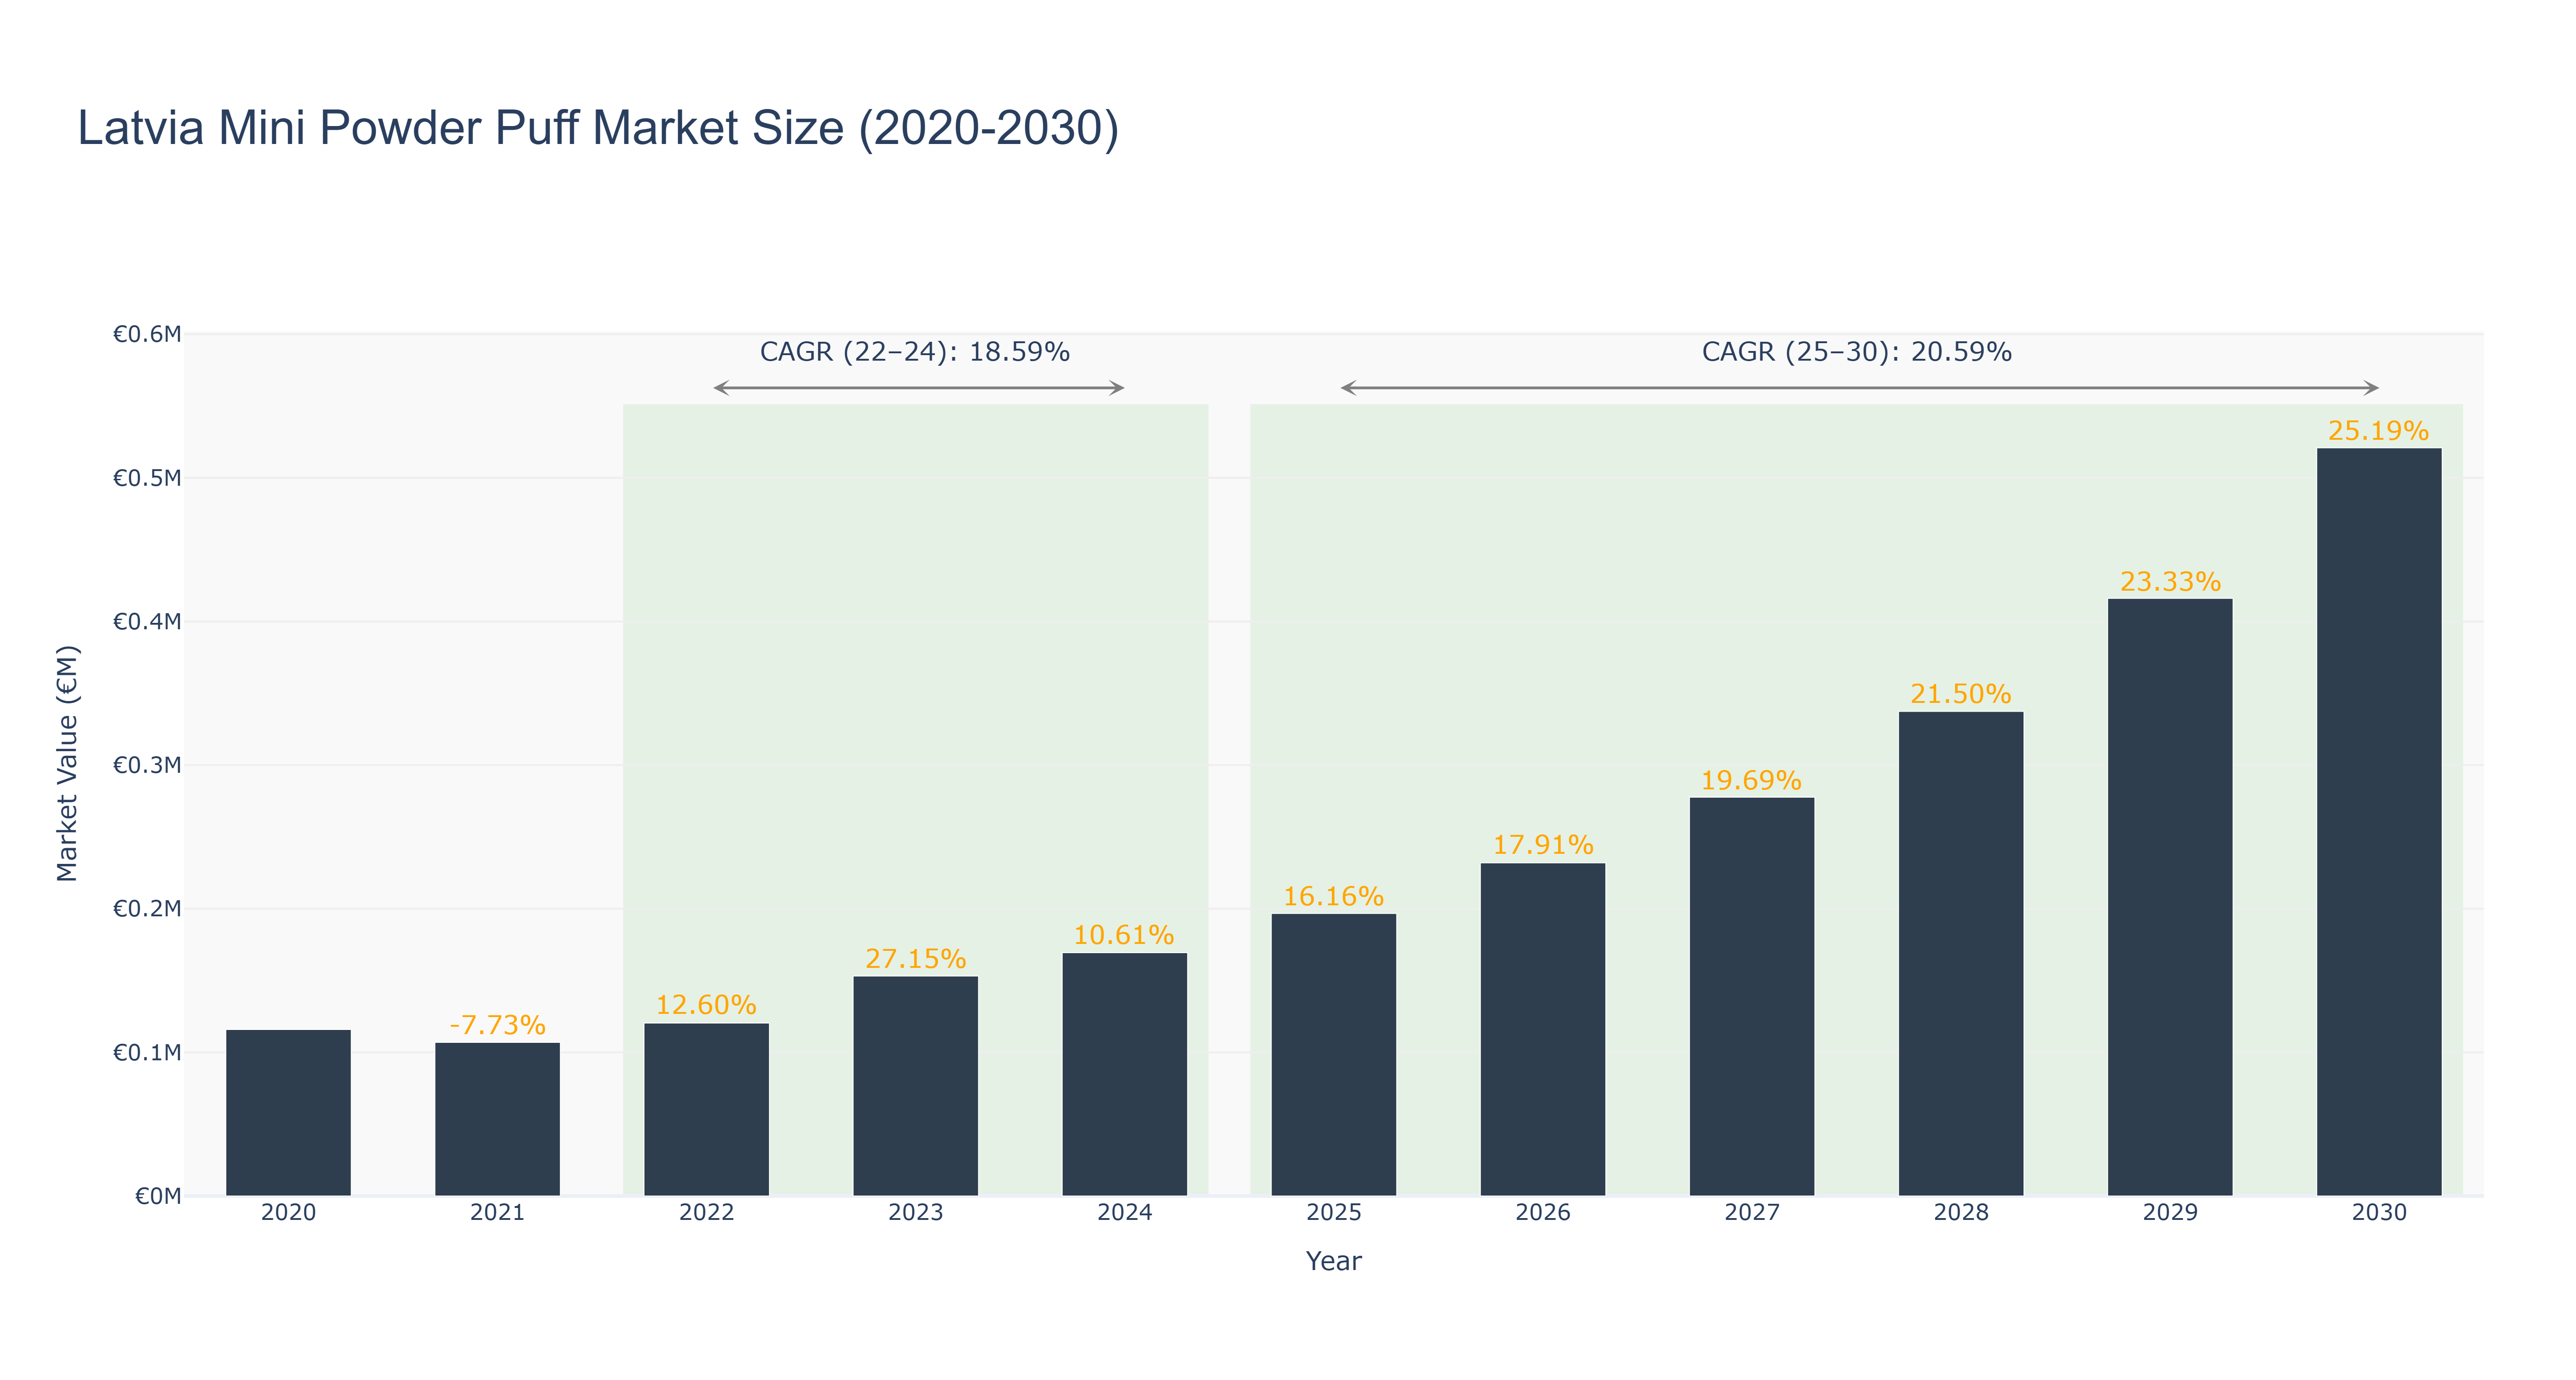
Latvia Mini Powder Puff Market has shown a steady growth trajectory over the years. The market size peaked at €0.52 million in 2030, with a notable increase in growth rates post-2024. From 2020 to 2024, the market size ranged from €0.12 million to €0.17 million, showcasing a gradual incline. The forecasted market size from 2025 to 2030 is expected to continue this positive trend, with a Compound Annual Growth Rate (CAGR) of 20.59% from 2025-2030. The market's growth can be attributed to increasing consumer demand for mini powder puff products, coupled with strategic marketing initiatives by key players in the industry. Looking ahead, upcoming developments in the Latvia Mini Powder Puff Market include the introduction of innovative product variants and expansion into new distribution channels to cater to a wider customer base.
Latvia Mini Powder Puff Market: Production & Trade Performance (2019-2025)
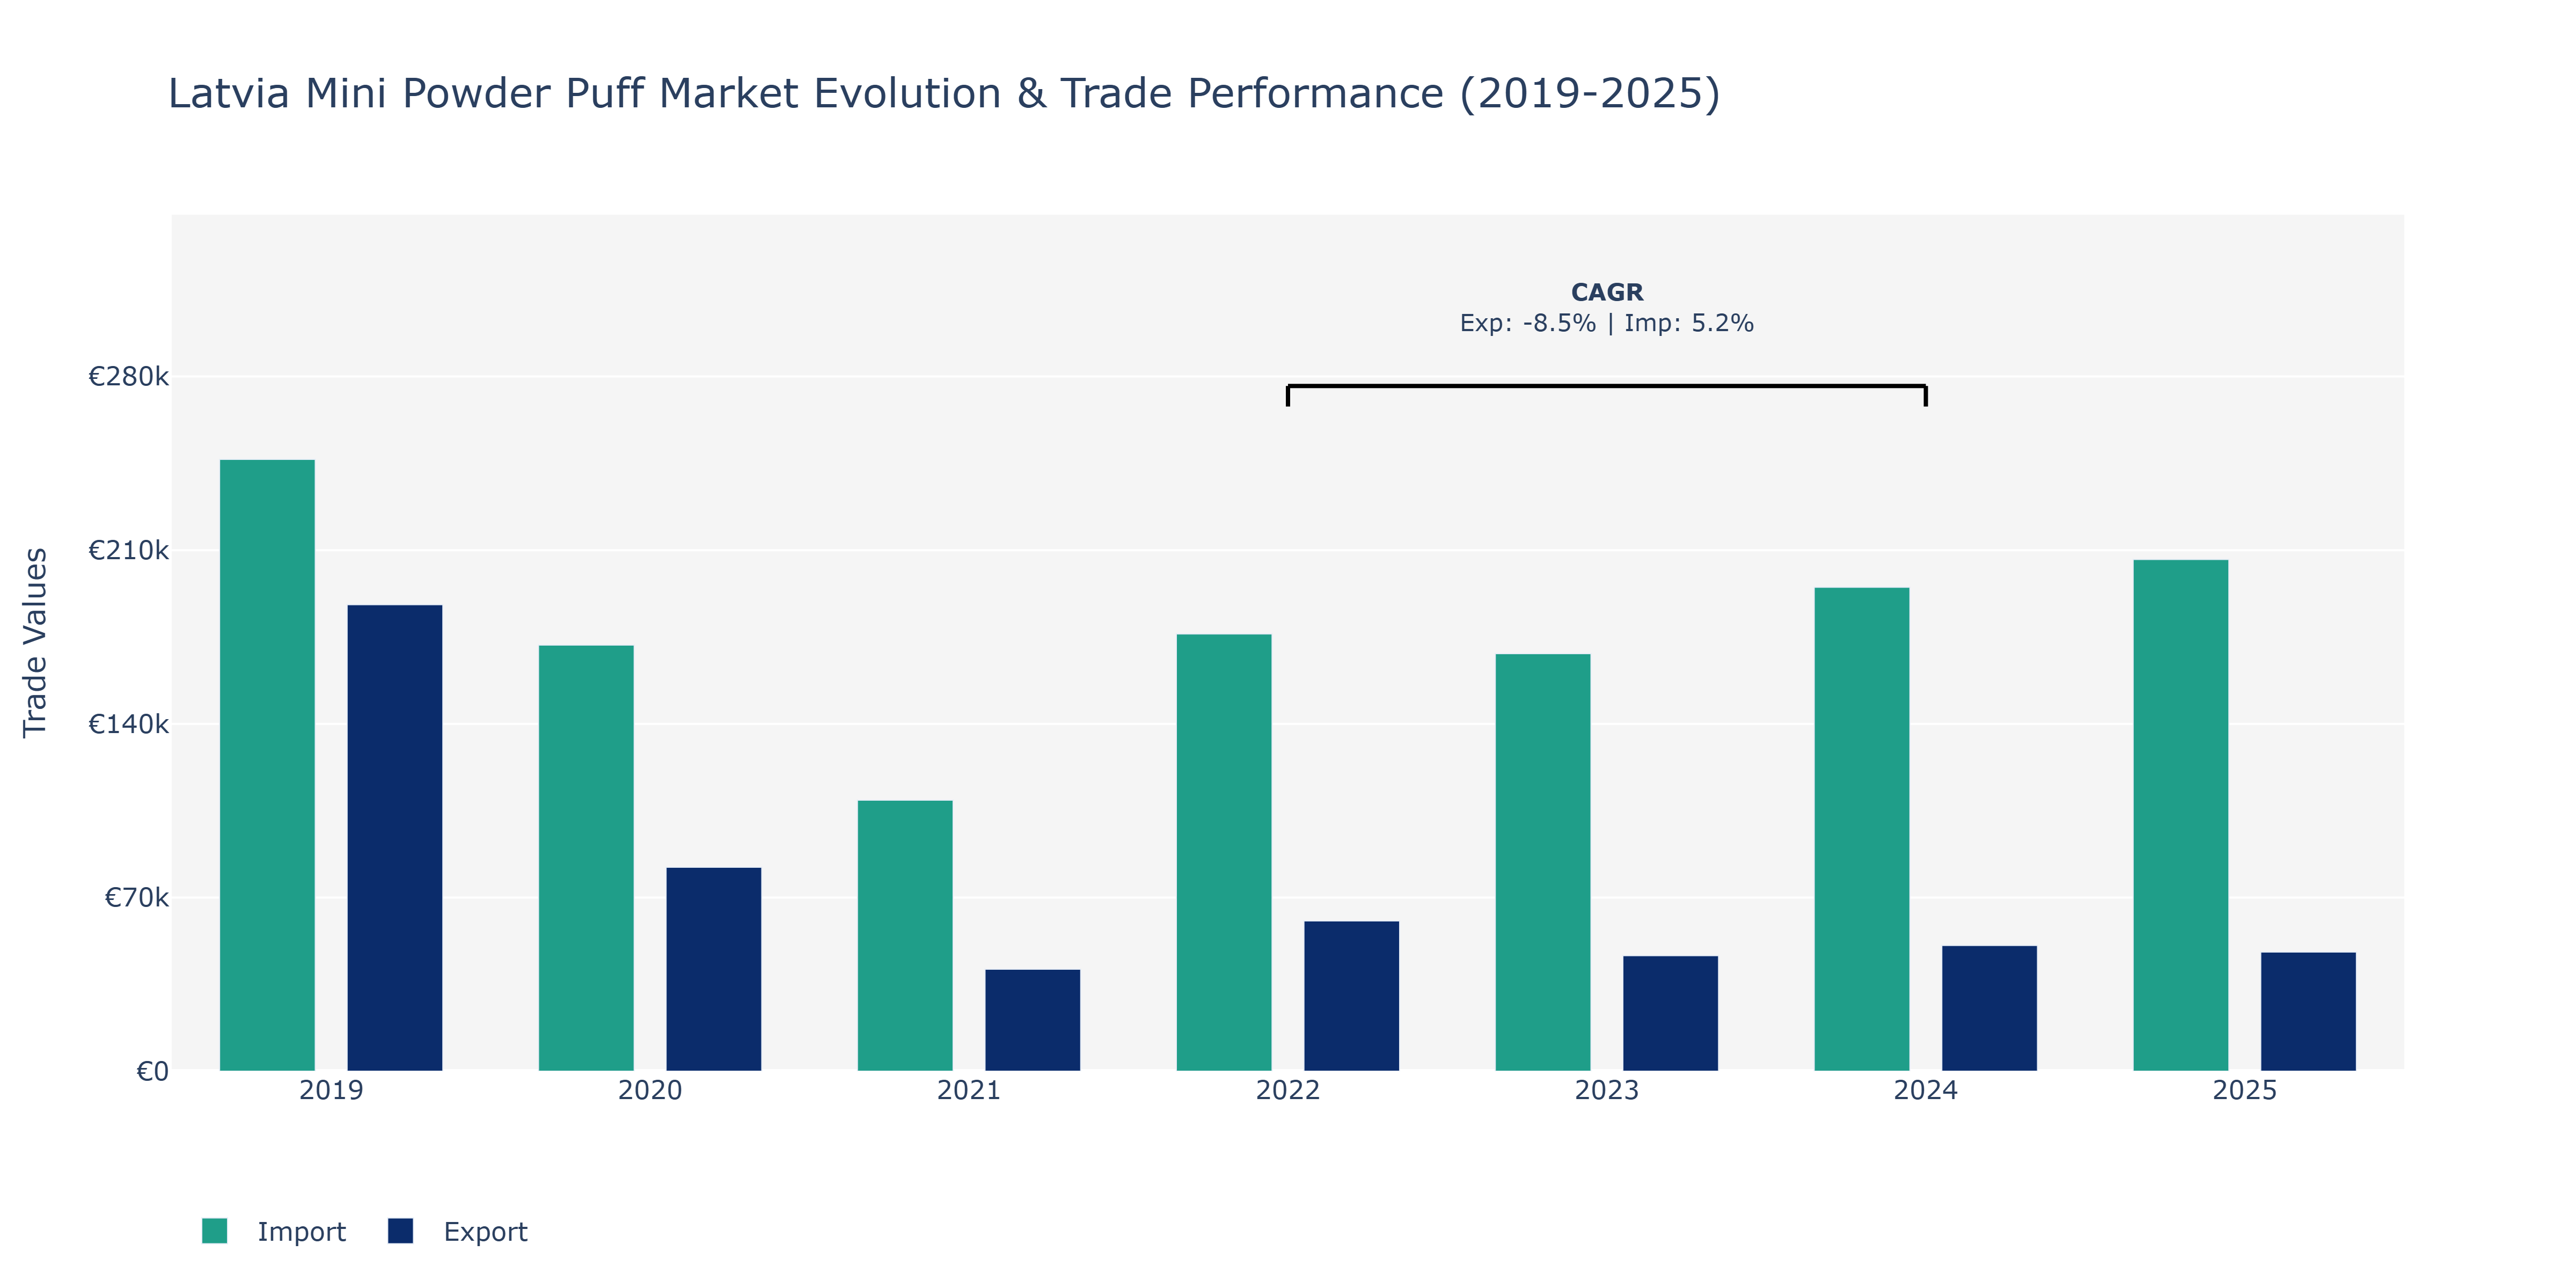
In the Latvia Mini Powder Puff Market, exports and imports displayed notable fluctuations over the years. In 2019, exports were at €188.02 thousand, seeing a substantial decrease to €82.17 thousand in 2020, likely impacted by global economic uncertainties. A further decline to €41.09 thousand in 2021 may reflect challenges in market demand or supply chain disruptions. However, a slight recovery was observed in 2022, reaching €60.58 thousand, possibly indicating strategic efforts to reinvigorate export activities. Conversely, imports followed a different trajectory, increasing from €246.59 thousand in 2019 to peak at €206.23 thousand in 2025. This upward trend suggests a growing market for imported mini powder puffs, potentially driven by consumer preferences for a wider range of products or improvements in distribution networks. The varying trends in exports and imports could be influenced by shifts in consumer preferences, competitive pricing strategies, or regulatory changes impacting trade dynamics within the beauty industry.
Key Highlights of the Report:
- Latvia Mini Powder Puff Market Outlook
- Market Size of Latvia Mini Powder Puff Market, 2025
- Forecast of Latvia Mini Powder Puff Market, 2032
- Historical Data and Forecast of Latvia Mini Powder Puff Revenues & Volume for the Period 2022 - 2032F
- Latvia Mini Powder Puff Market Trend Evolution
- Latvia Mini Powder Puff Market Drivers and Challenges
- Latvia Mini Powder Puff Price Trends
- Latvia Mini Powder Puff Porter`s Five Forces
- Latvia Mini Powder Puff Industry Life Cycle
- Historical Data and Forecast of Latvia Mini Powder Puff Market Revenues & Volume By Product Type for the Period 2022 - 2032F
- Historical Data and Forecast of Latvia Mini Powder Puff Market Revenues & Volume By Wet Puff for the Period 2022 - 2032F
- Historical Data and Forecast of Latvia Mini Powder Puff Market Revenues & Volume By Dry Puff for the Period 2022 - 2032F
- Historical Data and Forecast of Latvia Mini Powder Puff Market Revenues & Volume By Applications for the Period 2022 - 2032F
- Historical Data and Forecast of Latvia Mini Powder Puff Market Revenues & Volume By Daliy Use for the Period 2022 - 2032F
- Historical Data and Forecast of Latvia Mini Powder Puff Market Revenues & Volume By Performing Use for the Period 2022 - 2032F
- Latvia Mini Powder Puff Import Export Trade Statistics
- Market Opportunity Assessment By Product Type
- Market Opportunity Assessment By Applications
- Latvia Mini Powder Puff Top Companies Market Share
- Latvia Mini Powder Puff Competitive Benchmarking By Technical and Operational Parameters
- Latvia Mini Powder Puff Company Profiles
- Latvia Mini Powder Puff Key Strategic Recommendations
Frequently Asked Questions About the Market Study (FAQs):
6Wresearch actively monitors the Latvia Mini Powder Puff Market and publishes its comprehensive annual report, highlighting emerging trends, growth drivers, revenue analysis, and forecast outlook. Our insights help businesses to make data-backed strategic decisions with ongoing market dynamics. Our analysts track relevent industries related to the Latvia Mini Powder Puff Market, allowing our clients with actionable intelligence and reliable forecasts tailored to emerging regional needs.
Yes, we provide customisation as per your requirements. To learn more, feel free to contact us on sales@6wresearch.com
1 Executive Summary |
2 Introduction |
2.1 Key Highlights of the Report |
2.2 Report Description |
2.3 Market Scope & Segmentation |
2.4 Research Methodology |
2.5 Assumptions |
3 Latvia Mini Powder Puff Market Overview |
3.1 Latvia Country Macro Economic Indicators |
3.2 Latvia Mini Powder Puff Market Revenues & Volume, 2022 & 2032F |
3.3 Latvia Mini Powder Puff Market - Industry Life Cycle |
3.4 Latvia Mini Powder Puff Market - Porter's Five Forces |
3.5 Latvia Mini Powder Puff Market Revenues & Volume Share, By Product Type, 2022 & 2032F |
3.6 Latvia Mini Powder Puff Market Revenues & Volume Share, By Applications, 2022 & 2032F |
4 Latvia Mini Powder Puff Market Dynamics |
4.1 Impact Analysis |
4.2 Market Drivers |
4.2.1 Increasing demand for beauty and cosmetic products in Latvia |
4.2.2 Growing trend of self-care and grooming among consumers |
4.2.3 Rising popularity of natural and organic beauty products in the market |
4.3 Market Restraints |
4.3.1 Intense competition from established and new players in the beauty industry |
4.3.2 Fluctuating raw material prices impacting production costs |
5 Latvia Mini Powder Puff Market Trends |
6 Latvia Mini Powder Puff Market Segmentations |
6.1 Latvia Mini Powder Puff Market, By Product Type |
6.1.1 Overview and Analysis |
6.1.2 Latvia Mini Powder Puff Market Revenues & Volume, By Wet Puff, 2022 - 2032F |
6.1.3 Latvia Mini Powder Puff Market Revenues & Volume, By Dry Puff, 2022 - 2032F |
6.2 Latvia Mini Powder Puff Market, By Applications |
6.2.1 Overview and Analysis |
6.2.2 Latvia Mini Powder Puff Market Revenues & Volume, By Daliy Use, 2022 - 2032F |
6.2.3 Latvia Mini Powder Puff Market Revenues & Volume, By Performing Use, 2022 - 2032F |
7 Latvia Mini Powder Puff Market Import-Export Trade Statistics |
7.1 Latvia Mini Powder Puff Market Export to Major Countries |
7.2 Latvia Mini Powder Puff Market Imports from Major Countries |
8 Latvia Mini Powder Puff Market Key Performance Indicators |
8.1 Consumer engagement on social media platforms |
8.2 Number of new product launches in the mini powder puff segment |
8.3 Customer satisfaction levels with the product quality and performance |
8.4 Percentage of repeat purchases by customers |
8.5 Average time taken to bring a new product from concept to market |
9 Latvia Mini Powder Puff Market - Opportunity Assessment |
9.1 Latvia Mini Powder Puff Market Opportunity Assessment, By Product Type, 2022 & 2032F |
9.2 Latvia Mini Powder Puff Market Opportunity Assessment, By Applications, 2022 & 2032F |
10 Latvia Mini Powder Puff Market - Competitive Landscape |
10.1 Latvia Mini Powder Puff Market Revenue Share, By Companies, 2025 |
10.2 Latvia Mini Powder Puff Market Competitive Benchmarking, By Operating and Technical Parameters |
11 Company Profiles |
12 Recommendations | 13 Disclaimer |
Global Go To Market Strategy - 2030
Export potential enables firms to identify high-growth global markets with greater confidence by combining advanced trade intelligence with a structured quantitative methodology. The framework analyzes emerging demand trends and country-level import patterns while integrating macroeconomic and trade datasets such as GDP and population forecasts, bilateral import–export flows, tariff structures, elasticity differentials between developed and developing economies, geographic distance, and import demand projections. Using weighted trade values from 2020–2024 as the base period to project country-to-country export potential for 2030, these inputs are operationalized through calculated drivers such as gravity model parameters, tariff impact factors, and projected GDP per-capita growth. Through an analysis of hidden potentials, demand hotspots, and market conditions that are most favorable to success, this method enables firms to focus on target countries, maximize returns, and global expansion with data, backed by accuracy.
By factoring in the projected importer demand gap that is currently unmet and could be potential opportunity, it identifies the potential for the Exporter (Country) among 190 countries, against the general trade analysis, which identifies the biggest importer or exporter.
To discover high-growth global markets and optimize your business strategy:
Click Here
Pricing
- Single User License$ 1,995
- Department License$ 2,400
- Site License$ 3,120
- Global License$ 3,795

Leadership Perspectives from Industry Events
Search
Thought Leadership and Analyst Meet


Our Clients
6WResearch In News
- India Export Attractiveness Tracker 2026
- India Air Conditioner Market Set for Strong Rebound in 2026 After Weather-Led Correction and GST-Driven Recovery: 6Wresearch
- ADAS in India: How Automatic Emergency Braking, Blind Spot Detection & Driver Monitoring are Transforming Road Safety
- Doha a strategic location for EV manufacturing hub: IPA Qatar
- Demand for luxury TVs surging in the GCC, says Samsung
- Empowering Growth: The Thriving Journey of Bangladesh’s Cable Industry
Latest Reports
- Nicaragua RPG Gaming Market (2026-2032)
- New Zealand RPG Gaming Market (2026-2032)
- Netherlands RPG Gaming Market (2026-2032)
- Nauru RPG Gaming Market (2026-2032)
- Namibia RPG Gaming Market (2026-2032)
- Mozambique RPG Gaming Market (2026-2032)
- Montenegro RPG Gaming Market (2026-2032)
- Mongolia RPG Gaming Market (2026-2032)
- Monaco RPG Gaming Market (2026-2032)
- Micronesia RPG Gaming Market (2026-2032)
Industry Events and Analyst Meet

EV India Expo 2026

HIMTEX 2026

India Refining Summit 2026

India EV Show 2026

EV tech India Expo 2026
Whitepaper
- Middle East & Africa Commercial Security Market Click here to view more.
- Middle East & Africa Fire Safety Systems & Equipment Market Click here to view more.
- GCC Drone Market Click here to view more.
- Middle East Lighting Fixture Market Click here to view more.
- GCC Physical & Perimeter Security Market Click here to view more.