Latvia Processed Cheese Market (2026-2032) | Analysis, Trends, Size, Growth, Value, Segmentation, Outlook, Forecast, Industry, Share, Revenue & Companies
Market Forecast By Cheese Type (Blue Cheese, Brick Cheese, Camembert Cheese, Cheddar Cheese, Cottage Cheese, Cream Cheese, Mozerella Cheese, Other Processed Cheese), By Form (Cheese Blocks, Traingle, Rectangle, Circle, Square, Cheese Slice, Cheese Spread, Cheese Spray), By Milk Source (Cattle Milk, Goat Milk, Sheep Milk), By End Use (Retail / Household, HoReCa, F&B Processors, Snacks Manufacturers, Bakery and Confectionery Product Manufacturers, Sauces and Condiment Manufacturers, Ready Meal Manufacturers, Other F&B Processors), By Distribution (Direct Sales (B2B), Hypermarkets and Supermarkets, Club Stores, Discounters, Grocery Retailers, Convenience Stores, Online Stores) And Competitive Landscape
| Product Code: ETC4848436 | Publication Date: Nov 2023 | Updated Date: Apr 2026 | Product Type: Market Research Report | |
| Publisher: 6Wresearch | Author: Shubham Padhi | No. of Pages: 60 | No. of Figures: 30 | No. of Tables: 5 |
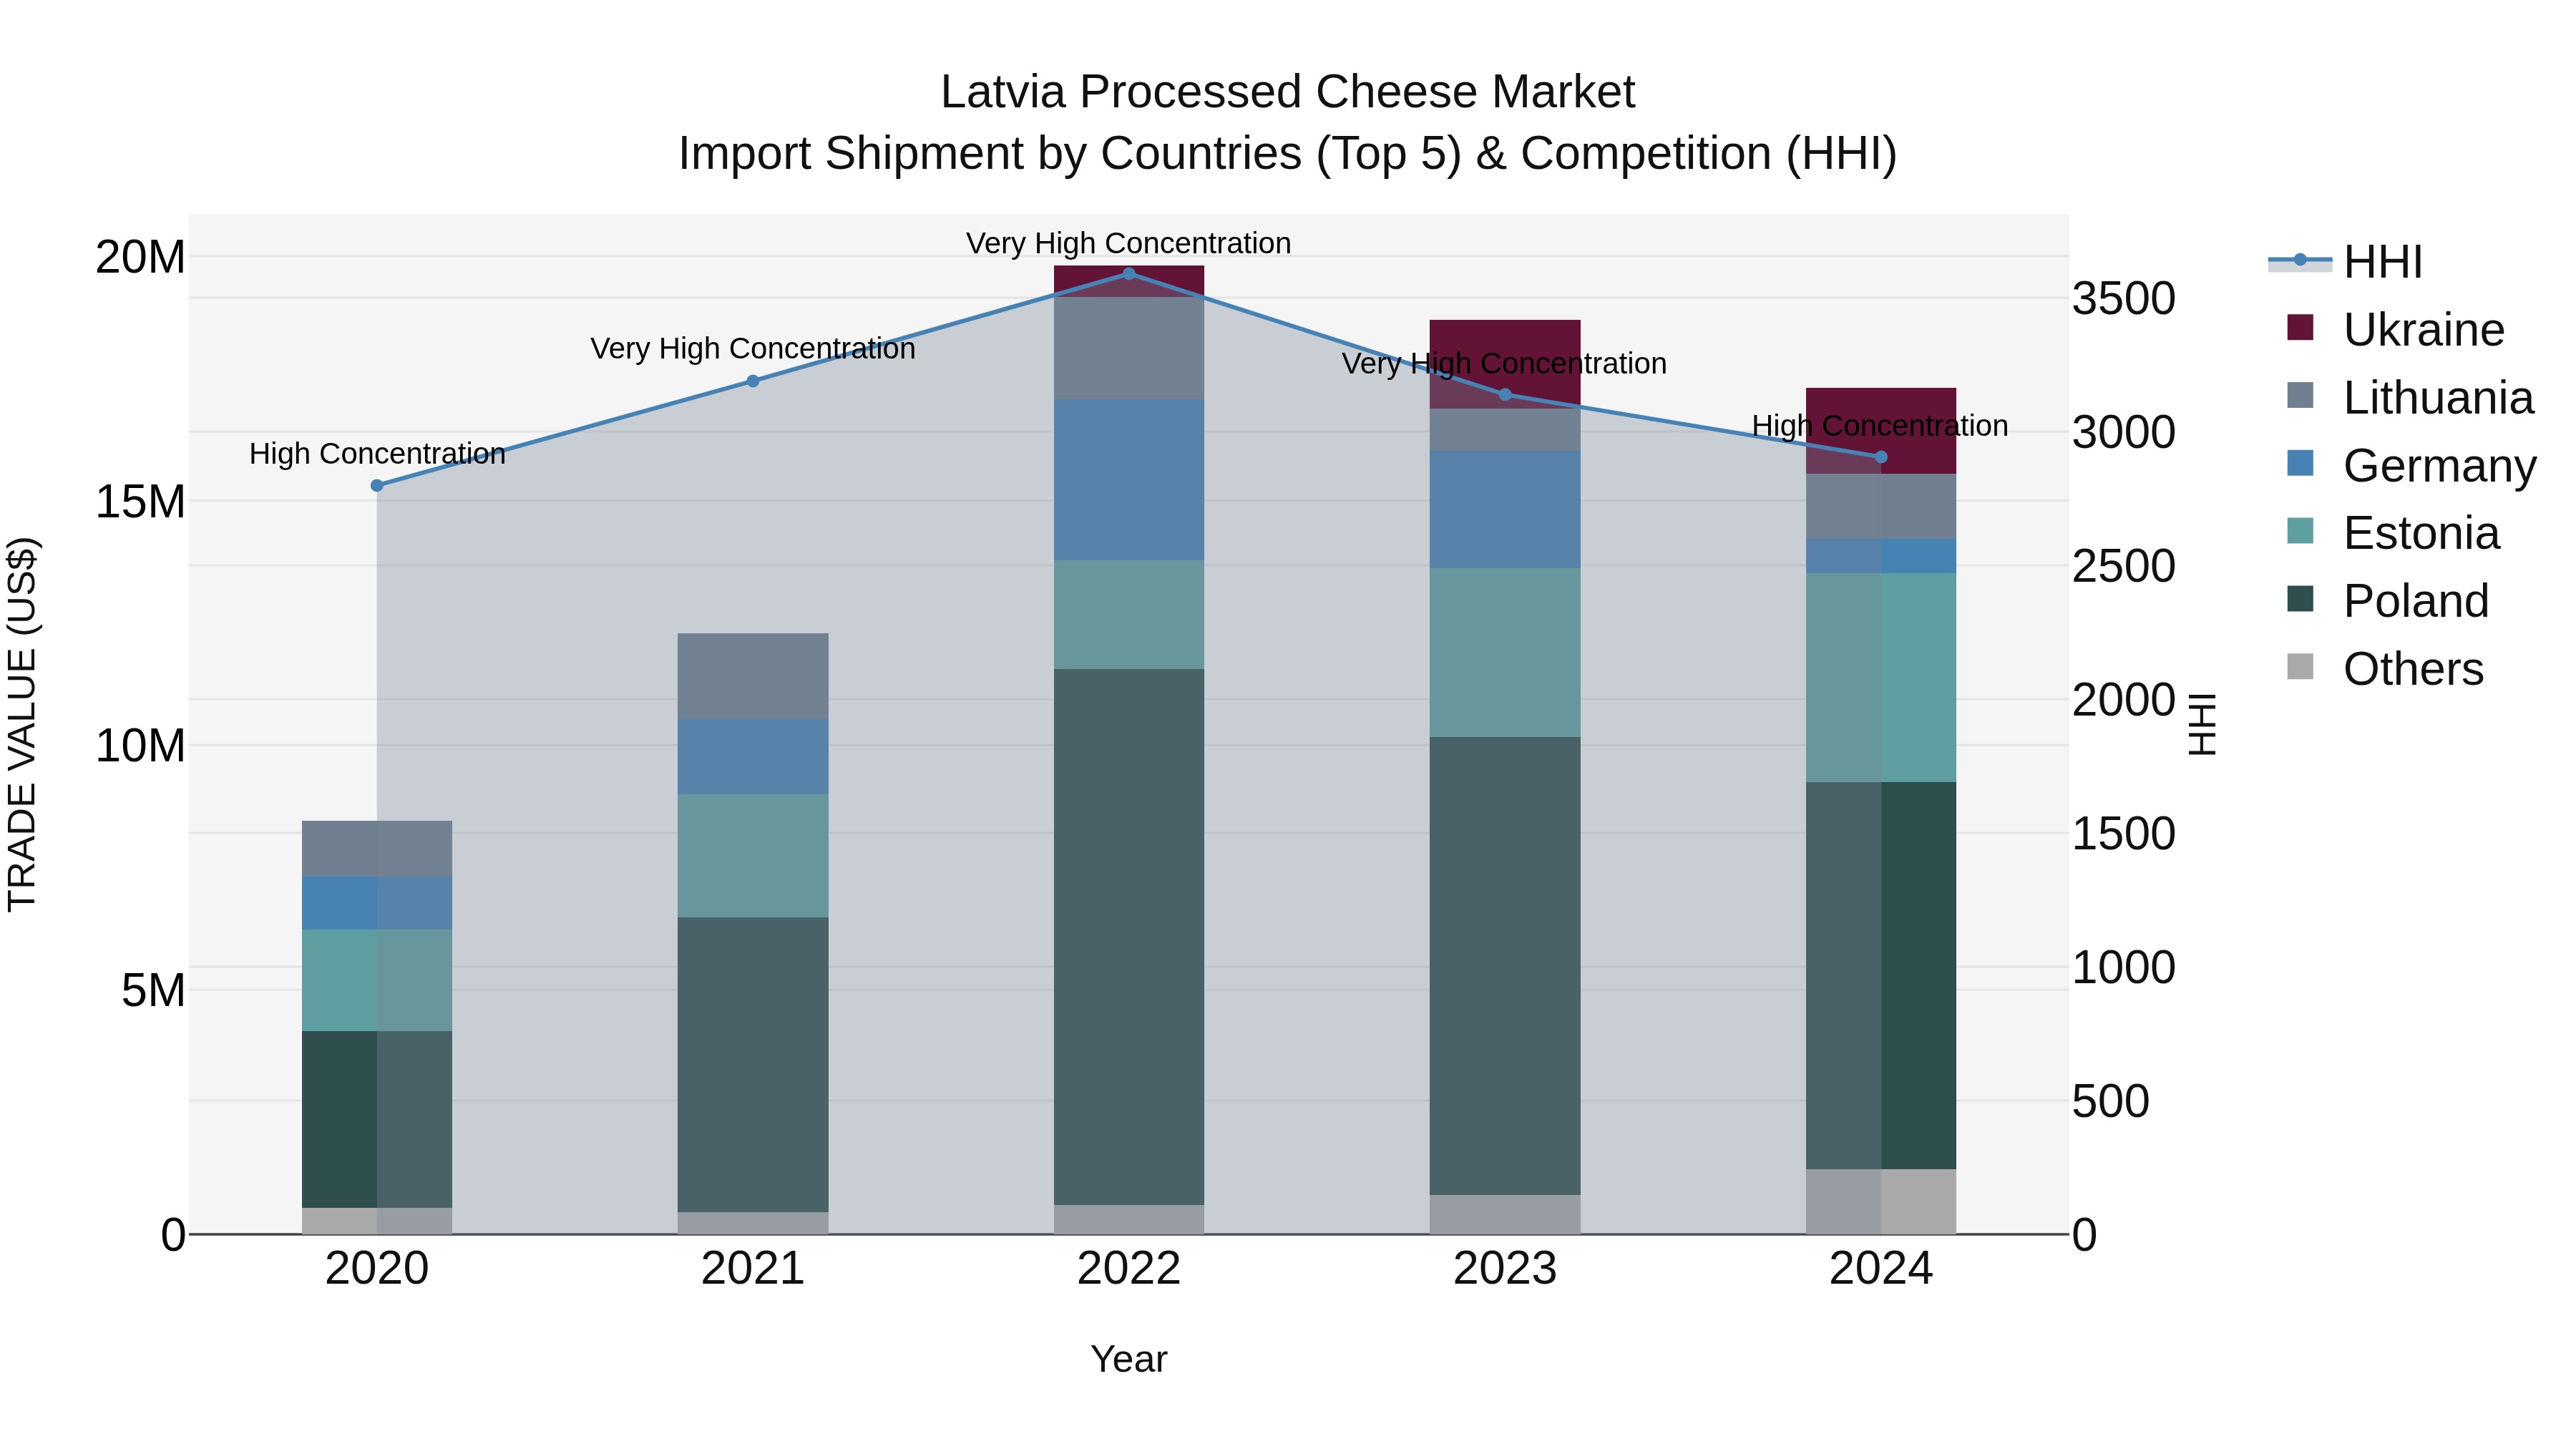
Latvia Processed Cheese Market Top 5 Importing Countries and Market Competition (HHI) Analysis
In 2024, Latvia continued to rely on imports of processed cheese, with top suppliers being Poland, Estonia, Ukraine, Lithuania, and Netherlands. The Herfindahl-Hirschman Index (HHI) showed a shift from very high to high concentration, indicating some diversification in import sources. Despite a high compound annual growth rate (CAGR) of 19.6% from 2020-24, there was a slight decline in the growth rate from 2023-24 at -7.45%. This suggests a potential slowdown in the market expansion but overall, the demand for processed cheese imports in Latvia remains significant.
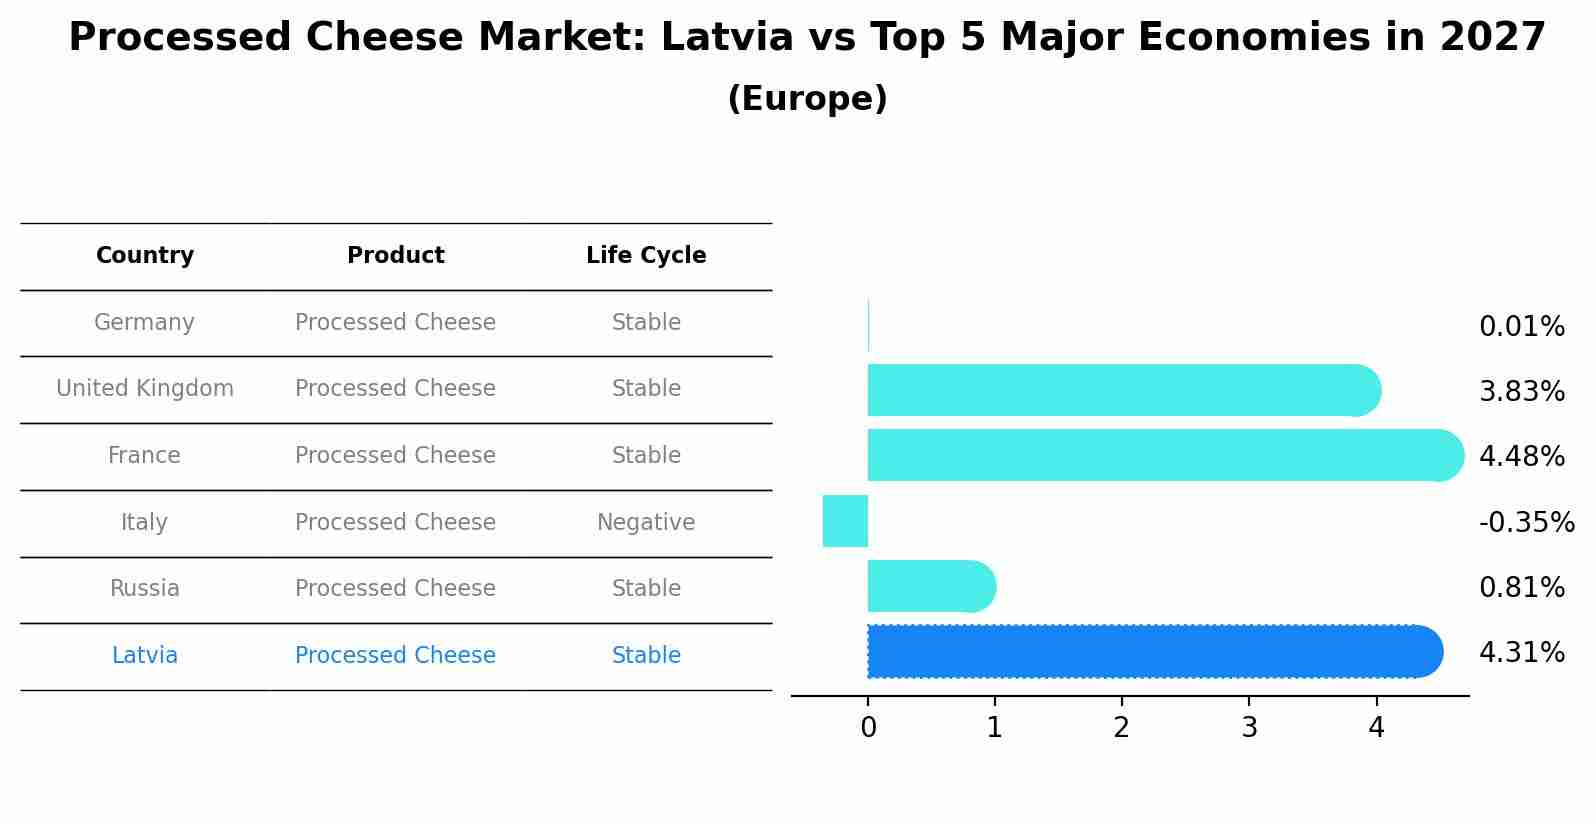
Processed Cheese Market: Latvia vs Top 5 Major Economies in 2027 (Europe)
By 2027, the Processed Cheese market in Latvia is anticipated to reach a growth rate of 4.31%, as part of an increasingly competitive Europe region, where Germany remains at the forefront, supported by United Kingdom, France, Italy and Russia, driving innovations and market adoption across sectors.
Key Highlights of the Report:
- Latvia Processed Cheese Market Outlook
- Market Size of Latvia Processed Cheese Market, 2025
- Forecast of Latvia Processed Cheese Market, 2032
- Historical Data and Forecast of Latvia Processed Cheese Revenues & Volume for the Period 2022 - 2032F
- Latvia Processed Cheese Market Trend Evolution
- Latvia Processed Cheese Market Drivers and Challenges
- Latvia Processed Cheese Price Trends
- Latvia Processed Cheese Porter`s Five Forces
- Latvia Processed Cheese Industry Life Cycle
- Historical Data and Forecast of Latvia Processed Cheese Market Revenues & Volume By Cheese Type for the Period 2022 - 2032F
- Historical Data and Forecast of Latvia Processed Cheese Market Revenues & Volume By Blue Cheese for the Period 2022 - 2032F
- Historical Data and Forecast of Latvia Processed Cheese Market Revenues & Volume By Brick Cheese for the Period 2022 - 2032F
- Historical Data and Forecast of Latvia Processed Cheese Market Revenues & Volume By Camembert Cheese for the Period 2022 - 2032F
- Historical Data and Forecast of Latvia Processed Cheese Market Revenues & Volume By Cheddar Cheese for the Period 2022 - 2032F
- Historical Data and Forecast of Latvia Processed Cheese Market Revenues & Volume By Cottage Cheese for the Period 2022 - 2032F
- Historical Data and Forecast of Latvia Processed Cheese Market Revenues & Volume By Cream Cheese for the Period 2022 - 2032F
- Historical Data and Forecast of Latvia Processed Cheese Market Revenues & Volume By Mozerella Cheese for the Period 2022 - 2032F
- Historical Data and Forecast of Latvia Blue Cheese Processed Cheese Market Revenues & Volume By Other Processed Cheese for the Period 2022 - 2032F
- Historical Data and Forecast of Latvia Processed Cheese Market Revenues & Volume By Form for the Period 2022 - 2032F
- Historical Data and Forecast of Latvia Processed Cheese Market Revenues & Volume By Cheese Blocks for the Period 2022 - 2032F
- Historical Data and Forecast of Latvia Processed Cheese Market Revenues & Volume By Traingle for the Period 2022 - 2032F
- Historical Data and Forecast of Latvia Processed Cheese Market Revenues & Volume By Rectangle for the Period 2022 - 2032F
- Historical Data and Forecast of Latvia Processed Cheese Market Revenues & Volume By Circle for the Period 2022 - 2032F
- Historical Data and Forecast of Latvia Processed Cheese Market Revenues & Volume By Square for the Period 2022 - 2032F
- Historical Data and Forecast of Latvia Processed Cheese Market Revenues & Volume By Cheese Slice for the Period 2022 - 2032F
- Historical Data and Forecast of Latvia Processed Cheese Market Revenues & Volume By Cheese Spread for the Period 2022 - 2032F
- Historical Data and Forecast of Latvia Processed Cheese Market Revenues & Volume By Cheese Spray for the Period 2022 - 2032F
- Historical Data and Forecast of Latvia Processed Cheese Market Revenues & Volume By Milk Source for the Period 2022 - 2032F
- Historical Data and Forecast of Latvia Processed Cheese Market Revenues & Volume By Cattle Milk for the Period 2022 - 2032F
- Historical Data and Forecast of Latvia Processed Cheese Market Revenues & Volume By Goat Milk for the Period 2022 - 2032F
- Historical Data and Forecast of Latvia Processed Cheese Market Revenues & Volume By Sheep Milk for the Period 2022 - 2032F
- Historical Data and Forecast of Latvia Processed Cheese Market Revenues & Volume By End Use for the Period 2022 - 2032F
- Historical Data and Forecast of Latvia Processed Cheese Market Revenues & Volume By Retail / Household for the Period 2022 - 2032F
- Historical Data and Forecast of Latvia Processed Cheese Market Revenues & Volume By HoReCa for the Period 2022 - 2032F
- Historical Data and Forecast of Latvia Processed Cheese Market Revenues & Volume By F&B Processors for the Period 2022 - 2032F
- Historical Data and Forecast of Latvia Processed Cheese Market Revenues & Volume By Snacks Manufacturers for the Period 2022 - 2032F
- Historical Data and Forecast of Latvia Processed Cheese Market Revenues & Volume By Bakery and Confectionery Product Manufacturers for the Period 2022 - 2032F
- Historical Data and Forecast of Latvia Processed Cheese Market Revenues & Volume By Sauces and Condiment Manufacturers for the Period 2022 - 2032F
- Historical Data and Forecast of Latvia Processed Cheese Market Revenues & Volume By Ready Meal Manufacturers for the Period 2022 - 2032F
- Historical Data and Forecast of Latvia Processed Cheese Market Revenues & Volume By Other F&B Processors for the Period 2022 - 2032F
- Historical Data and Forecast of Latvia Processed Cheese Market Revenues & Volume By Distribution for the Period 2022 - 2032F
- Historical Data and Forecast of Latvia Processed Cheese Market Revenues & Volume By Direct Sales (B2B) for the Period 2022 - 2032F
- Historical Data and Forecast of Latvia Processed Cheese Market Revenues & Volume By Hypermarkets and Supermarkets for the Period 2022 - 2032F
- Historical Data and Forecast of Latvia Processed Cheese Market Revenues & Volume By Club Stores for the Period 2022 - 2032F
- Historical Data and Forecast of Latvia Processed Cheese Market Revenues & Volume By Discounters for the Period 2022 - 2032F
- Historical Data and Forecast of Latvia Processed Cheese Market Revenues & Volume By Grocery Retailers for the Period 2022 - 2032F
- Historical Data and Forecast of Latvia Processed Cheese Market Revenues & Volume By Convenience Stores for the Period 2022 - 2032F
- Historical Data and Forecast of Latvia Processed Cheese Market Revenues & Volume By Online Stores for the Period 2022 - 2032F
- Latvia Processed Cheese Import Export Trade Statistics
- Market Opportunity Assessment By Cheese Type
- Market Opportunity Assessment By Form
- Market Opportunity Assessment By Milk Source
- Market Opportunity Assessment By End Use
- Market Opportunity Assessment By Distribution
- Latvia Processed Cheese Top Companies Market Share
- Latvia Processed Cheese Competitive Benchmarking By Technical and Operational Parameters
- Latvia Processed Cheese Company Profiles
- Latvia Processed Cheese Key Strategic Recommendations
Frequently Asked Questions About the Market Study (FAQs):
6Wresearch actively monitors the Latvia Processed Cheese Market and publishes its comprehensive annual report, highlighting emerging trends, growth drivers, revenue analysis, and forecast outlook. Our insights help businesses to make data-backed strategic decisions with ongoing market dynamics. Our analysts track relevent industries related to the Latvia Processed Cheese Market, allowing our clients with actionable intelligence and reliable forecasts tailored to emerging regional needs.
Yes, we provide customisation as per your requirements. To learn more, feel free to contact us on sales@6wresearch.com
1 Executive Summary |
2 Introduction |
2.1 Key Highlights of the Report |
2.2 Report Description |
2.3 Market Scope & Segmentation |
2.4 Research Methodology |
2.5 Assumptions |
3 Latvia Processed Cheese Market Overview |
3.1 Latvia Country Macro Economic Indicators |
3.2 Latvia Processed Cheese Market Revenues & Volume, 2022 & 2032F |
3.3 Latvia Processed Cheese Market - Industry Life Cycle |
3.4 Latvia Processed Cheese Market - Porter's Five Forces |
3.5 Latvia Processed Cheese Market Revenues & Volume Share, By Cheese Type, 2022 & 2032F |
3.6 Latvia Processed Cheese Market Revenues & Volume Share, By Form, 2022 & 2032F |
3.7 Latvia Processed Cheese Market Revenues & Volume Share, By Milk Source, 2022 & 2032F |
3.8 Latvia Processed Cheese Market Revenues & Volume Share, By End Use, 2022 & 2032F |
3.9 Latvia Processed Cheese Market Revenues & Volume Share, By Distribution, 2022 & 2032F |
4 Latvia Processed Cheese Market Dynamics |
4.1 Impact Analysis |
4.2 Market Drivers |
4.2.1 Increasing consumer demand for convenient and ready-to-eat food products |
4.2.2 Growing popularity of processed cheese in various culinary applications |
4.2.3 Expansion of retail channels and distribution networks for processed cheese |
4.3 Market Restraints |
4.3.1 Fluctuating prices of raw materials such as milk and dairy products |
4.3.2 Health concerns regarding the consumption of processed cheese due to additives and preservatives |
5 Latvia Processed Cheese Market Trends |
6 Latvia Processed Cheese Market Segmentations |
6.1 Latvia Processed Cheese Market, By Cheese Type |
6.1.1 Overview and Analysis |
6.1.2 Latvia Processed Cheese Market Revenues & Volume, By Blue Cheese, 2022 - 2032F |
6.1.3 Latvia Processed Cheese Market Revenues & Volume, By Brick Cheese, 2022 - 2032F |
6.1.4 Latvia Processed Cheese Market Revenues & Volume, By Camembert Cheese, 2022 - 2032F |
6.1.5 Latvia Processed Cheese Market Revenues & Volume, By Cheddar Cheese, 2022 - 2032F |
6.1.6 Latvia Processed Cheese Market Revenues & Volume, By Cottage Cheese, 2022 - 2032F |
6.1.7 Latvia Processed Cheese Market Revenues & Volume, By Cream Cheese, 2022 - 2032F |
6.1.9 Latvia Processed Cheese Market Revenues & Volume, By Other Processed Cheese, 2022 - 2032F |
6.1.10 Latvia Processed Cheese Market Revenues & Volume, By Other Processed Cheese, 2022 - 2032F |
6.2 Latvia Processed Cheese Market, By Form |
6.2.1 Overview and Analysis |
6.2.2 Latvia Processed Cheese Market Revenues & Volume, By Cheese Blocks, 2022 - 2032F |
6.2.3 Latvia Processed Cheese Market Revenues & Volume, By Traingle, 2022 - 2032F |
6.2.4 Latvia Processed Cheese Market Revenues & Volume, By Rectangle, 2022 - 2032F |
6.2.5 Latvia Processed Cheese Market Revenues & Volume, By Circle, 2022 - 2032F |
6.2.6 Latvia Processed Cheese Market Revenues & Volume, By Square, 2022 - 2032F |
6.2.7 Latvia Processed Cheese Market Revenues & Volume, By Cheese Slice, 2022 - 2032F |
6.2.8 Latvia Processed Cheese Market Revenues & Volume, By Cheese Spray, 2022 - 2032F |
6.2.9 Latvia Processed Cheese Market Revenues & Volume, By Cheese Spray, 2022 - 2032F |
6.3 Latvia Processed Cheese Market, By Milk Source |
6.3.1 Overview and Analysis |
6.3.2 Latvia Processed Cheese Market Revenues & Volume, By Cattle Milk, 2022 - 2032F |
6.3.3 Latvia Processed Cheese Market Revenues & Volume, By Goat Milk, 2022 - 2032F |
6.3.4 Latvia Processed Cheese Market Revenues & Volume, By Sheep Milk, 2022 - 2032F |
6.4 Latvia Processed Cheese Market, By End Use |
6.4.1 Overview and Analysis |
6.4.2 Latvia Processed Cheese Market Revenues & Volume, By Retail / Household, 2022 - 2032F |
6.4.3 Latvia Processed Cheese Market Revenues & Volume, By HoReCa, 2022 - 2032F |
6.4.4 Latvia Processed Cheese Market Revenues & Volume, By F&B Processors, 2022 - 2032F |
6.4.5 Latvia Processed Cheese Market Revenues & Volume, By Snacks Manufacturers, 2022 - 2032F |
6.4.6 Latvia Processed Cheese Market Revenues & Volume, By Bakery and Confectionery Product Manufacturers, 2022 - 2032F |
6.4.7 Latvia Processed Cheese Market Revenues & Volume, By Sauces and Condiment Manufacturers, 2022 - 2032F |
6.4.8 Latvia Processed Cheese Market Revenues & Volume, By Other F&B Processors, 2022 - 2032F |
6.4.9 Latvia Processed Cheese Market Revenues & Volume, By Other F&B Processors, 2022 - 2032F |
6.5 Latvia Processed Cheese Market, By Distribution |
6.5.1 Overview and Analysis |
6.5.2 Latvia Processed Cheese Market Revenues & Volume, By Direct Sales (B2B), 2022 - 2032F |
6.5.3 Latvia Processed Cheese Market Revenues & Volume, By Hypermarkets and Supermarkets, 2022 - 2032F |
6.5.4 Latvia Processed Cheese Market Revenues & Volume, By Club Stores, 2022 - 2032F |
6.5.5 Latvia Processed Cheese Market Revenues & Volume, By Discounters, 2022 - 2032F |
6.5.6 Latvia Processed Cheese Market Revenues & Volume, By Grocery Retailers, 2022 - 2032F |
6.5.7 Latvia Processed Cheese Market Revenues & Volume, By Convenience Stores, 2022 - 2032F |
7 Latvia Processed Cheese Market Import-Export Trade Statistics |
7.1 Latvia Processed Cheese Market Export to Major Countries |
7.2 Latvia Processed Cheese Market Imports from Major Countries |
8 Latvia Processed Cheese Market Key Performance Indicators |
8.1 Consumer engagement with new processed cheese product launches |
8.2 Growth in the number of processing facilities and production capacity |
8.3 Adoption rate of innovative packaging solutions for processed cheese |
9 Latvia Processed Cheese Market - Opportunity Assessment |
9.1 Latvia Processed Cheese Market Opportunity Assessment, By Cheese Type, 2022 & 2032F |
9.2 Latvia Processed Cheese Market Opportunity Assessment, By Form, 2022 & 2032F |
9.3 Latvia Processed Cheese Market Opportunity Assessment, By Milk Source, 2022 & 2032F |
9.4 Latvia Processed Cheese Market Opportunity Assessment, By End Use, 2022 & 2032F |
9.5 Latvia Processed Cheese Market Opportunity Assessment, By Distribution, 2022 & 2032F |
10 Latvia Processed Cheese Market - Competitive Landscape |
10.1 Latvia Processed Cheese Market Revenue Share, By Companies, 2025 |
10.2 Latvia Processed Cheese Market Competitive Benchmarking, By Operating and Technical Parameters |
11 Company Profiles |
12 Recommendations | 13 Disclaimer |
Export potential assessment - trade Analytics for 2030
Export potential enables firms to identify high-growth global markets with greater confidence by combining advanced trade intelligence with a structured quantitative methodology. The framework analyzes emerging demand trends and country-level import patterns while integrating macroeconomic and trade datasets such as GDP and population forecasts, bilateral import–export flows, tariff structures, elasticity differentials between developed and developing economies, geographic distance, and import demand projections. Using weighted trade values from 2020–2024 as the base period to project country-to-country export potential for 2030, these inputs are operationalized through calculated drivers such as gravity model parameters, tariff impact factors, and projected GDP per-capita growth. Through an analysis of hidden potentials, demand hotspots, and market conditions that are most favorable to success, this method enables firms to focus on target countries, maximize returns, and global expansion with data, backed by accuracy.
By factoring in the projected importer demand gap that is currently unmet and could be potential opportunity, it identifies the potential for the Exporter (Country) among 190 countries, against the general trade analysis, which identifies the biggest importer or exporter.
To discover high-growth global markets and optimize your business strategy:
Click Here
Pricing
- Single User License$ 1,995
- Department License$ 2,400
- Site License$ 3,120
- Global License$ 3,795

Search
Thought Leadership and Analyst Meet


Our Clients
Latest Reports
- Taiwan Food Delivery Platform Market (2026-2032) | Companies, Outlook, Analysis, Trends, Value, Revenue, Segmentation, Share, Forecast, Competitive Landscape, Growth, Size & Forecast
- United Kingdom (UK) Long-term Care Insurance Market (2026-2032) | Growth, Share, Consumer Insights, Drivers, Opportunities, Competition, Pricing Analysis, Segments, Restraints, Companies, Competitive, Value, Outlook, Size, Demand, Analysis, Challenges, Strategic Insights, Investment Trends, Revenue, Trends, Supply, Forecast
- United Kingdom (UK) Long Term Care Market (2026-2032) | Companies, Outlook, Analysis, Trends, Value, Revenue, Segmentation, Share, Forecast, Competitive Landscape, Growth, Size & Forecast
- Iraq Insulation and Waterproofing Market (2026-2032) | Outlook, Drivers, Growth, Size, Share, Industry, Revenue, Trends, Demand, Competitive, Strategic Insights, Opportunities, Segments, Companies, Challenges, Strategy, Consumer Insights, Analysis, Investment Trends, Value, Segmentation, Forecast, Restraints
- India Switchgear Market Outlook (2026-2032) | Size, Share, Trends, Growth, Revenue, Forecast, Analysis, Value, Outlook
- Pakistan Contraceptive Implants Market (2025-2031) | Demand, Growth, Size, Share, Industry, Pricing Analysis, Competitive, Strategic Insights, Strategy, Consumer Insights, Analysis, Investment Trends, Opportunities, Revenue, Segments, Value, Segmentation, Supply, Forecast, Restraints, Outlook, Competition, Drivers, Trends, Companies, Challenges
- Sri Lanka Packaging Market (2026-2032) | Outlook, Competition, Drivers, Trends, Demand, Pricing Analysis, Competitive, Strategic Insights, Companies, Challenges, Strategy, Consumer Insights, Analysis, Investment Trends, Opportunities, Growth, Size, Share, Industry, Revenue, Segments, Value, Segmentation, Supply, Forecast, Restraints
- India Kids Watches Market (2026-2032) | Strategy, Consumer Insights, Analysis, Investment Trends, Opportunities, Growth, Size, Share, Industry, Revenue, Segments, Value, Segmentation, Supply, Forecast, Restraints, Outlook, Competition, Drivers, Trends, Demand, Pricing Analysis, Competitive, Strategic Insights, Companies, Challenges
- Saudi Arabia Core Assurance Service Market (2025-2031) | Strategy, Consumer Insights, Analysis, Investment Trends, Opportunities, Growth, Size, Share, Industry, Revenue, Segments, Value, Segmentation, Supply, Forecast, Restraints, Outlook, Competition, Drivers, Trends, Demand, Pricing Analysis, Competitive, Strategic Insights, Companies, Challenges
- Romania Uninterruptible Power Supply (UPS) Market (2026-2032) | Industry, Analysis, Revenue, Size, Forecast, Outlook, Value, Trends, Share, Growth & Companies
Industry Events and Analyst Meet

India EV Show 2026

EV tech India Expo 2026

Auto Tech Asia 2026

Battery Tech India 2026

Smart Production Solutions Guangzhou 2026
Whitepaper
- Middle East & Africa Commercial Security Market Click here to view more.
- Middle East & Africa Fire Safety Systems & Equipment Market Click here to view more.
- GCC Drone Market Click here to view more.
- Middle East Lighting Fixture Market Click here to view more.
- GCC Physical & Perimeter Security Market Click here to view more.
6WResearch In News
- Doha a strategic location for EV manufacturing hub: IPA Qatar
- Demand for luxury TVs surging in the GCC, says Samsung
- Empowering Growth: The Thriving Journey of Bangladesh’s Cable Industry
- Demand for luxury TVs surging in the GCC, says Samsung
- Video call with a traditional healer? Once unthinkable, it’s now common in South Africa
- Intelligent Buildings To Smooth GCC’s Path To Net Zero