Latvia SiC Power Semiconductor Market (2025-2031) | Growth, Size & Revenue, Analysis, Share, Trends, Segmentation, Value, Forecast, Competitive Landscape, Outlook, Industry, Companies
Market Forecast By Type (MOSFETS, Hybrid Modules, IGBT, Pin Diode, Junction FET (JFET), Others), By Voltage Range (301-900 V, 901-1700 V, Above 1701 V), By Wafer Size (6 Inch, 4 Inch, 2 Inch, Above 6 Inch), By Wafer Type (SiC epitaxial wafers, Blank SiC wafers), By Application (Electric Vehicles (EV), Photovoltaics, Power supplies, RF Devices, Others), By Vertical (Automotive, Utilities and energy, Industrial, Commercial, Others) And Competitive Landscape
| Product Code: ETC7921327 | Publication Date: Sep 2024 | Updated Date: Nov 2025 | Product Type: Market Research Report | |
| Publisher: 6Wresearch | Author: Sumit Sagar | No. of Pages: 75 | No. of Figures: 35 | No. of Tables: 20 |
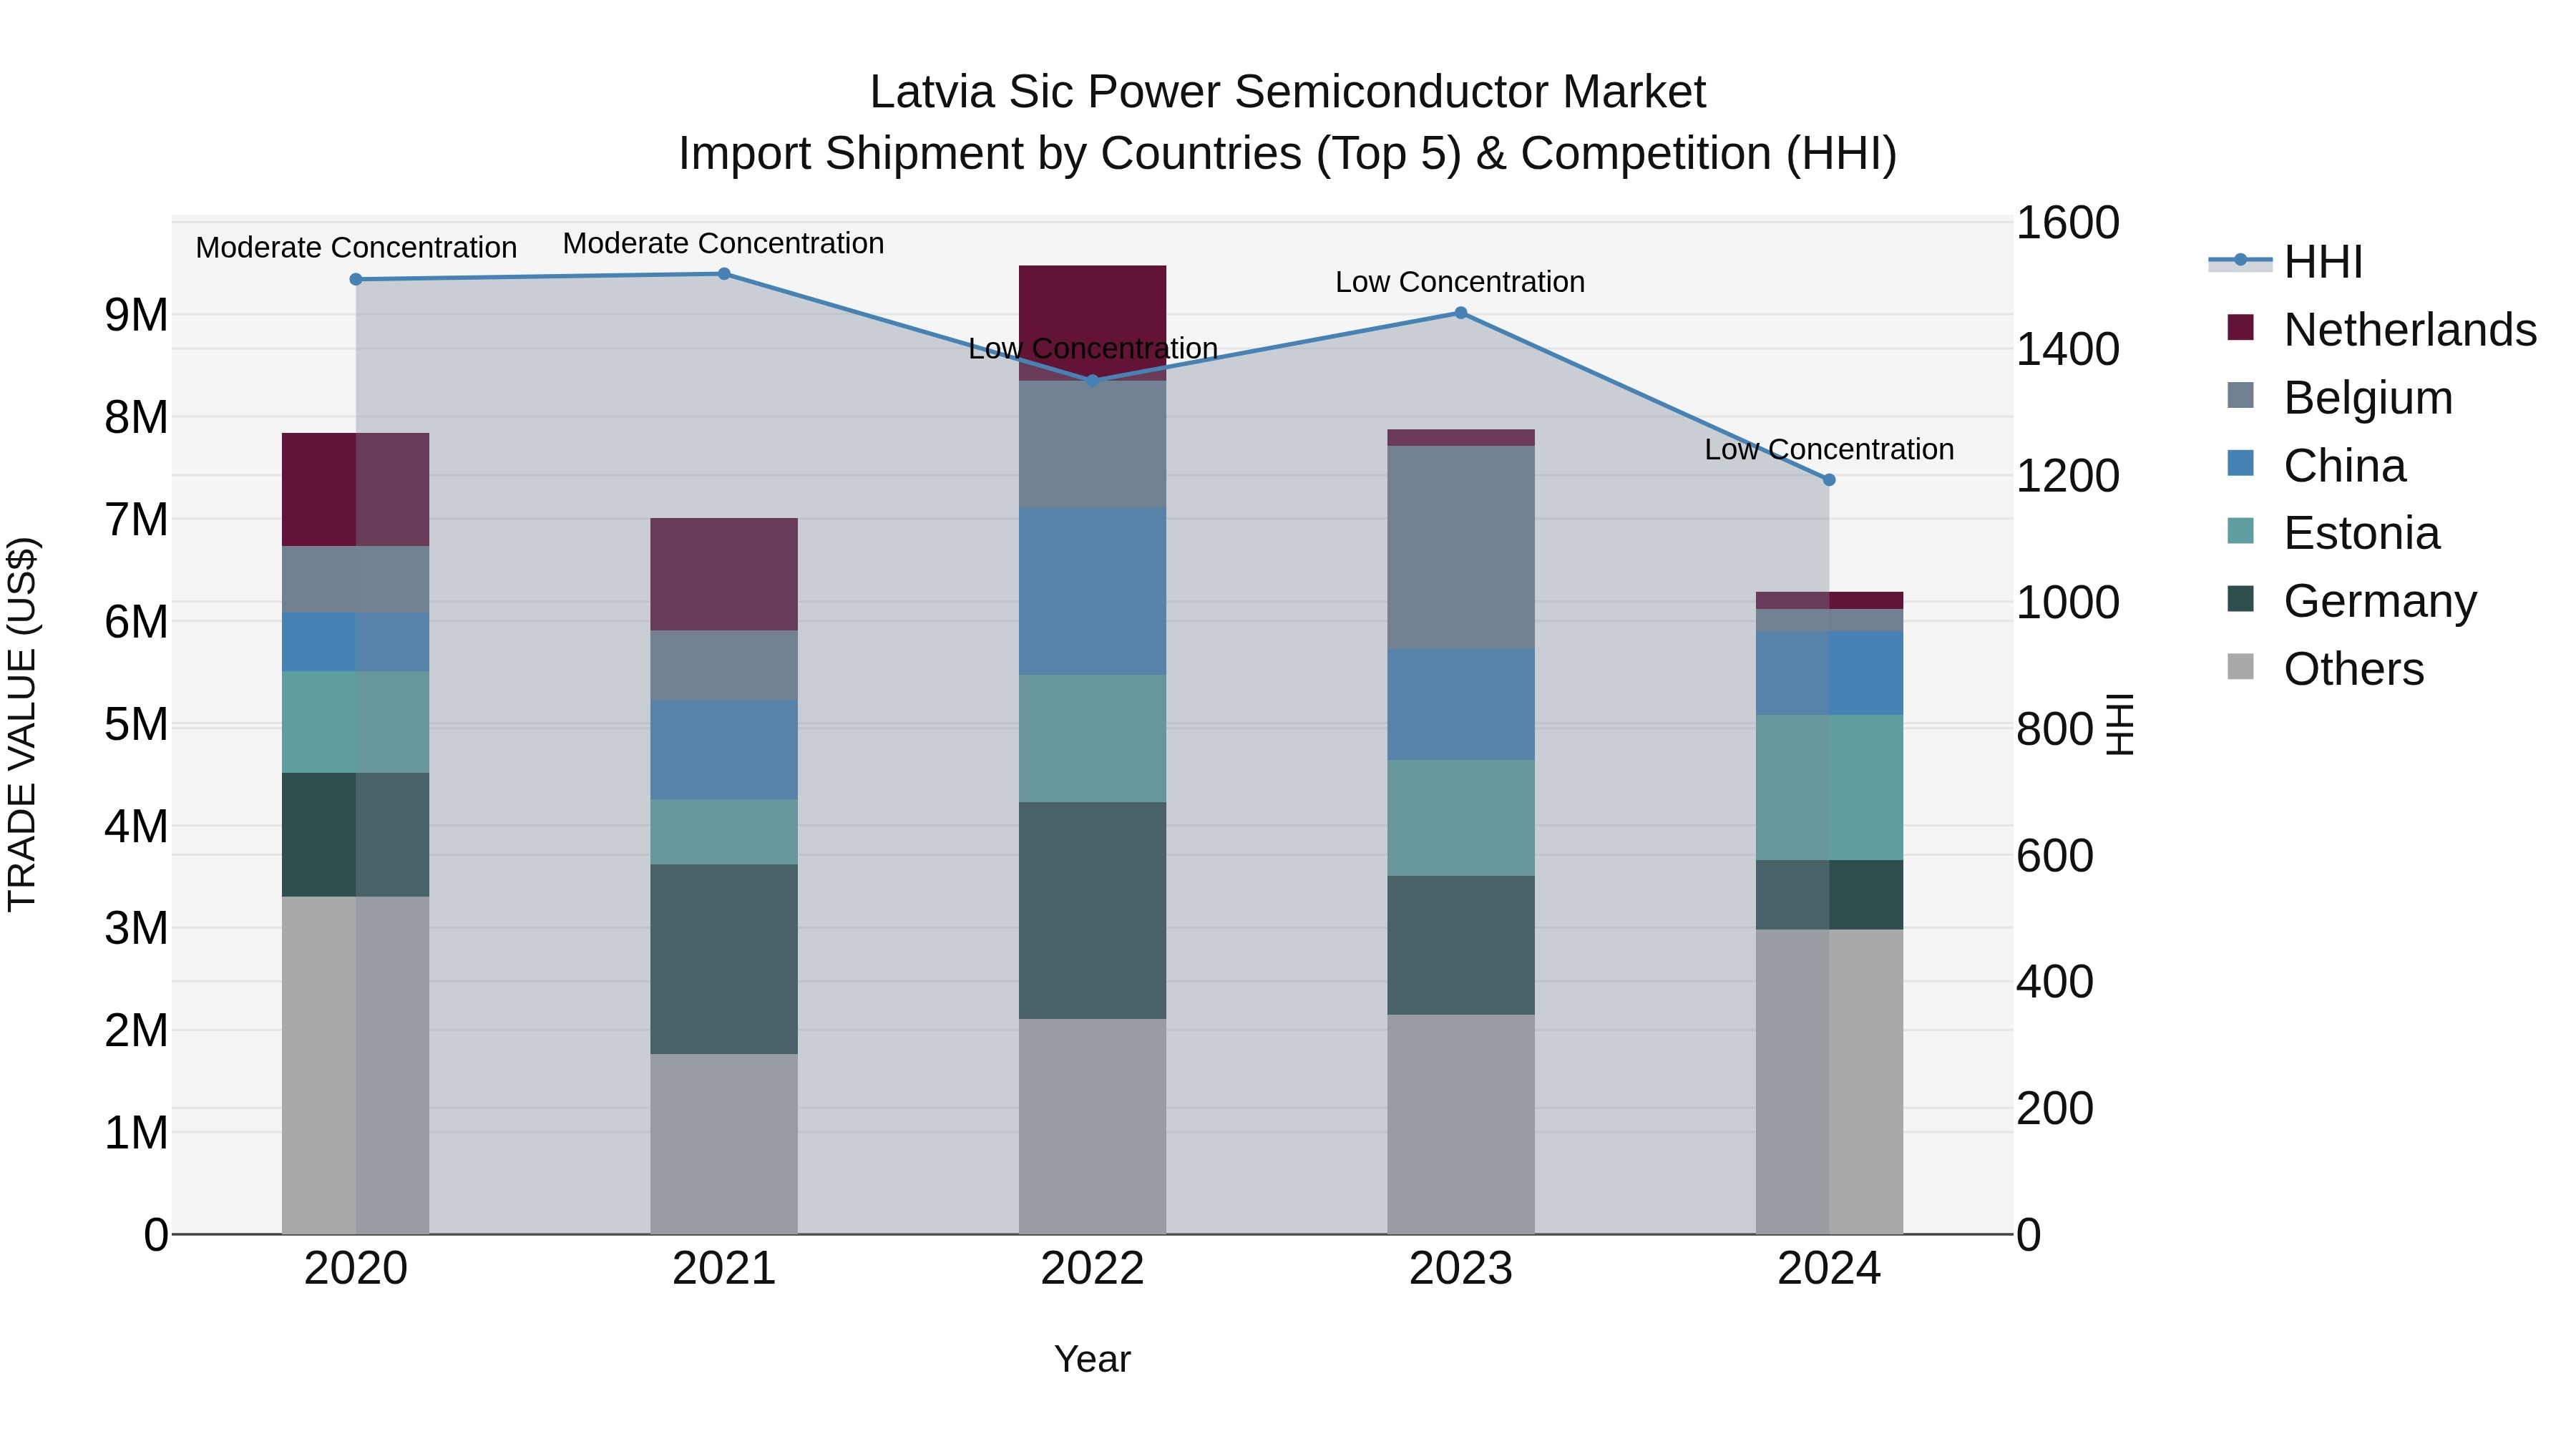
Latvia Sic Power Semiconductor Market Top 5 Importing Countries and Market Competition (HHI) Analysis
Latvia`s import shipments of SiC power semiconductors in 2024 were primarily sourced from Estonia, USA, China, Germany, and Taiwan. Despite a negative Compound Annual Growth Rate (CAGR) of -5.38% from 2020 to 2024 and a significant decline in growth rate of -20.19% from 2023 to 2024, the Herfindahl-Hirschman Index (HHI) indicated low concentration among the exporting countries. This suggests a diverse and competitive market landscape for SiC power semiconductor imports in Latvia, with opportunities for further market expansion and diversification in the coming years.
Latvia SiC Power Semiconductor Market Synopsis
The SiC power semiconductor market in Latvia is experiencing steady growth driven by increasing demand for energy-efficient solutions in various industries such as automotive, power electronics, and renewable energy. The adoption of SiC power semiconductors is rising due to their superior performance characteristics including higher efficiency, faster switching speeds, and higher temperature tolerance compared to traditional silicon-based semiconductors. Key players in the market are focusing on product innovation and strategic partnerships to expand their market presence. The Latvian SiC power semiconductor market is expected to continue growing as industries increasingly prioritize energy efficiency and performance optimization, presenting opportunities for further market expansion and technological advancements.
Latvia SiC Power Semiconductor Market Trends
The Latvia SiC Power Semiconductor Market is experiencing growing demand due to the increasing adoption of electric vehicles, renewable energy sources, and industrial automation. The market is witnessing a shift towards SiC-based power semiconductors as they offer higher efficiency, faster switching speeds, and better thermal performance compared to traditional silicon-based semiconductors. Opportunities in the market include the development of SiC technology for applications in power electronics, automotive, and energy sectors, as well as collaborations between local companies and global players to drive innovation and market growth. Additionally, the government`s support for renewable energy projects and initiatives to reduce carbon emissions are expected to further drive the demand for SiC power semiconductors in Latvia.
Latvia SiC Power Semiconductor Market Challenges
In the Latvia SiC Power Semiconductor Market, challenges primarily revolve around the limited awareness and adoption of SiC technology among local businesses and industries. The market faces hurdles in terms of educating potential users about the benefits of SiC power semiconductors, such as higher efficiency and reliability, compared to traditional silicon-based components. Additionally, the relatively higher upfront costs of SiC devices can be a barrier for some companies looking to upgrade their power systems. Supply chain disruptions and the availability of SiC materials could also pose challenges for market growth in Latvia. Overcoming these obstacles will require targeted marketing efforts, industry collaborations, and investments in research and development to drive the adoption of SiC power semiconductors in the Latvian market.
Latvia SiC Power Semiconductor Market Investment Opportunities
The Latvia SiC Power Semiconductor Market is primarily driven by the increasing demand for energy-efficient power electronics across various industries such as automotive, industrial, and consumer electronics. The superior characteristics of SiC power semiconductors, including high power efficiency, faster switching speeds, and improved thermal performance, are driving their adoption in power devices and systems. Additionally, the growing focus on renewable energy sources and the need for reducing carbon emissions are further fueling the demand for SiC power semiconductors in applications such as solar inverters, electric vehicles, and power supplies. The government initiatives promoting the use of SiC-based power electronics for enhancing energy efficiency and sustainability are also contributing to the market growth in Latvia.
Latvia SiC Power Semiconductor Market Government Polices
In Latvia, the government has been focused on promoting the development and adoption of SiC power semiconductors through various policies and initiatives. These include investment incentives for companies involved in SiC semiconductor production, research and development grants to support innovation in the sector, and collaboration with academic institutions to enhance the country`s expertise in SiC technology. Additionally, the government has been working to create a favorable regulatory environment for the SiC power semiconductor market, including establishing standards and certifications to ensure quality and safety. Overall, Latvia`s policies are geared towards fostering a competitive and sustainable SiC power semiconductor industry in the country.
Latvia SiC Power Semiconductor Market Future Outlook
The Latvia SiC power semiconductor market is expected to witness significant growth in the coming years due to increasing demand for efficient power electronics in various industries such as automotive, telecommunications, and renewable energy. The adoption of SiC power semiconductors is driven by their superior features like higher efficiency, faster switching speeds, and lower power losses compared to traditional silicon-based semiconductors. Additionally, the growing focus on electric vehicles, renewable energy sources, and smart grid technologies is further propelling the demand for SiC power semiconductors in Latvia. With advancements in manufacturing technologies and increasing investments in research and development, the Latvia SiC power semiconductor market is poised for substantial expansion in the foreseeable future.
Key Highlights of the Report:
- Latvia SiC Power Semiconductor Market Outlook
- Market Size of Latvia SiC Power Semiconductor Market, 2024
- Forecast of Latvia SiC Power Semiconductor Market, 2031
- Historical Data and Forecast of Latvia SiC Power Semiconductor Revenues & Volume for the Period 2021- 2031
- Latvia SiC Power Semiconductor Market Trend Evolution
- Latvia SiC Power Semiconductor Market Drivers and Challenges
- Latvia SiC Power Semiconductor Price Trends
- Latvia SiC Power Semiconductor Porter's Five Forces
- Latvia SiC Power Semiconductor Industry Life Cycle
- Historical Data and Forecast of Latvia SiC Power Semiconductor Market Revenues & Volume By Type for the Period 2021- 2031
- Historical Data and Forecast of Latvia SiC Power Semiconductor Market Revenues & Volume By MOSFETS for the Period 2021- 2031
- Historical Data and Forecast of Latvia SiC Power Semiconductor Market Revenues & Volume By Hybrid Modules for the Period 2021- 2031
- Historical Data and Forecast of Latvia SiC Power Semiconductor Market Revenues & Volume By IGBT for the Period 2021- 2031
- Historical Data and Forecast of Latvia SiC Power Semiconductor Market Revenues & Volume By Pin Diode for the Period 2021- 2031
- Historical Data and Forecast of Latvia SiC Power Semiconductor Market Revenues & Volume By Junction FET (JFET) for the Period 2021- 2031
- Historical Data and Forecast of Latvia SiC Power Semiconductor Market Revenues & Volume By Others for the Period 2021- 2031
- Historical Data and Forecast of Latvia SiC Power Semiconductor Market Revenues & Volume By Voltage Range for the Period 2021- 2031
- Historical Data and Forecast of Latvia SiC Power Semiconductor Market Revenues & Volume By 301-900 V for the Period 2021- 2031
- Historical Data and Forecast of Latvia SiC Power Semiconductor Market Revenues & Volume By 901-1700 V for the Period 2021- 2031
- Historical Data and Forecast of Latvia SiC Power Semiconductor Market Revenues & Volume By Above 1701 V for the Period 2021- 2031
- Historical Data and Forecast of Latvia SiC Power Semiconductor Market Revenues & Volume By Wafer Size for the Period 2021- 2031
- Historical Data and Forecast of Latvia SiC Power Semiconductor Market Revenues & Volume By 6 Inch for the Period 2021- 2031
- Historical Data and Forecast of Latvia SiC Power Semiconductor Market Revenues & Volume By 4 Inch for the Period 2021- 2031
- Historical Data and Forecast of Latvia SiC Power Semiconductor Market Revenues & Volume By 2 Inch for the Period 2021- 2031
- Historical Data and Forecast of Latvia SiC Power Semiconductor Market Revenues & Volume By Above 6 Inch for the Period 2021- 2031
- Historical Data and Forecast of Latvia SiC Power Semiconductor Market Revenues & Volume By Wafer Type for the Period 2021- 2031
- Historical Data and Forecast of Latvia SiC Power Semiconductor Market Revenues & Volume By SiC epitaxial wafers for the Period 2021- 2031
- Historical Data and Forecast of Latvia SiC Power Semiconductor Market Revenues & Volume By Blank SiC wafers for the Period 2021- 2031
- Historical Data and Forecast of Latvia SiC Power Semiconductor Market Revenues & Volume By Application for the Period 2021- 2031
- Historical Data and Forecast of Latvia SiC Power Semiconductor Market Revenues & Volume By Electric Vehicles (EV) for the Period 2021- 2031
- Historical Data and Forecast of Latvia SiC Power Semiconductor Market Revenues & Volume By Photovoltaics for the Period 2021- 2031
- Historical Data and Forecast of Latvia SiC Power Semiconductor Market Revenues & Volume By Power supplies for the Period 2021- 2031
- Historical Data and Forecast of Latvia SiC Power Semiconductor Market Revenues & Volume By RF Devices for the Period 2021- 2031
- Historical Data and Forecast of Latvia SiC Power Semiconductor Market Revenues & Volume By Others for the Period 2021- 2031
- Historical Data and Forecast of Latvia SiC Power Semiconductor Market Revenues & Volume By Vertical for the Period 2021- 2031
- Historical Data and Forecast of Latvia SiC Power Semiconductor Market Revenues & Volume By Automotive for the Period 2021- 2031
- Historical Data and Forecast of Latvia SiC Power Semiconductor Market Revenues & Volume By Utilities and energy for the Period 2021- 2031
- Historical Data and Forecast of Latvia SiC Power Semiconductor Market Revenues & Volume By Industrial for the Period 2021- 2031
- Historical Data and Forecast of Latvia SiC Power Semiconductor Market Revenues & Volume By Commercial for the Period 2021- 2031
- Historical Data and Forecast of Latvia SiC Power Semiconductor Market Revenues & Volume By Others for the Period 2021- 2031
- Latvia SiC Power Semiconductor Import Export Trade Statistics
- Market Opportunity Assessment By Type
- Market Opportunity Assessment By Voltage Range
- Market Opportunity Assessment By Wafer Size
- Market Opportunity Assessment By Wafer Type
- Market Opportunity Assessment By Application
- Market Opportunity Assessment By Vertical
- Latvia SiC Power Semiconductor Top Companies Market Share
- Latvia SiC Power Semiconductor Competitive Benchmarking By Technical and Operational Parameters
- Latvia SiC Power Semiconductor Company Profiles
- Latvia SiC Power Semiconductor Key Strategic Recommendations
Frequently Asked Questions About the Market Study (FAQs):
6Wresearch actively monitors the Latvia SiC Power Semiconductor Market and publishes its comprehensive annual report, highlighting emerging trends, growth drivers, revenue analysis, and forecast outlook. Our insights help businesses to make data-backed strategic decisions with ongoing market dynamics. Our analysts track relevent industries related to the Latvia SiC Power Semiconductor Market, allowing our clients with actionable intelligence and reliable forecasts tailored to emerging regional needs.
Yes, we provide customisation as per your requirements. To learn more, feel free to contact us on sales@6wresearch.com
1 Executive Summary |
2 Introduction |
2.1 Key Highlights of the Report |
2.2 Report Description |
2.3 Market Scope & Segmentation |
2.4 Research Methodology |
2.5 Assumptions |
3 Latvia SiC Power Semiconductor Market Overview |
3.1 Latvia Country Macro Economic Indicators |
3.2 Latvia SiC Power Semiconductor Market Revenues & Volume, 2021 & 2031F |
3.3 Latvia SiC Power Semiconductor Market - Industry Life Cycle |
3.4 Latvia SiC Power Semiconductor Market - Porter's Five Forces |
3.5 Latvia SiC Power Semiconductor Market Revenues & Volume Share, By Type, 2021 & 2031F |
3.6 Latvia SiC Power Semiconductor Market Revenues & Volume Share, By Voltage Range, 2021 & 2031F |
3.7 Latvia SiC Power Semiconductor Market Revenues & Volume Share, By Wafer Size, 2021 & 2031F |
3.8 Latvia SiC Power Semiconductor Market Revenues & Volume Share, By Wafer Type, 2021 & 2031F |
3.9 Latvia SiC Power Semiconductor Market Revenues & Volume Share, By Application, 2021 & 2031F |
3.10 Latvia SiC Power Semiconductor Market Revenues & Volume Share, By Vertical, 2021 & 2031F |
4 Latvia SiC Power Semiconductor Market Dynamics |
4.1 Impact Analysis |
4.2 Market Drivers |
4.2.1 Growing demand for energy-efficient solutions in various industries |
4.2.2 Increasing adoption of electric vehicles and renewable energy sources |
4.2.3 Government initiatives and policies promoting the use of SiC power semiconductors |
4.3 Market Restraints |
4.3.1 High initial investment costs associated with SiC power semiconductors |
4.3.2 Limited availability of raw materials for SiC semiconductor production |
4.3.3 Lack of skilled workforce in the field of SiC technology |
5 Latvia SiC Power Semiconductor Market Trends |
6 Latvia SiC Power Semiconductor Market, By Types |
6.1 Latvia SiC Power Semiconductor Market, By Type |
6.1.1 Overview and Analysis |
6.1.2 Latvia SiC Power Semiconductor Market Revenues & Volume, By Type, 2021- 2031F |
6.1.3 Latvia SiC Power Semiconductor Market Revenues & Volume, By MOSFETS, 2021- 2031F |
6.1.4 Latvia SiC Power Semiconductor Market Revenues & Volume, By Hybrid Modules, 2021- 2031F |
6.1.5 Latvia SiC Power Semiconductor Market Revenues & Volume, By IGBT, 2021- 2031F |
6.1.6 Latvia SiC Power Semiconductor Market Revenues & Volume, By Pin Diode, 2021- 2031F |
6.1.7 Latvia SiC Power Semiconductor Market Revenues & Volume, By Junction FET (JFET), 2021- 2031F |
6.1.8 Latvia SiC Power Semiconductor Market Revenues & Volume, By Others, 2021- 2031F |
6.2 Latvia SiC Power Semiconductor Market, By Voltage Range |
6.2.1 Overview and Analysis |
6.2.2 Latvia SiC Power Semiconductor Market Revenues & Volume, By 301-900 V, 2021- 2031F |
6.2.3 Latvia SiC Power Semiconductor Market Revenues & Volume, By 901-1700 V, 2021- 2031F |
6.2.4 Latvia SiC Power Semiconductor Market Revenues & Volume, By Above 1701 V, 2021- 2031F |
6.3 Latvia SiC Power Semiconductor Market, By Wafer Size |
6.3.1 Overview and Analysis |
6.3.2 Latvia SiC Power Semiconductor Market Revenues & Volume, By 6 Inch, 2021- 2031F |
6.3.3 Latvia SiC Power Semiconductor Market Revenues & Volume, By 4 Inch, 2021- 2031F |
6.3.4 Latvia SiC Power Semiconductor Market Revenues & Volume, By 2 Inch, 2021- 2031F |
6.3.5 Latvia SiC Power Semiconductor Market Revenues & Volume, By Above 6 Inch, 2021- 2031F |
6.4 Latvia SiC Power Semiconductor Market, By Wafer Type |
6.4.1 Overview and Analysis |
6.4.2 Latvia SiC Power Semiconductor Market Revenues & Volume, By SiC epitaxial wafers, 2021- 2031F |
6.4.3 Latvia SiC Power Semiconductor Market Revenues & Volume, By Blank SiC wafers, 2021- 2031F |
6.5 Latvia SiC Power Semiconductor Market, By Application |
6.5.1 Overview and Analysis |
6.5.2 Latvia SiC Power Semiconductor Market Revenues & Volume, By Electric Vehicles (EV), 2021- 2031F |
6.5.3 Latvia SiC Power Semiconductor Market Revenues & Volume, By Photovoltaics, 2021- 2031F |
6.5.4 Latvia SiC Power Semiconductor Market Revenues & Volume, By Power supplies, 2021- 2031F |
6.5.5 Latvia SiC Power Semiconductor Market Revenues & Volume, By RF Devices, 2021- 2031F |
6.5.6 Latvia SiC Power Semiconductor Market Revenues & Volume, By Others, 2021- 2031F |
6.6 Latvia SiC Power Semiconductor Market, By Vertical |
6.6.1 Overview and Analysis |
6.6.2 Latvia SiC Power Semiconductor Market Revenues & Volume, By Automotive, 2021- 2031F |
6.6.3 Latvia SiC Power Semiconductor Market Revenues & Volume, By Utilities and energy, 2021- 2031F |
6.6.4 Latvia SiC Power Semiconductor Market Revenues & Volume, By Industrial, 2021- 2031F |
6.6.5 Latvia SiC Power Semiconductor Market Revenues & Volume, By Commercial, 2021- 2031F |
6.6.6 Latvia SiC Power Semiconductor Market Revenues & Volume, By Others, 2021- 2031F |
7 Latvia SiC Power Semiconductor Market Import-Export Trade Statistics |
7.1 Latvia SiC Power Semiconductor Market Export to Major Countries |
7.2 Latvia SiC Power Semiconductor Market Imports from Major Countries |
8 Latvia SiC Power Semiconductor Market Key Performance Indicators |
8.1 Average selling price of SiC power semiconductors |
8.2 Adoption rate of SiC power semiconductors in key industries |
8.3 Number of research and development projects focused on enhancing SiC semiconductor technology |
8.4 Efficiency improvement rate of SiC power semiconductors in various applications |
9 Latvia SiC Power Semiconductor Market - Opportunity Assessment |
9.1 Latvia SiC Power Semiconductor Market Opportunity Assessment, By Type, 2021 & 2031F |
9.2 Latvia SiC Power Semiconductor Market Opportunity Assessment, By Voltage Range, 2021 & 2031F |
9.3 Latvia SiC Power Semiconductor Market Opportunity Assessment, By Wafer Size, 2021 & 2031F |
9.4 Latvia SiC Power Semiconductor Market Opportunity Assessment, By Wafer Type, 2021 & 2031F |
9.5 Latvia SiC Power Semiconductor Market Opportunity Assessment, By Application, 2021 & 2031F |
9.6 Latvia SiC Power Semiconductor Market Opportunity Assessment, By Vertical, 2021 & 2031F |
10 Latvia SiC Power Semiconductor Market - Competitive Landscape |
10.1 Latvia SiC Power Semiconductor Market Revenue Share, By Companies, 2024 |
10.2 Latvia SiC Power Semiconductor Market Competitive Benchmarking, By Operating and Technical Parameters |
11 Company Profiles |
12 Recommendations |
13 Disclaimer |
Global Go To Market Strategy - 2030
Export potential enables firms to identify high-growth global markets with greater confidence by combining advanced trade intelligence with a structured quantitative methodology. The framework analyzes emerging demand trends and country-level import patterns while integrating macroeconomic and trade datasets such as GDP and population forecasts, bilateral import–export flows, tariff structures, elasticity differentials between developed and developing economies, geographic distance, and import demand projections. Using weighted trade values from 2020–2024 as the base period to project country-to-country export potential for 2030, these inputs are operationalized through calculated drivers such as gravity model parameters, tariff impact factors, and projected GDP per-capita growth. Through an analysis of hidden potentials, demand hotspots, and market conditions that are most favorable to success, this method enables firms to focus on target countries, maximize returns, and global expansion with data, backed by accuracy.
By factoring in the projected importer demand gap that is currently unmet and could be potential opportunity, it identifies the potential for the Exporter (Country) among 190 countries, against the general trade analysis, which identifies the biggest importer or exporter.
To discover high-growth global markets and optimize your business strategy:
Click Here
Pricing
- Single User License$ 1,995
- Department License$ 2,400
- Site License$ 3,120
- Global License$ 3,795

Leadership Perspectives from Industry Events
Search
Thought Leadership and Analyst Meet


Our Clients
6WResearch In News
- Doha a strategic location for EV manufacturing hub: IPA Qatar
- Demand for luxury TVs surging in the GCC, says Samsung
- Empowering Growth: The Thriving Journey of Bangladesh’s Cable Industry
- Demand for luxury TVs surging in the GCC, says Samsung
- Video call with a traditional healer? Once unthinkable, it’s now common in South Africa
- Intelligent Buildings To Smooth GCC’s Path To Net Zero
Latest Reports
- Taiwan Airport Wireless Infrastructure Market (2026-2032)
- Vietnam Airport Wireless Infrastructure Market (2026-2032)
- Thailand Airport Wireless Infrastructure Market (2026-2032)
- South Korea Airport Wireless Infrastructure Market (2026-2032)
- Romania Airport Wireless Infrastructure Market (2026-2032)
- Qatar Airport Wireless Infrastructure Market (2026-2032)
- Philippines Airport Wireless Infrastructure Market (2026-2032)
- Japan Airport Wireless Infrastructure Market (2026-2032)
- Taiwan Airport Winter Services Market (2026-2032)
- Vietnam Airport Winter Services Market (2026-2032)
Industry Events and Analyst Meet

HIMTEX 2026

India Refining Summit 2026

India EV Show 2026

EV tech India Expo 2026

Auto Tech Asia 2026
Whitepaper
- Middle East & Africa Commercial Security Market Click here to view more.
- Middle East & Africa Fire Safety Systems & Equipment Market Click here to view more.
- GCC Drone Market Click here to view more.
- Middle East Lighting Fixture Market Click here to view more.
- GCC Physical & Perimeter Security Market Click here to view more.