Latvia Vulcanization Accelerators Market (2026-2032) | Growth, Forecast, Value, Outlook, Companies, Share, Revenue, Size, Trends, Industry, Analysis & Segmentation
Market Forecast By Product Type (Thiozoles, Sulfanamides, Dithiocarbamates, Thiuram, Others), By Application (Automotive, Industrial, Medical, Consumer Goods) And Competitive Landscape
| Product Code: ETC5331492 | Publication Date: Nov 2023 | Updated Date: Apr 2026 | Product Type: Market Research Report | |
| Publisher: 6Wresearch | Author: Ravi Bhandari | No. of Pages: 60 | No. of Figures: 30 | No. of Tables: 5 |
Latvia Vulcanization Accelerators Market Size (2020-2030)
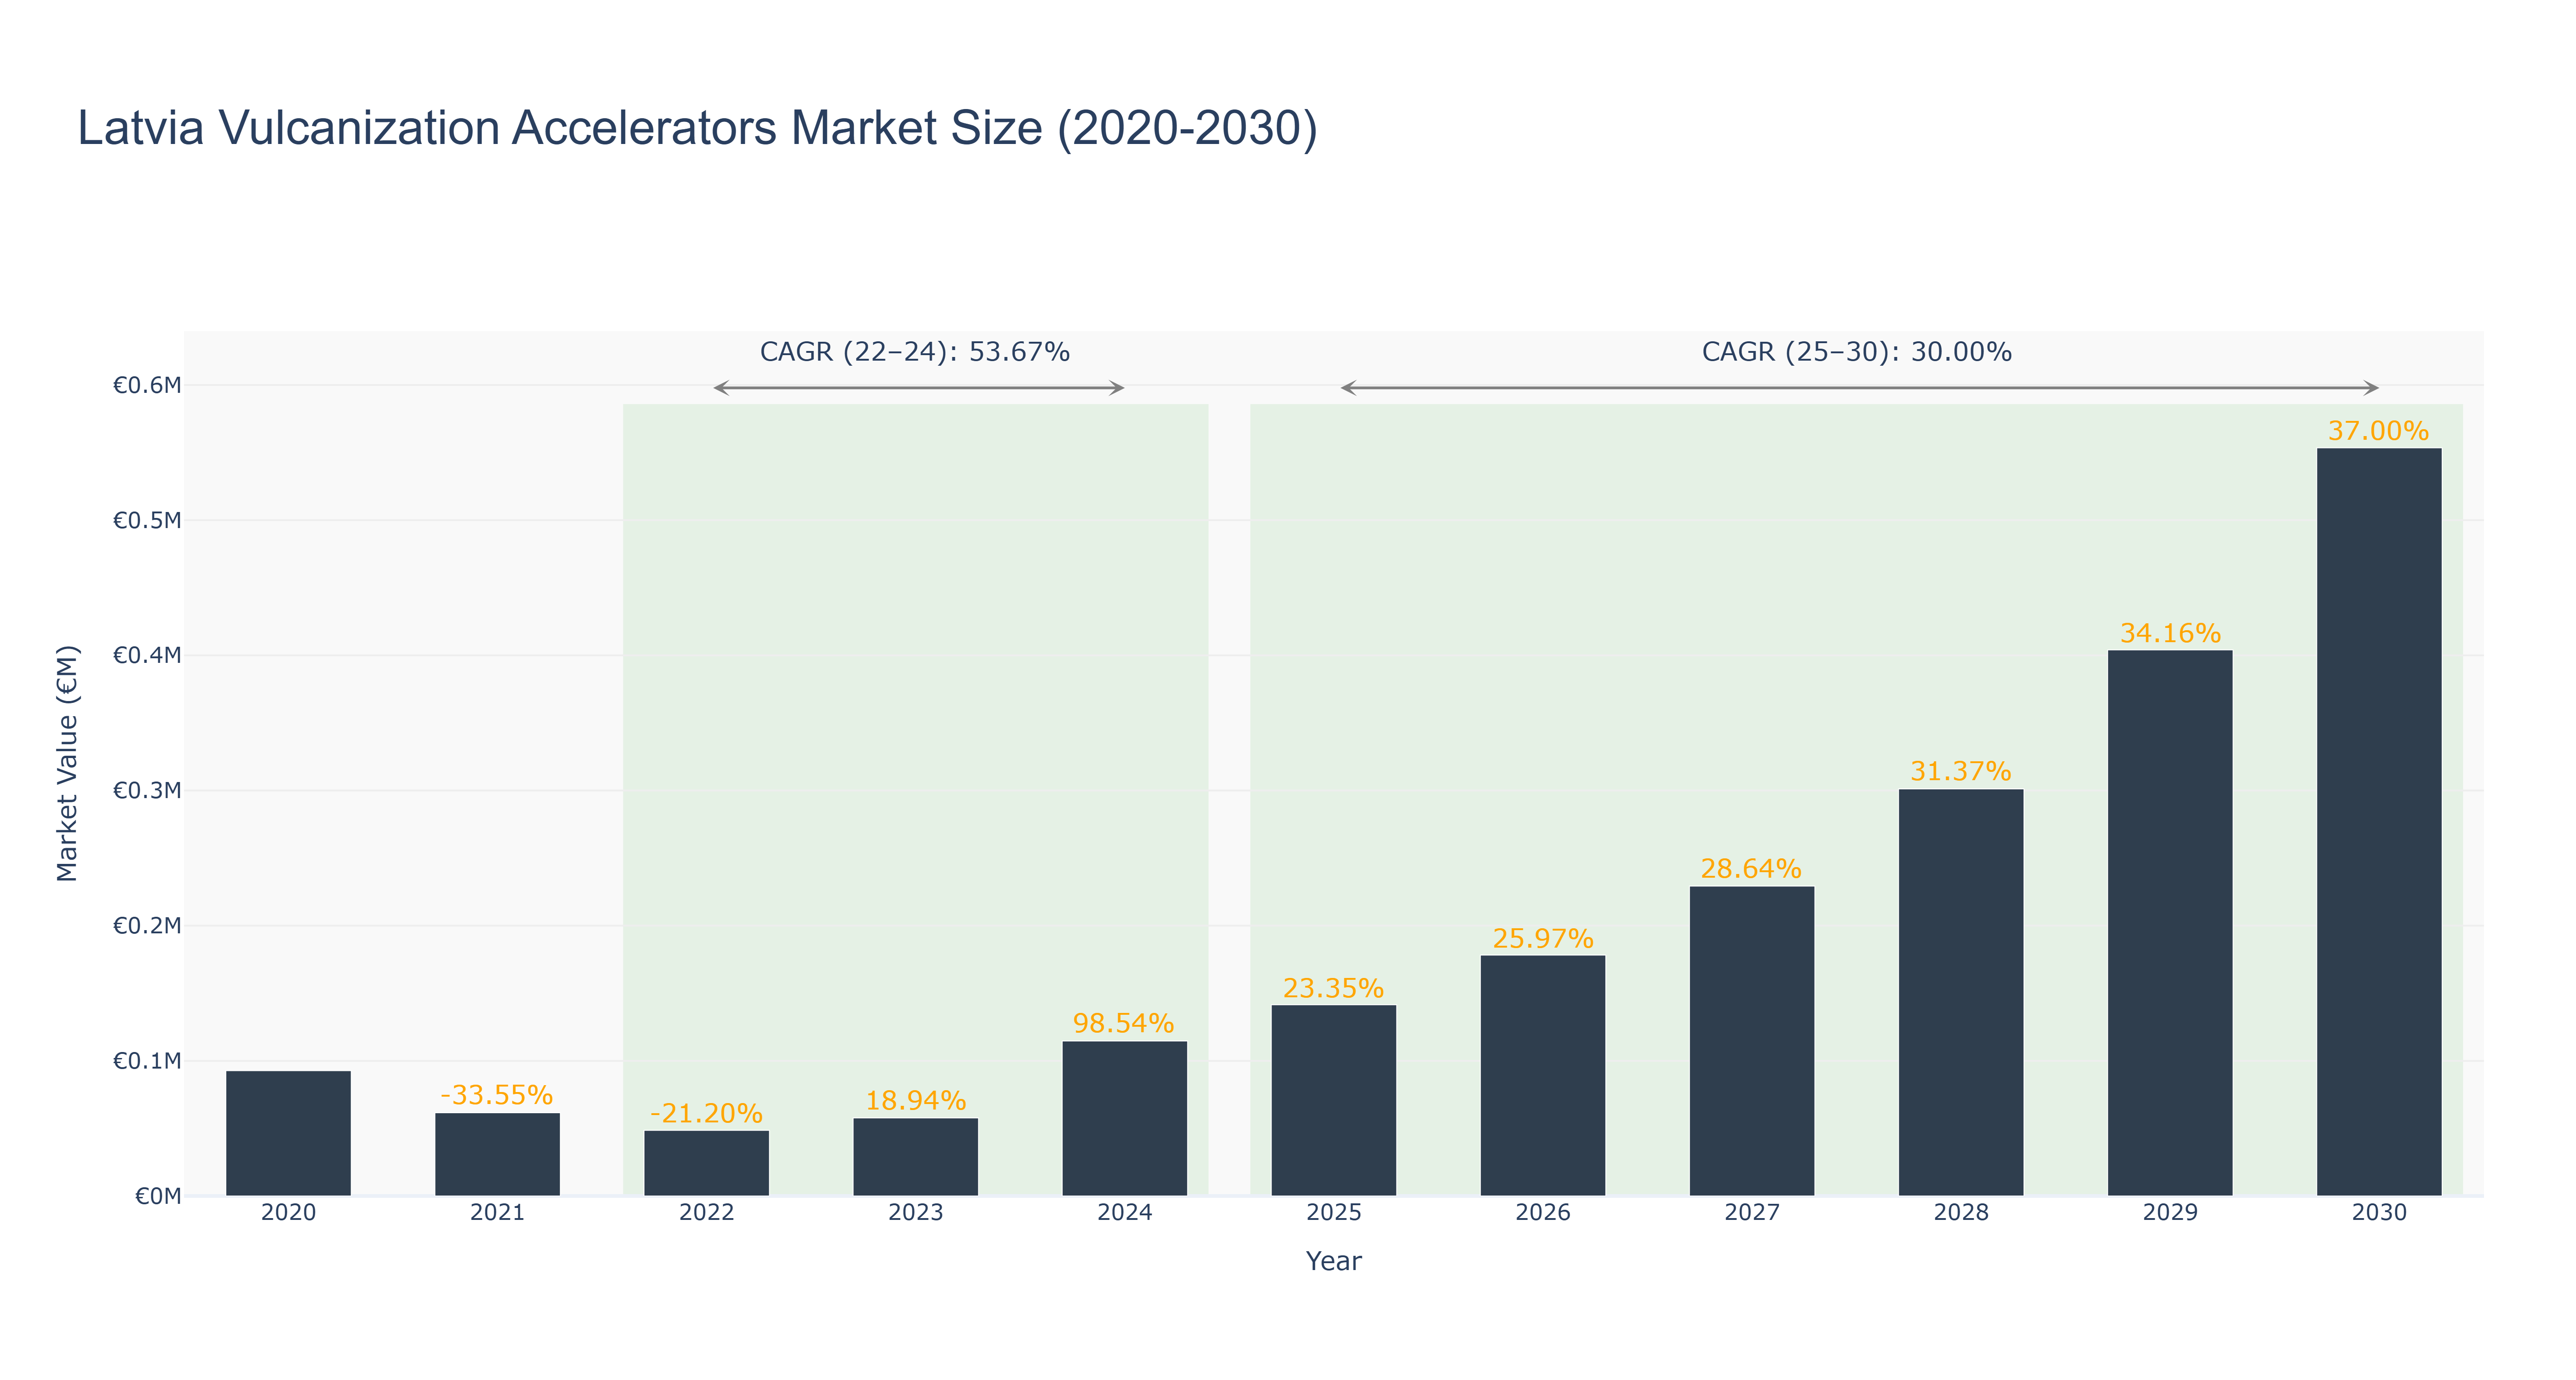
Latvia Vulcanization Accelerators Market has shown a fluctuating trend in recent years. The peak market size of €0.55 million was achieved in 2030, with a steady growth trajectory from 2020 to 2024, reaching €0.11 million in 2024. The forecasted market size is expected to continue expanding from €0.14 million in 2025 to €0.55 million in 2030, with a CAGR of 30.0% from 2025 to 2030. The market experienced a significant growth spurt from 2024 onwards, driven by increased demand for vulcanization accelerators in various industries. Looking ahead, Latvia is set to witness advancements in sustainable manufacturing practices within the vulcanization accelerators sector, aligning with the country's commitment to environmental sustainability and innovation. This market trend reflects the evolving landscape of the Latvian industrial sector, poised for further growth and development in the coming years.
Latvia Vulcanization Accelerators Market: Production & Trade Performance (2019-2025)
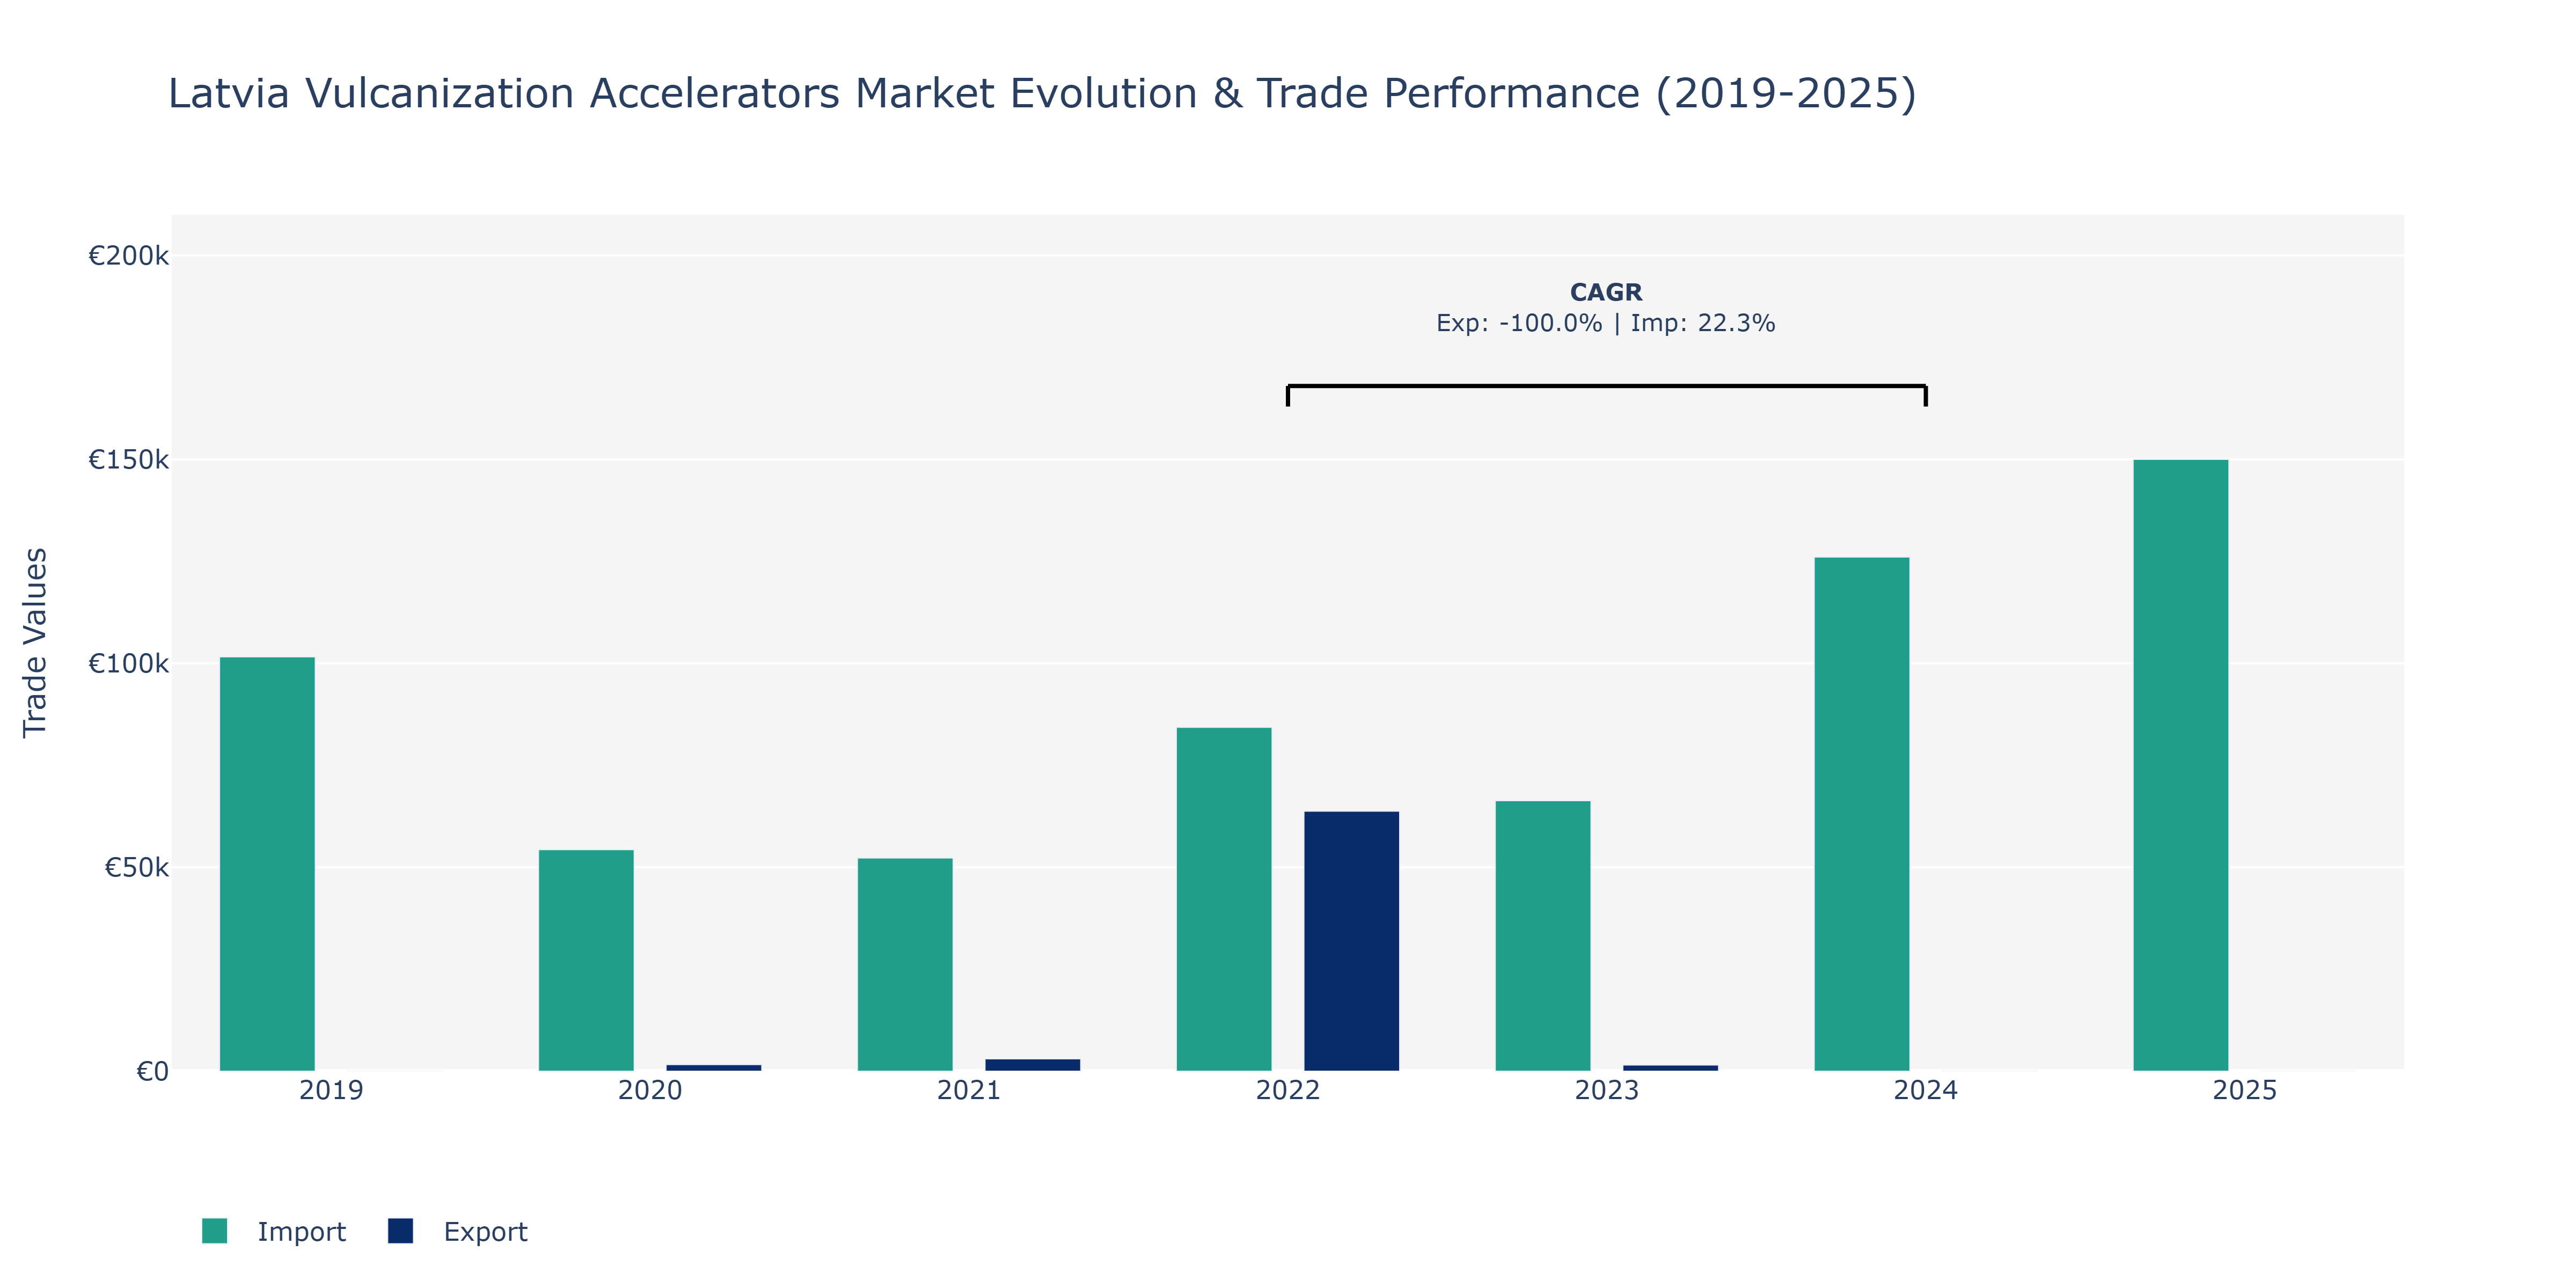
The Latvia Vulcanization Accelerators Market witnessed substantial fluctuations in both Exports and Imports over the period provided. Exports started at €10.0 thousand in 2019, saw a significant increase in 2022 to €63.74 thousand, before dropping in the following years. Imports, on the other hand, increased gradually from €101.6 thousand in 2019 to €150.01 thousand in 2025. Notably, imports experienced a peak in 2025, marking a 47.71% increase from the previous year. The surge in Exports in 2022 can be attributed to increased demand for vulcanization accelerators, possibly due to expansion in the automotive and manufacturing sectors in the region. Conversely, the fluctuations in Imports could be influenced by global raw material prices, economic conditions affecting trading partners, and shifts in domestic manufacturing capabilities. These trends highlight the market's sensitivity to external economic factors, necessitating strategic planning to navigate future uncertainties.
Key Highlights of the Report:
- Latvia Vulcanization Accelerators Market Outlook
- Market Size of Latvia Vulcanization Accelerators Market, 2025
- Forecast of Latvia Vulcanization Accelerators Market, 2032
- Historical Data and Forecast of Latvia Vulcanization Accelerators Revenues & Volume for the Period 2022 - 2032F
- Latvia Vulcanization Accelerators Market Trend Evolution
- Latvia Vulcanization Accelerators Market Drivers and Challenges
- Latvia Vulcanization Accelerators Price Trends
- Latvia Vulcanization Accelerators Porter`s Five Forces
- Latvia Vulcanization Accelerators Industry Life Cycle
- Historical Data and Forecast of Latvia Vulcanization Accelerators Market Revenues & Volume By Product Type for the Period 2022 - 2032F
- Historical Data and Forecast of Latvia Vulcanization Accelerators Market Revenues & Volume By Thiozoles for the Period 2022 - 2032F
- Historical Data and Forecast of Latvia Vulcanization Accelerators Market Revenues & Volume By Sulfanamides for the Period 2022 - 2032F
- Historical Data and Forecast of Latvia Vulcanization Accelerators Market Revenues & Volume By Dithiocarbamates for the Period 2022 - 2032F
- Historical Data and Forecast of Latvia Vulcanization Accelerators Market Revenues & Volume By Thiuram for the Period 2022 - 2032F
- Historical Data and Forecast of Latvia Vulcanization Accelerators Market Revenues & Volume By Others for the Period 2022 - 2032F
- Historical Data and Forecast of Latvia Vulcanization Accelerators Market Revenues & Volume By Application for the Period 2022 - 2032F
- Historical Data and Forecast of Latvia Vulcanization Accelerators Market Revenues & Volume By Automotive for the Period 2022 - 2032F
- Historical Data and Forecast of Latvia Vulcanization Accelerators Market Revenues & Volume By Industrial for the Period 2022 - 2032F
- Historical Data and Forecast of Latvia Vulcanization Accelerators Market Revenues & Volume By Medical for the Period 2022 - 2032F
- Historical Data and Forecast of Latvia Vulcanization Accelerators Market Revenues & Volume By Consumer Goods for the Period 2022 - 2032F
- Latvia Vulcanization Accelerators Import Export Trade Statistics
- Market Opportunity Assessment By Product Type
- Market Opportunity Assessment By Application
- Latvia Vulcanization Accelerators Top Companies Market Share
- Latvia Vulcanization Accelerators Competitive Benchmarking By Technical and Operational Parameters
- Latvia Vulcanization Accelerators Company Profiles
- Latvia Vulcanization Accelerators Key Strategic Recommendations
Frequently Asked Questions About the Market Study (FAQs):
6Wresearch actively monitors the Latvia Vulcanization Accelerators Market and publishes its comprehensive annual report, highlighting emerging trends, growth drivers, revenue analysis, and forecast outlook. Our insights help businesses to make data-backed strategic decisions with ongoing market dynamics. Our analysts track relevent industries related to the Latvia Vulcanization Accelerators Market, allowing our clients with actionable intelligence and reliable forecasts tailored to emerging regional needs.
Yes, we provide customisation as per your requirements. To learn more, feel free to contact us on sales@6wresearch.com
1 Executive Summary |
2 Introduction |
2.1 Key Highlights of the Report |
2.2 Report Description |
2.3 Market Scope & Segmentation |
2.4 Research Methodology |
2.5 Assumptions |
3 Latvia Vulcanization Accelerators Market Overview |
3.1 Latvia Country Macro Economic Indicators |
3.2 Latvia Vulcanization Accelerators Market Revenues & Volume, 2022 & 2032F |
3.3 Latvia Vulcanization Accelerators Market - Industry Life Cycle |
3.4 Latvia Vulcanization Accelerators Market - Porter's Five Forces |
3.5 Latvia Vulcanization Accelerators Market Revenues & Volume Share, By Product Type, 2022 & 2032F |
3.6 Latvia Vulcanization Accelerators Market Revenues & Volume Share, By Application, 2022 & 2032F |
4 Latvia Vulcanization Accelerators Market Dynamics |
4.1 Impact Analysis |
4.2 Market Drivers |
4.2.1 Increasing demand for tires in the automotive industry |
4.2.2 Growing focus on sustainability and environmental regulations driving the use of vulcanization accelerators |
4.2.3 Technological advancements leading to the development of more efficient accelerators |
4.3 Market Restraints |
4.3.1 Fluctuating raw material prices impacting production costs |
4.3.2 Regulatory challenges related to chemical usage in manufacturing processes |
4.3.3 Competition from alternative materials affecting market growth |
5 Latvia Vulcanization Accelerators Market Trends |
6 Latvia Vulcanization Accelerators Market Segmentations |
6.1 Latvia Vulcanization Accelerators Market, By Product Type |
6.1.1 Overview and Analysis |
6.1.2 Latvia Vulcanization Accelerators Market Revenues & Volume, By Thiozoles, 2022 - 2032F |
6.1.3 Latvia Vulcanization Accelerators Market Revenues & Volume, By Sulfanamides, 2022 - 2032F |
6.1.4 Latvia Vulcanization Accelerators Market Revenues & Volume, By Dithiocarbamates, 2022 - 2032F |
6.1.5 Latvia Vulcanization Accelerators Market Revenues & Volume, By Thiuram, 2022 - 2032F |
6.1.6 Latvia Vulcanization Accelerators Market Revenues & Volume, By Others, 2022 - 2032F |
6.2 Latvia Vulcanization Accelerators Market, By Application |
6.2.1 Overview and Analysis |
6.2.2 Latvia Vulcanization Accelerators Market Revenues & Volume, By Automotive, 2022 - 2032F |
6.2.3 Latvia Vulcanization Accelerators Market Revenues & Volume, By Industrial, 2022 - 2032F |
6.2.4 Latvia Vulcanization Accelerators Market Revenues & Volume, By Medical, 2022 - 2032F |
6.2.5 Latvia Vulcanization Accelerators Market Revenues & Volume, By Consumer Goods, 2022 - 2032F |
7 Latvia Vulcanization Accelerators Market Import-Export Trade Statistics |
7.1 Latvia Vulcanization Accelerators Market Export to Major Countries |
7.2 Latvia Vulcanization Accelerators Market Imports from Major Countries |
8 Latvia Vulcanization Accelerators Market Key Performance Indicators |
8.1 Research and development investment in eco-friendly accelerators |
8.2 Adoption rate of innovative vulcanization accelerator technologies |
8.3 Number of partnerships with key players in the automotive industry to expand market reach |
9 Latvia Vulcanization Accelerators Market - Opportunity Assessment |
9.1 Latvia Vulcanization Accelerators Market Opportunity Assessment, By Product Type, 2022 & 2032F |
9.2 Latvia Vulcanization Accelerators Market Opportunity Assessment, By Application, 2022 & 2032F |
10 Latvia Vulcanization Accelerators Market - Competitive Landscape |
10.1 Latvia Vulcanization Accelerators Market Revenue Share, By Companies, 2025 |
10.2 Latvia Vulcanization Accelerators Market Competitive Benchmarking, By Operating and Technical Parameters |
11 Company Profiles |
12 Recommendations | 13 Disclaimer |
Export potential assessment - trade Analytics for 2030
Export potential enables firms to identify high-growth global markets with greater confidence by combining advanced trade intelligence with a structured quantitative methodology. The framework analyzes emerging demand trends and country-level import patterns while integrating macroeconomic and trade datasets such as GDP and population forecasts, bilateral import–export flows, tariff structures, elasticity differentials between developed and developing economies, geographic distance, and import demand projections. Using weighted trade values from 2020–2024 as the base period to project country-to-country export potential for 2030, these inputs are operationalized through calculated drivers such as gravity model parameters, tariff impact factors, and projected GDP per-capita growth. Through an analysis of hidden potentials, demand hotspots, and market conditions that are most favorable to success, this method enables firms to focus on target countries, maximize returns, and global expansion with data, backed by accuracy.
By factoring in the projected importer demand gap that is currently unmet and could be potential opportunity, it identifies the potential for the Exporter (Country) among 190 countries, against the general trade analysis, which identifies the biggest importer or exporter.
To discover high-growth global markets and optimize your business strategy:
Click Here
Pricing
- Single User License$ 1,995
- Department License$ 2,400
- Site License$ 3,120
- Global License$ 3,795

Search
Thought Leadership and Analyst Meet


Our Clients
Latest Reports
- Philippines Polyhydroxybutyrate-co-Hydroxyvalerate Market (2026-2032) | Trends, Insights, Challenges, Restraints, Competition, Size, Value, Forecast, Pricing, Share, Outlook, Revenue, Investment Opportunities, Strategy, Drivers, Demand, Growth, segmentation, Analysis, Companies
- Peru Polyhydroxybutyrate-co-Hydroxyvalerate Market (2026-2032) | Growth, Demand, Challenges, Share, Trends, Analysis, Pricing, Investment Opportunities, Drivers, Value, Forecast, Competition, Size, Companies, Insights, Outlook, Restraints, segmentation, Revenue, Strategy
- Pakistan Polyhydroxybutyrate-co-Hydroxyvalerate Market (2026-2032) | Restraints, segmentation, Pricing, Forecast, Share, Strategy, Competition, Trends, Insights, Drivers, Challenges, Growth, Revenue, Outlook, Value, Investment Opportunities, Companies, Size, Analysis, Demand
- Oman Polyhydroxybutyrate-co-Hydroxyvalerate Market (2026-2032) | Drivers, segmentation, Insights, Competition, Pricing, Outlook, Size, Revenue, Challenges, Forecast, Analysis, Growth, Value, Share, Trends, Investment Opportunities, Strategy, Restraints, Companies, Demand
- Nigeria Polyhydroxybutyrate-co-Hydroxyvalerate Market (2026-2032) | Value, Investment Opportunities, Analysis, Revenue, Restraints, Pricing, Outlook, Competition, Demand, Growth, Forecast, Companies, Trends, Challenges, segmentation, Drivers, Insights, Share, Size, Strategy
- Nepal Polyhydroxybutyrate-co-Hydroxyvalerate Market (2026-2032) | Insights, Analysis, Drivers, Share, Revenue, Demand, segmentation, Investment Opportunities, Competition, Forecast, Growth, Pricing, Companies, Strategy, Trends, Restraints, Challenges, Outlook, Size, Value
- Myanmar Polyhydroxybutyrate-co-Hydroxyvalerate Market (2026-2032) | Outlook, Revenue, Strategy, Restraints, Drivers, segmentation, Share, Forecast, Competition, Insights, Growth, Pricing, Size, Demand, Value, Companies, Trends, Challenges, Investment Opportunities, Analysis
- Morocco Polyhydroxybutyrate-co-Hydroxyvalerate Market (2026-2032) | Outlook, Investment Opportunities, Restraints, Strategy, Forecast, Challenges, Drivers, Growth, Companies, segmentation, Trends, Size, Competition, Revenue, Demand, Insights, Share, Analysis, Value, Pricing
- Mexico Polyhydroxybutyrate-co-Hydroxyvalerate Market (2026-2032) | Size, Drivers, Outlook, Share, Strategy, Growth, Pricing, Challenges, Companies, Demand, Value, Investment Opportunities, Restraints, Trends, Forecast, segmentation, Analysis, Insights, Competition, Revenue
- Malaysia Polyhydroxybutyrate-co-Hydroxyvalerate Market (2026-2032) | Share, segmentation, Size, Companies, Analysis, Insights, Forecast, Value, Revenue, Drivers, Restraints, Challenges, Investment Opportunities, Trends, Competition, Strategy, Demand, Growth, Outlook, Pricing
Industry Events and Analyst Meet

HIMTEX 2026

India Refining Summit 2026

India EV Show 2026

EV tech India Expo 2026

Auto Tech Asia 2026
Whitepaper
- Middle East & Africa Commercial Security Market Click here to view more.
- Middle East & Africa Fire Safety Systems & Equipment Market Click here to view more.
- GCC Drone Market Click here to view more.
- Middle East Lighting Fixture Market Click here to view more.
- GCC Physical & Perimeter Security Market Click here to view more.
6WResearch In News
- Doha a strategic location for EV manufacturing hub: IPA Qatar
- Demand for luxury TVs surging in the GCC, says Samsung
- Empowering Growth: The Thriving Journey of Bangladesh’s Cable Industry
- Demand for luxury TVs surging in the GCC, says Samsung
- Video call with a traditional healer? Once unthinkable, it’s now common in South Africa
- Intelligent Buildings To Smooth GCC’s Path To Net Zero