Lithuania 3D PA (Polyamide) Market (2026-2032) | Forecast, Share, Value, Size, Segmentation, Companies, Analysis, Outlook, Industry, Revenue, Growth & Trends
Market Forecast By Application (Healthcare, Aerospace & Defense, Automotive, Electronics, Others), By Type (PA11, PA12) And Competitive Landscape
| Product Code: ETC5739123 | Publication Date: Nov 2023 | Updated Date: Apr 2026 | Product Type: Market Research Report | |
| Publisher: 6Wresearch | Author: Ravi Bhandari | No. of Pages: 60 | No. of Figures: 30 | No. of Tables: 5 |
Lithuania 3D Pa (Polyamide) Market Size (2020-2030)
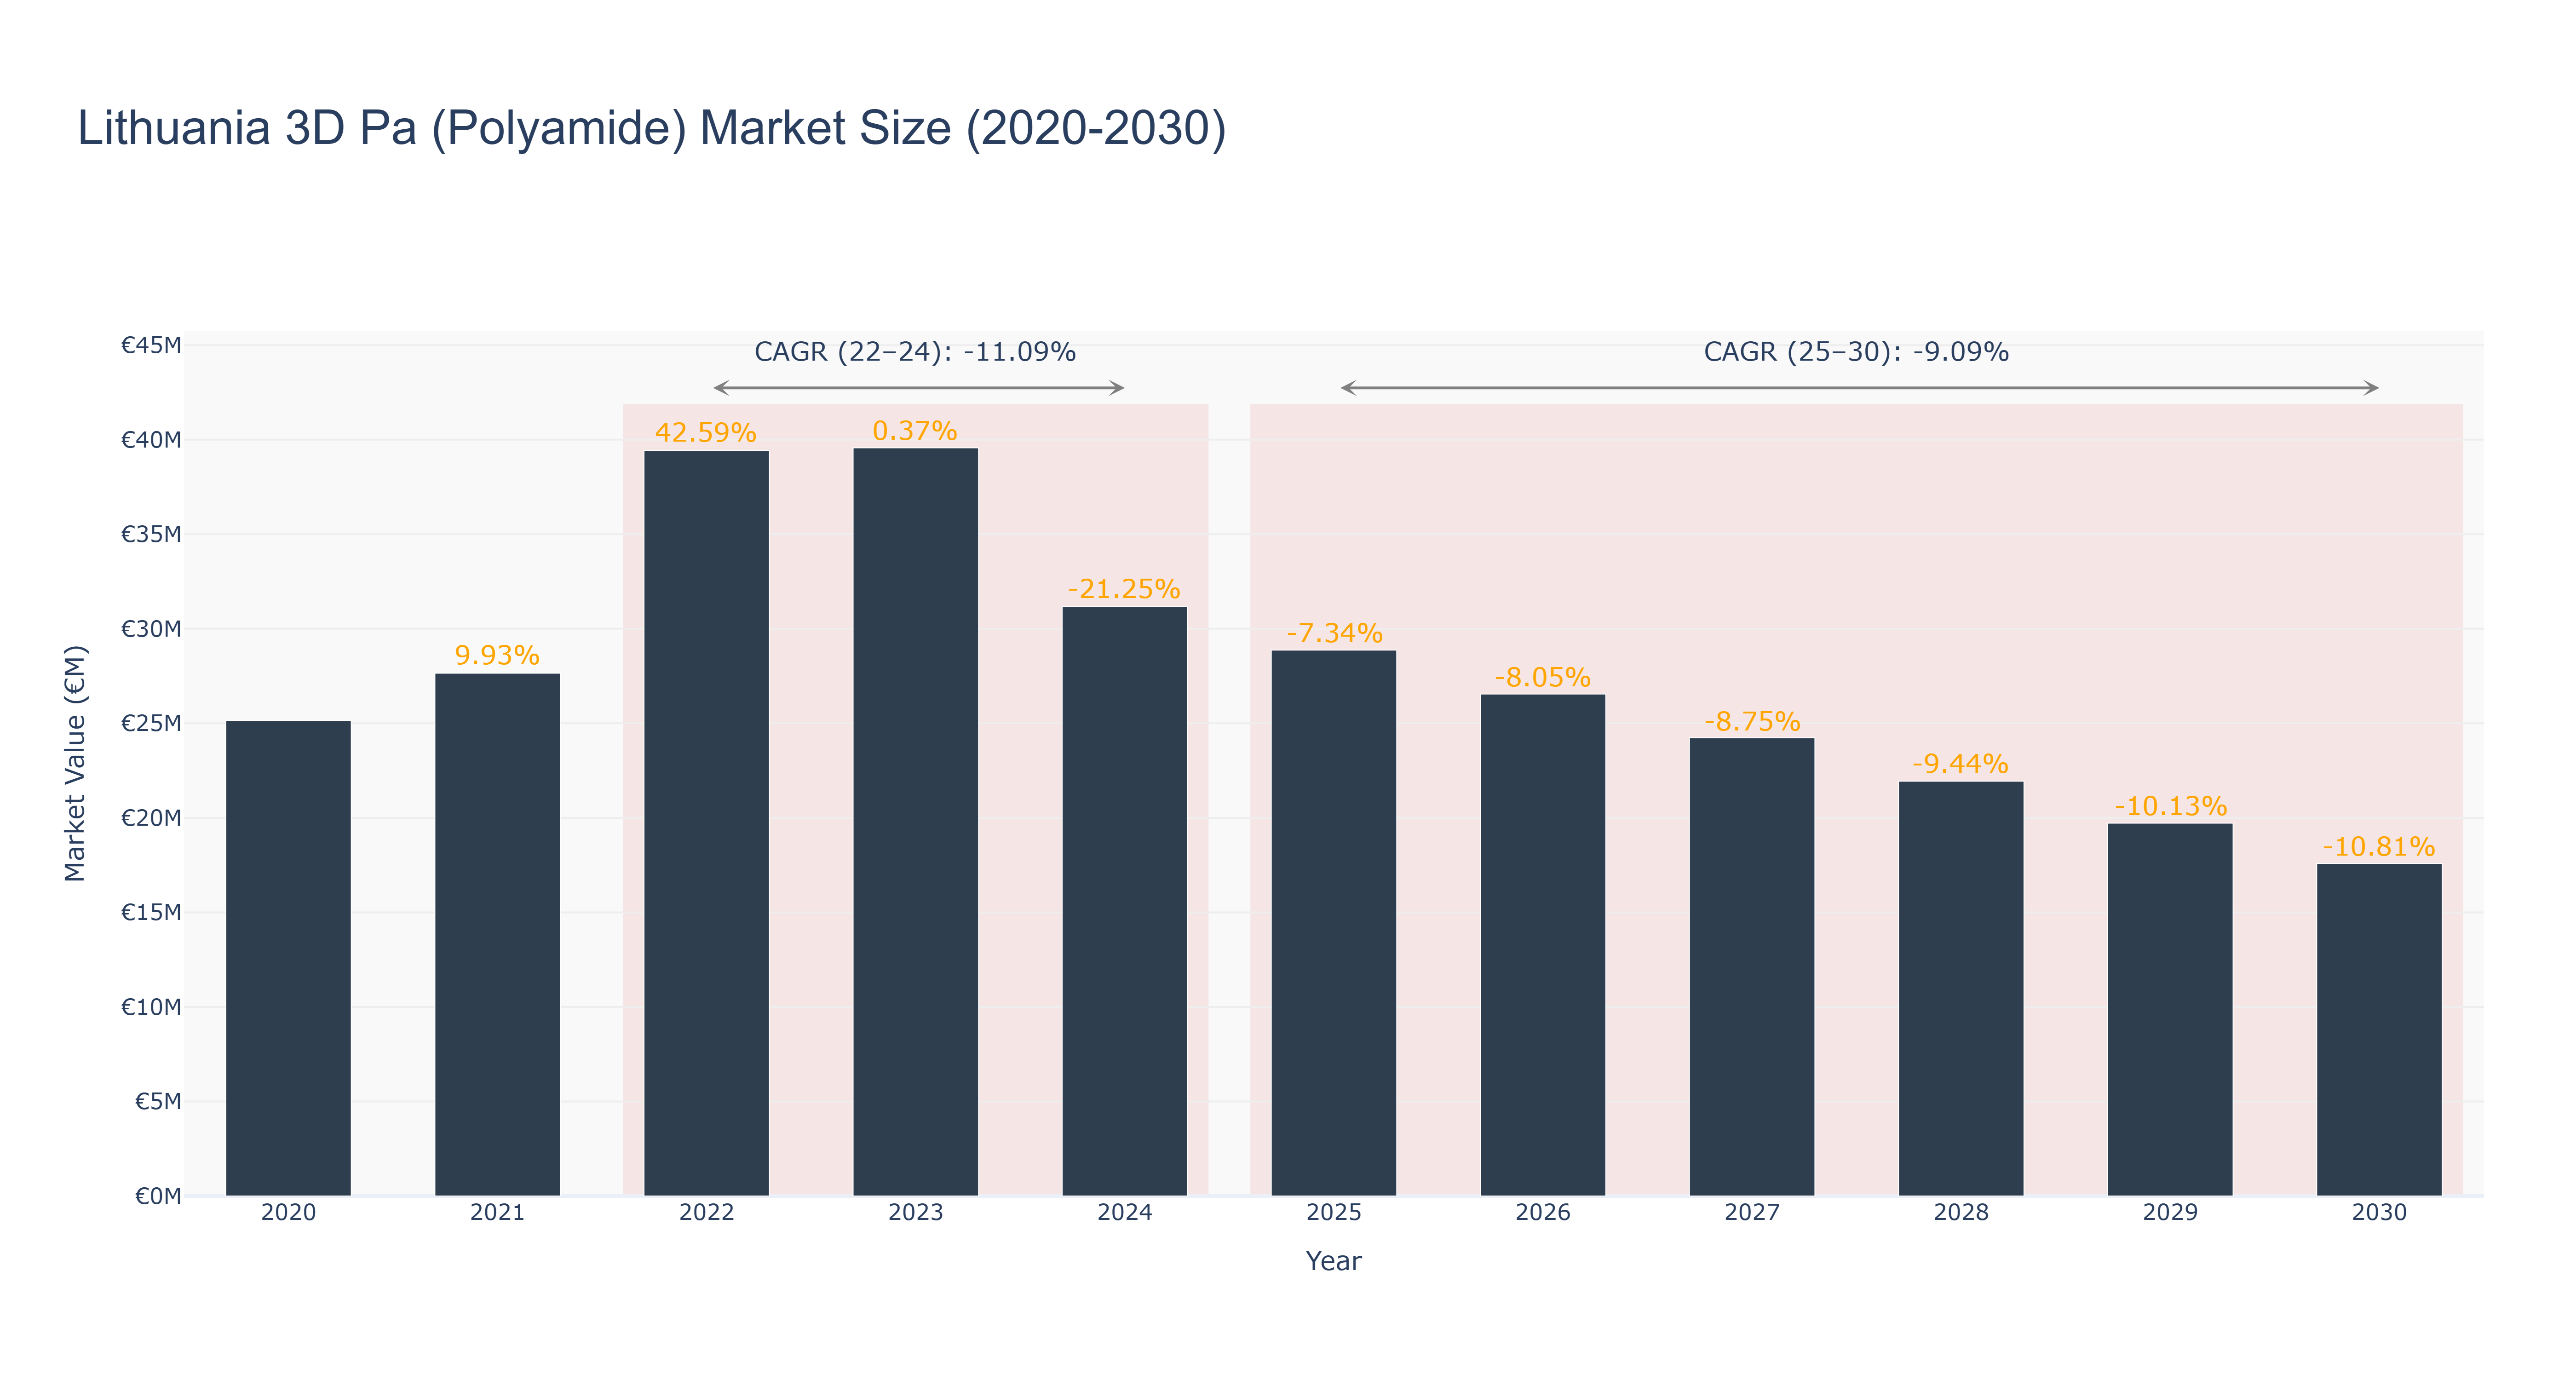
The Lithuania 3D Pa (Polyamide) Market experienced a peak market size of €39.57 million in 2023. The actual market size saw fluctuations from €25.15 million in 2020 to a low of €17.59 million in 2030. The market is forecasted to continue declining with a CAGR of -9.09% from 2025 to 2030. The downward trend can be attributed to factors such as increased competition, changing consumer preferences, and economic uncertainties. However, recent developments in sustainable manufacturing processes and collaborations with global players are expected to drive growth in the near future. These initiatives aim to enhance product innovation and market penetration, potentially reversing the current downward trajectory. The industry's resilience and adaptability to market dynamics will be crucial in navigating the challenging landscape and seizing future opportunities.
Lithuania 3D Pa (Polyamide) Market: Production & Trade Performance (2019-2025)
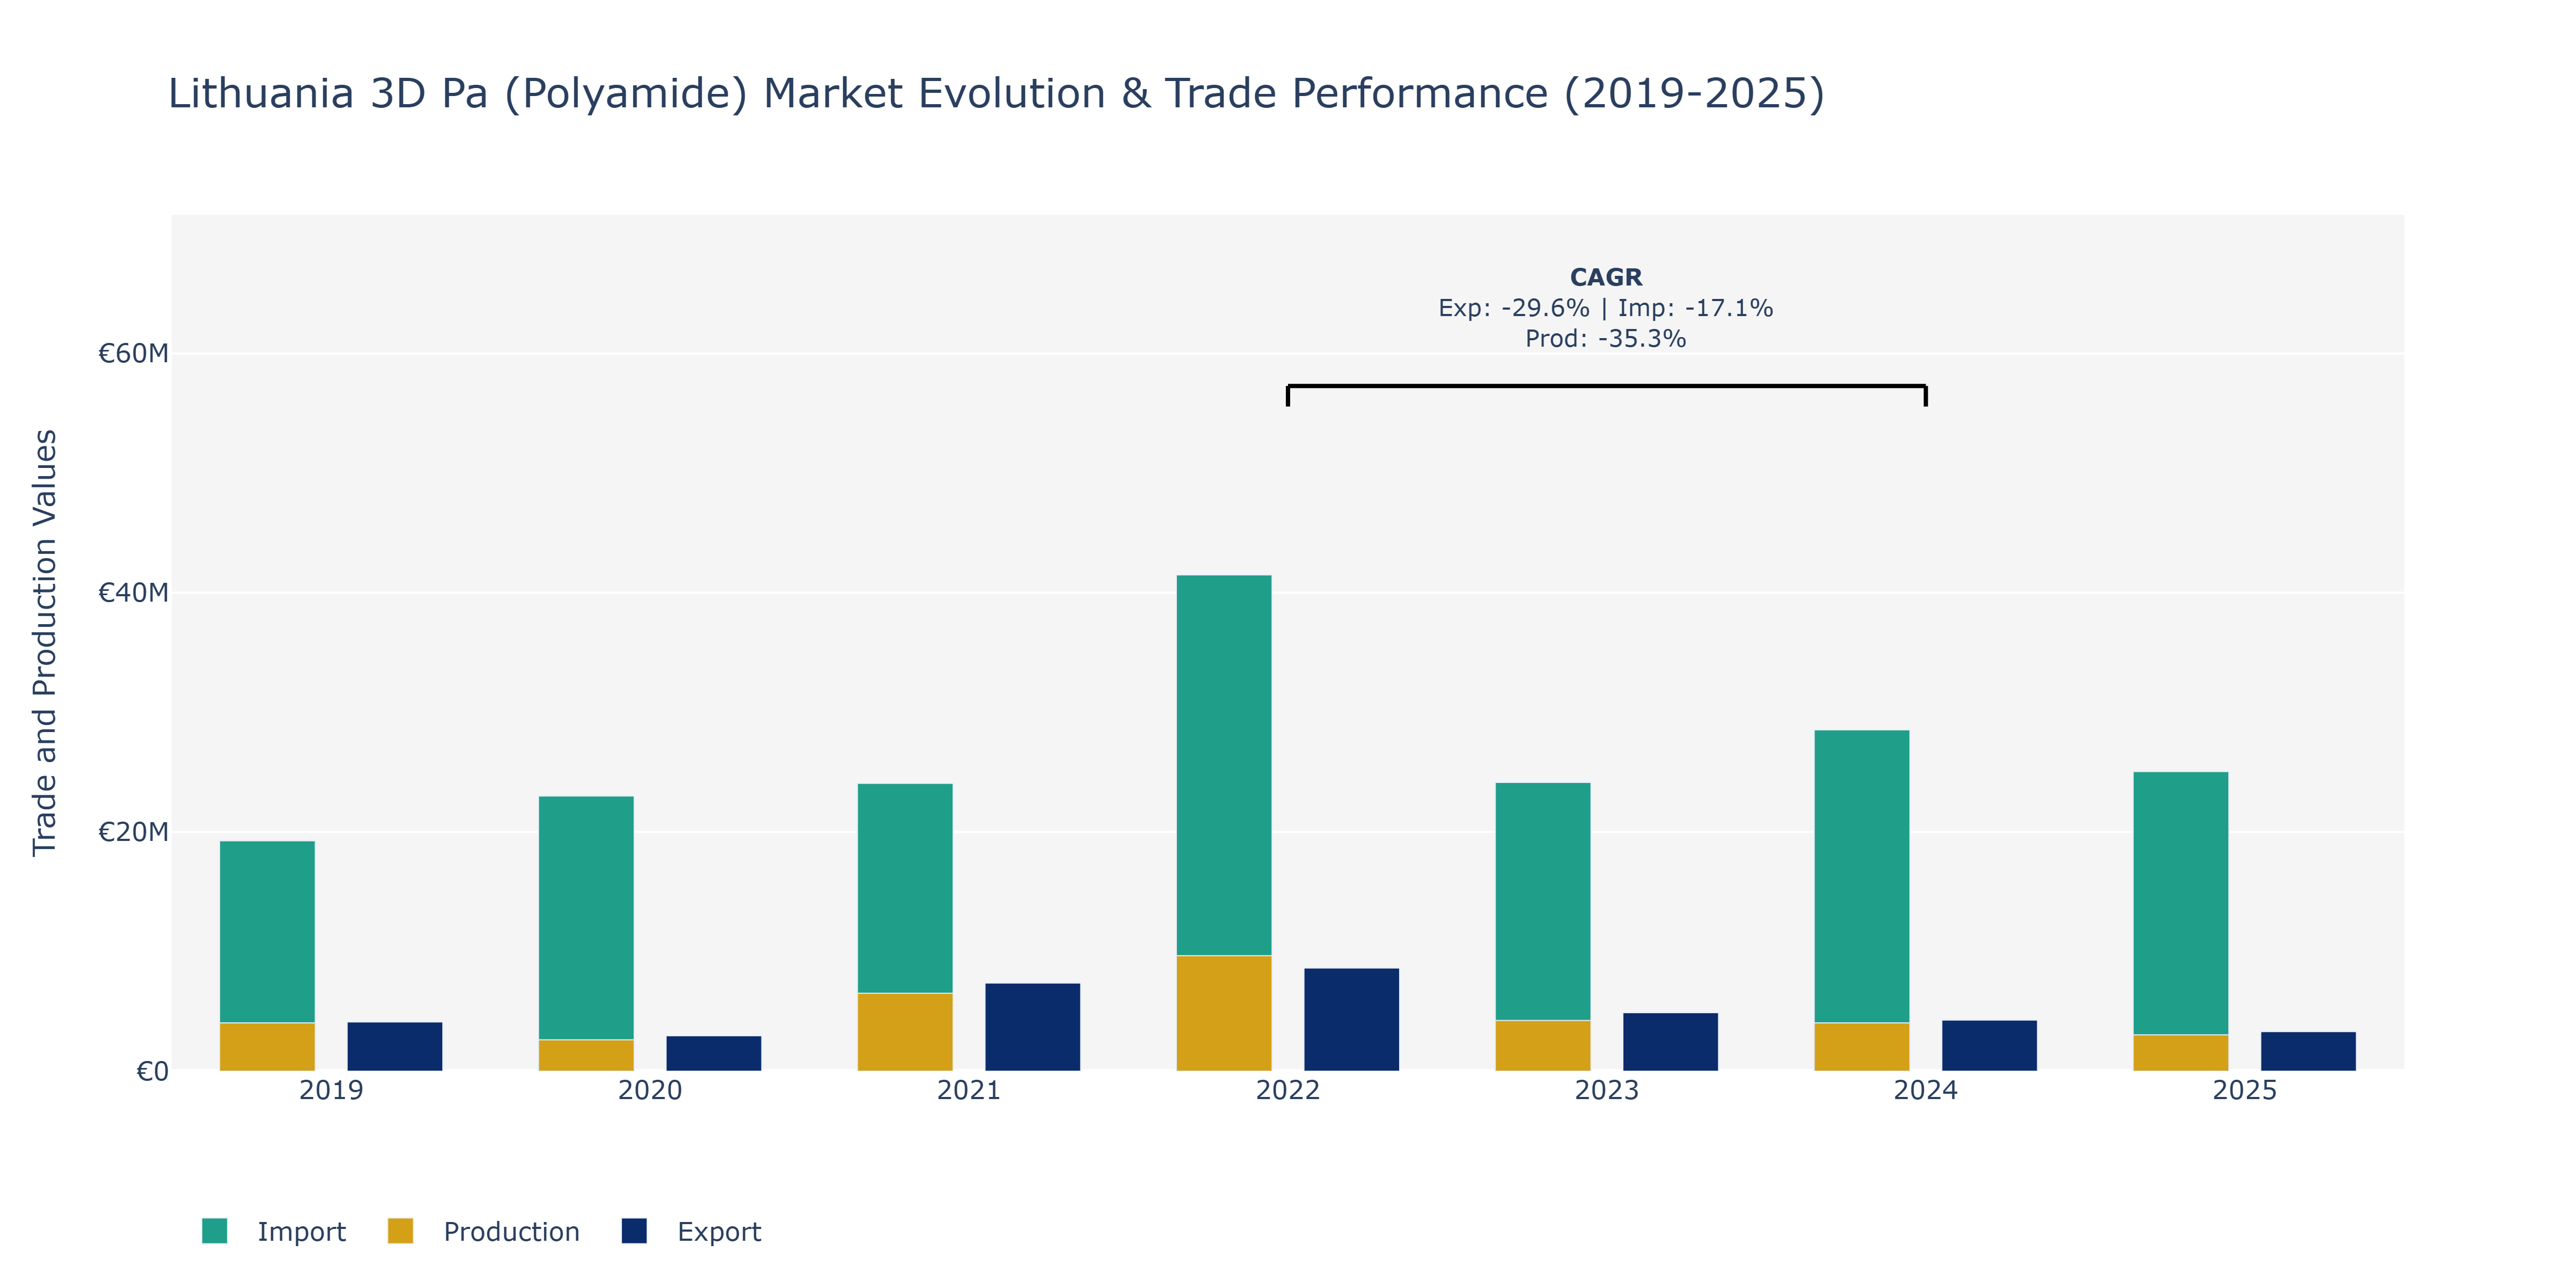
Between 2019 and 2025, Lithuania's 3D Pa (Polyamide) market witnessed varying trends in Exports, Imports, and Production. Exports saw a decline from €4.12 million in 2019 to €3.3 million in 2025, with a peak at €8.62 million in 2022. Conversely, Imports initially increased from €19.26 million in 2019 to €41.49 million in 2022, followed by a downward trend to €25.04 million in 2025. Production value fluctuated, with a significant drop from €4.04 million in 2019 to €3.04 million in 2025. The market's dynamics could be attributed to global economic conditions impacting demand for Polyamide products, production capacity expansions affecting import needs, and technological advancements influencing export competitiveness. Lithuania's strategic position as a manufacturing hub may have influenced these trends alongside the broader industry shifts towards sustainability and digitalization, driving changes in the 3D Pa market.
Key Highlights of the Report:
- Lithuania 3D PA (Polyamide) Market Outlook
- Market Size of Lithuania 3D PA (Polyamide) Market, 2025
- Forecast of Lithuania 3D PA (Polyamide) Market, 2032
- Historical Data and Forecast of Lithuania 3D PA (Polyamide) Revenues & Volume for the Period 2022 - 2032F
- Lithuania 3D PA (Polyamide) Market Trend Evolution
- Lithuania 3D PA (Polyamide) Market Drivers and Challenges
- Lithuania 3D PA (Polyamide) Price Trends
- Lithuania 3D PA (Polyamide) Porter`s Five Forces
- Lithuania 3D PA (Polyamide) Industry Life Cycle
- Historical Data and Forecast of Lithuania 3D PA (Polyamide) Market Revenues & Volume By Application for the Period 2022 - 2032F
- Historical Data and Forecast of Lithuania 3D PA (Polyamide) Market Revenues & Volume By Healthcare for the Period 2022 - 2032F
- Historical Data and Forecast of Lithuania 3D PA (Polyamide) Market Revenues & Volume By Aerospace & Defense for the Period 2022 - 2032F
- Historical Data and Forecast of Lithuania 3D PA (Polyamide) Market Revenues & Volume By Automotive for the Period 2022 - 2032F
- Historical Data and Forecast of Lithuania 3D PA (Polyamide) Market Revenues & Volume By Electronics for the Period 2022 - 2032F
- Historical Data and Forecast of Lithuania 3D PA (Polyamide) Market Revenues & Volume By Others for the Period 2022 - 2032F
- Historical Data and Forecast of Lithuania 3D PA (Polyamide) Market Revenues & Volume By Type for the Period 2022 - 2032F
- Historical Data and Forecast of Lithuania 3D PA (Polyamide) Market Revenues & Volume By PA11 for the Period 2022 - 2032F
- Historical Data and Forecast of Lithuania 3D PA (Polyamide) Market Revenues & Volume By PA12 for the Period 2022 - 2032F
- Lithuania 3D PA (Polyamide) Import Export Trade Statistics
- Market Opportunity Assessment By Application
- Market Opportunity Assessment By Type
- Lithuania 3D PA (Polyamide) Top Companies Market Share
- Lithuania 3D PA (Polyamide) Competitive Benchmarking By Technical and Operational Parameters
- Lithuania 3D PA (Polyamide) Company Profiles
- Lithuania 3D PA (Polyamide) Key Strategic Recommendations
Frequently Asked Questions About the Market Study (FAQs):
6Wresearch actively monitors the Lithuania 3D PA (Polyamide) Market and publishes its comprehensive annual report, highlighting emerging trends, growth drivers, revenue analysis, and forecast outlook. Our insights help businesses to make data-backed strategic decisions with ongoing market dynamics. Our analysts track relevent industries related to the Lithuania 3D PA (Polyamide) Market, allowing our clients with actionable intelligence and reliable forecasts tailored to emerging regional needs.
Yes, we provide customisation as per your requirements. To learn more, feel free to contact us on sales@6wresearch.com
1 Executive Summary |
2 Introduction |
2.1 Key Highlights of the Report |
2.2 Report Description |
2.3 Market Scope & Segmentation |
2.4 Research Methodology |
2.5 Assumptions |
3 Lithuania 3D PA (Polyamide) Market Overview |
3.1 Lithuania Country Macro Economic Indicators |
3.2 Lithuania 3D PA (Polyamide) Market Revenues & Volume, 2022 & 2032F |
3.3 Lithuania 3D PA (Polyamide) Market - Industry Life Cycle |
3.4 Lithuania 3D PA (Polyamide) Market - Porter's Five Forces |
3.5 Lithuania 3D PA (Polyamide) Market Revenues & Volume Share, By Application, 2022 & 2032F |
3.6 Lithuania 3D PA (Polyamide) Market Revenues & Volume Share, By Type, 2022 & 2032F |
4 Lithuania 3D PA (Polyamide) Market Dynamics |
4.1 Impact Analysis |
4.2 Market Drivers |
4.2.1 Increasing demand for lightweight and durable materials in various industries such as automotive, aerospace, and electronics. |
4.2.2 Technological advancements in 3D printing technology, leading to improved quality and efficiency in polyamide 3D printing. |
4.2.3 Growing adoption of additive manufacturing in Lithuania, driving the demand for 3D printing materials like polyamide. |
4.3 Market Restraints |
4.3.1 High initial investment costs associated with 3D printing equipment and materials, potentially limiting market growth. |
4.3.2 Lack of awareness and skilled workforce in the field of additive manufacturing and 3D printing. |
4.3.3 Regulatory challenges and intellectual property issues related to the use of 3D printing technology in Lithuania. |
5 Lithuania 3D PA (Polyamide) Market Trends |
6 Lithuania 3D PA (Polyamide) Market Segmentations |
6.1 Lithuania 3D PA (Polyamide) Market, By Application |
6.1.1 Overview and Analysis |
6.1.2 Lithuania 3D PA (Polyamide) Market Revenues & Volume, By Healthcare, 2022 - 2032F |
6.1.3 Lithuania 3D PA (Polyamide) Market Revenues & Volume, By Aerospace & Defense, 2022 - 2032F |
6.1.4 Lithuania 3D PA (Polyamide) Market Revenues & Volume, By Automotive, 2022 - 2032F |
6.1.5 Lithuania 3D PA (Polyamide) Market Revenues & Volume, By Electronics, 2022 - 2032F |
6.1.6 Lithuania 3D PA (Polyamide) Market Revenues & Volume, By Others, 2022 - 2032F |
6.2 Lithuania 3D PA (Polyamide) Market, By Type |
6.2.1 Overview and Analysis |
6.2.2 Lithuania 3D PA (Polyamide) Market Revenues & Volume, By PA11, 2022 - 2032F |
6.2.3 Lithuania 3D PA (Polyamide) Market Revenues & Volume, By PA12, 2022 - 2032F |
7 Lithuania 3D PA (Polyamide) Market Import-Export Trade Statistics |
7.1 Lithuania 3D PA (Polyamide) Market Export to Major Countries |
7.2 Lithuania 3D PA (Polyamide) Market Imports from Major Countries |
8 Lithuania 3D PA (Polyamide) Market Key Performance Indicators |
8.1 Average cost per unit of polyamide 3D printing material. |
8.2 Number of new entrants or players in the Lithuania 3D PA market. |
8.3 Rate of adoption of 3D printing technology in key industries in Lithuania. |
9 Lithuania 3D PA (Polyamide) Market - Opportunity Assessment |
9.1 Lithuania 3D PA (Polyamide) Market Opportunity Assessment, By Application, 2022 & 2032F |
9.2 Lithuania 3D PA (Polyamide) Market Opportunity Assessment, By Type, 2022 & 2032F |
10 Lithuania 3D PA (Polyamide) Market - Competitive Landscape |
10.1 Lithuania 3D PA (Polyamide) Market Revenue Share, By Companies, 2025 |
10.2 Lithuania 3D PA (Polyamide) Market Competitive Benchmarking, By Operating and Technical Parameters |
11 Company Profiles |
12 Recommendations | 13 Disclaimer |
Export potential assessment - trade Analytics for 2030
Export potential enables firms to identify high-growth global markets with greater confidence by combining advanced trade intelligence with a structured quantitative methodology. The framework analyzes emerging demand trends and country-level import patterns while integrating macroeconomic and trade datasets such as GDP and population forecasts, bilateral import–export flows, tariff structures, elasticity differentials between developed and developing economies, geographic distance, and import demand projections. Using weighted trade values from 2020–2024 as the base period to project country-to-country export potential for 2030, these inputs are operationalized through calculated drivers such as gravity model parameters, tariff impact factors, and projected GDP per-capita growth. Through an analysis of hidden potentials, demand hotspots, and market conditions that are most favorable to success, this method enables firms to focus on target countries, maximize returns, and global expansion with data, backed by accuracy.
By factoring in the projected importer demand gap that is currently unmet and could be potential opportunity, it identifies the potential for the Exporter (Country) among 190 countries, against the general trade analysis, which identifies the biggest importer or exporter.
To discover high-growth global markets and optimize your business strategy:
Click Here
Pricing
- Single User License$ 1,995
- Department License$ 2,400
- Site License$ 3,120
- Global License$ 3,795

Search
Thought Leadership and Analyst Meet


Our Clients
Latest Reports
- France Thermally Conductive Filler Dispersants Market (2026-2032) | Challenges, Restraints, Value, Share, Size, segmentation, Analysis, Trends, Investment Opportunities, Outlook, Pricing, Demand, Forecast, Revenue, Companies, Growth, Drivers, Strategy, Insights, Competition
- Egypt Thermally Conductive Filler Dispersants Market (2026-2032) | Competition, Forecast, Strategy, Value, Insights, Outlook, Investment Opportunities, Pricing, Demand, Share, segmentation, Drivers, Size, Companies, Restraints, Growth, Trends, Revenue, Challenges, Analysis
- Czech Republic Thermally Conductive Filler Dispersants Market (2026-2032) | Forecast, Pricing, Analysis, Drivers, Insights, Size, Demand, Growth, Challenges, segmentation, Competition, Outlook, Trends, Investment Opportunities, Companies, Strategy, Revenue, Share, Value, Restraints
- Colombia Thermally Conductive Filler Dispersants Market (2026-2032) | segmentation, Trends, Share, Drivers, Strategy, Companies, Demand, Insights, Size, Challenges, Value, Competition, Analysis, Growth, Revenue, Restraints, Forecast, Pricing, Outlook, Investment Opportunities
- China Thermally Conductive Filler Dispersants Market (2026-2032) | Restraints, Investment Opportunities, Pricing, Companies, Share, Size, Challenges, Trends, Outlook, Value, Analysis, Competition, Revenue, Drivers, Forecast, Demand, Insights, Growth, Strategy, segmentation
- Chile Thermally Conductive Filler Dispersants Market (2026-2032) | Investment Opportunities, Trends, Value, Restraints, Share, Companies, Forecast, segmentation, Pricing, Challenges, Demand, Size, Analysis, Drivers, Outlook, Growth, Competition, Strategy, Revenue, Insights
- Cambodia Thermally Conductive Filler Dispersants Market (2026-2032) | Analysis, Share, Outlook, Strategy, Pricing, Demand, Size, Growth, segmentation, Insights, Revenue, Forecast, Challenges, Competition, Companies, Investment Opportunities, Trends, Restraints, Value, Drivers
- Brazil Thermally Conductive Filler Dispersants Market (2026-2032) | Restraints, Forecast, Competition, Size, Revenue, Value, Investment Opportunities, Trends, Insights, Outlook, Growth, Analysis, Drivers, segmentation, Pricing, Challenges, Strategy, Share, Companies, Demand
- Bangladesh Thermally Conductive Filler Dispersants Market (2026-2032) | Restraints, Trends, Analysis, Competition, Insights, Forecast, Value, Investment Opportunities, Pricing, Share, Demand, Outlook, Revenue, segmentation, Companies, Drivers, Growth, Size, Challenges, Strategy
- Bahrain Thermally Conductive Filler Dispersants Market (2026-2032) | Trends, Outlook, Pricing, Demand, Value, Competition, Forecast, Growth, segmentation, Revenue, Companies, Analysis, Insights, Size, Drivers, Challenges, Strategy, Investment Opportunities, Share, Restraints
Industry Events and Analyst Meet

HIMTEX 2026

India Refining Summit 2026

India EV Show 2026

EV tech India Expo 2026

Auto Tech Asia 2026
Whitepaper
- Middle East & Africa Commercial Security Market Click here to view more.
- Middle East & Africa Fire Safety Systems & Equipment Market Click here to view more.
- GCC Drone Market Click here to view more.
- Middle East Lighting Fixture Market Click here to view more.
- GCC Physical & Perimeter Security Market Click here to view more.
6WResearch In News
- Doha a strategic location for EV manufacturing hub: IPA Qatar
- Demand for luxury TVs surging in the GCC, says Samsung
- Empowering Growth: The Thriving Journey of Bangladesh’s Cable Industry
- Demand for luxury TVs surging in the GCC, says Samsung
- Video call with a traditional healer? Once unthinkable, it’s now common in South Africa
- Intelligent Buildings To Smooth GCC’s Path To Net Zero