Lithuania Absolute Pressure Sensor Market (2026-2032) | Forecast, Drivers, Revenue, Investment Trends, Segments, Growth, Analysis, Share, Challenges, Industry, Outlook, Competition, Consumer Insights, Competitive, Size, Companies, Strategy, Opportunities, Demand, Pricing Analysis, Segmentation, Value, Restraints, Supply, Strategic Insights, Trends
Market Forecast By Sensor Technology (Piezoresistive, Capacitive, Optical, Resonant), By Application (Automotive, Medical Devices, Industrial Automation, Aerospace), By End User (OEMs & Tier-1 Suppliers, Hospitals/Medical Device Manufacturers, Process Control, Defense Contractors) And Competitive Landscape
| Product Code: ETC11702586 | Publication Date: Apr 2025 | Updated Date: Apr 2026 | Product Type: Market Research Report | |
| Publisher: 6Wresearch | Author: Sachin Kumar Rai | No. of Pages: 65 | No. of Figures: 34 | No. of Tables: 19 |
Lithuania Absolute Pressure Sensor Market Size (2020-2030)
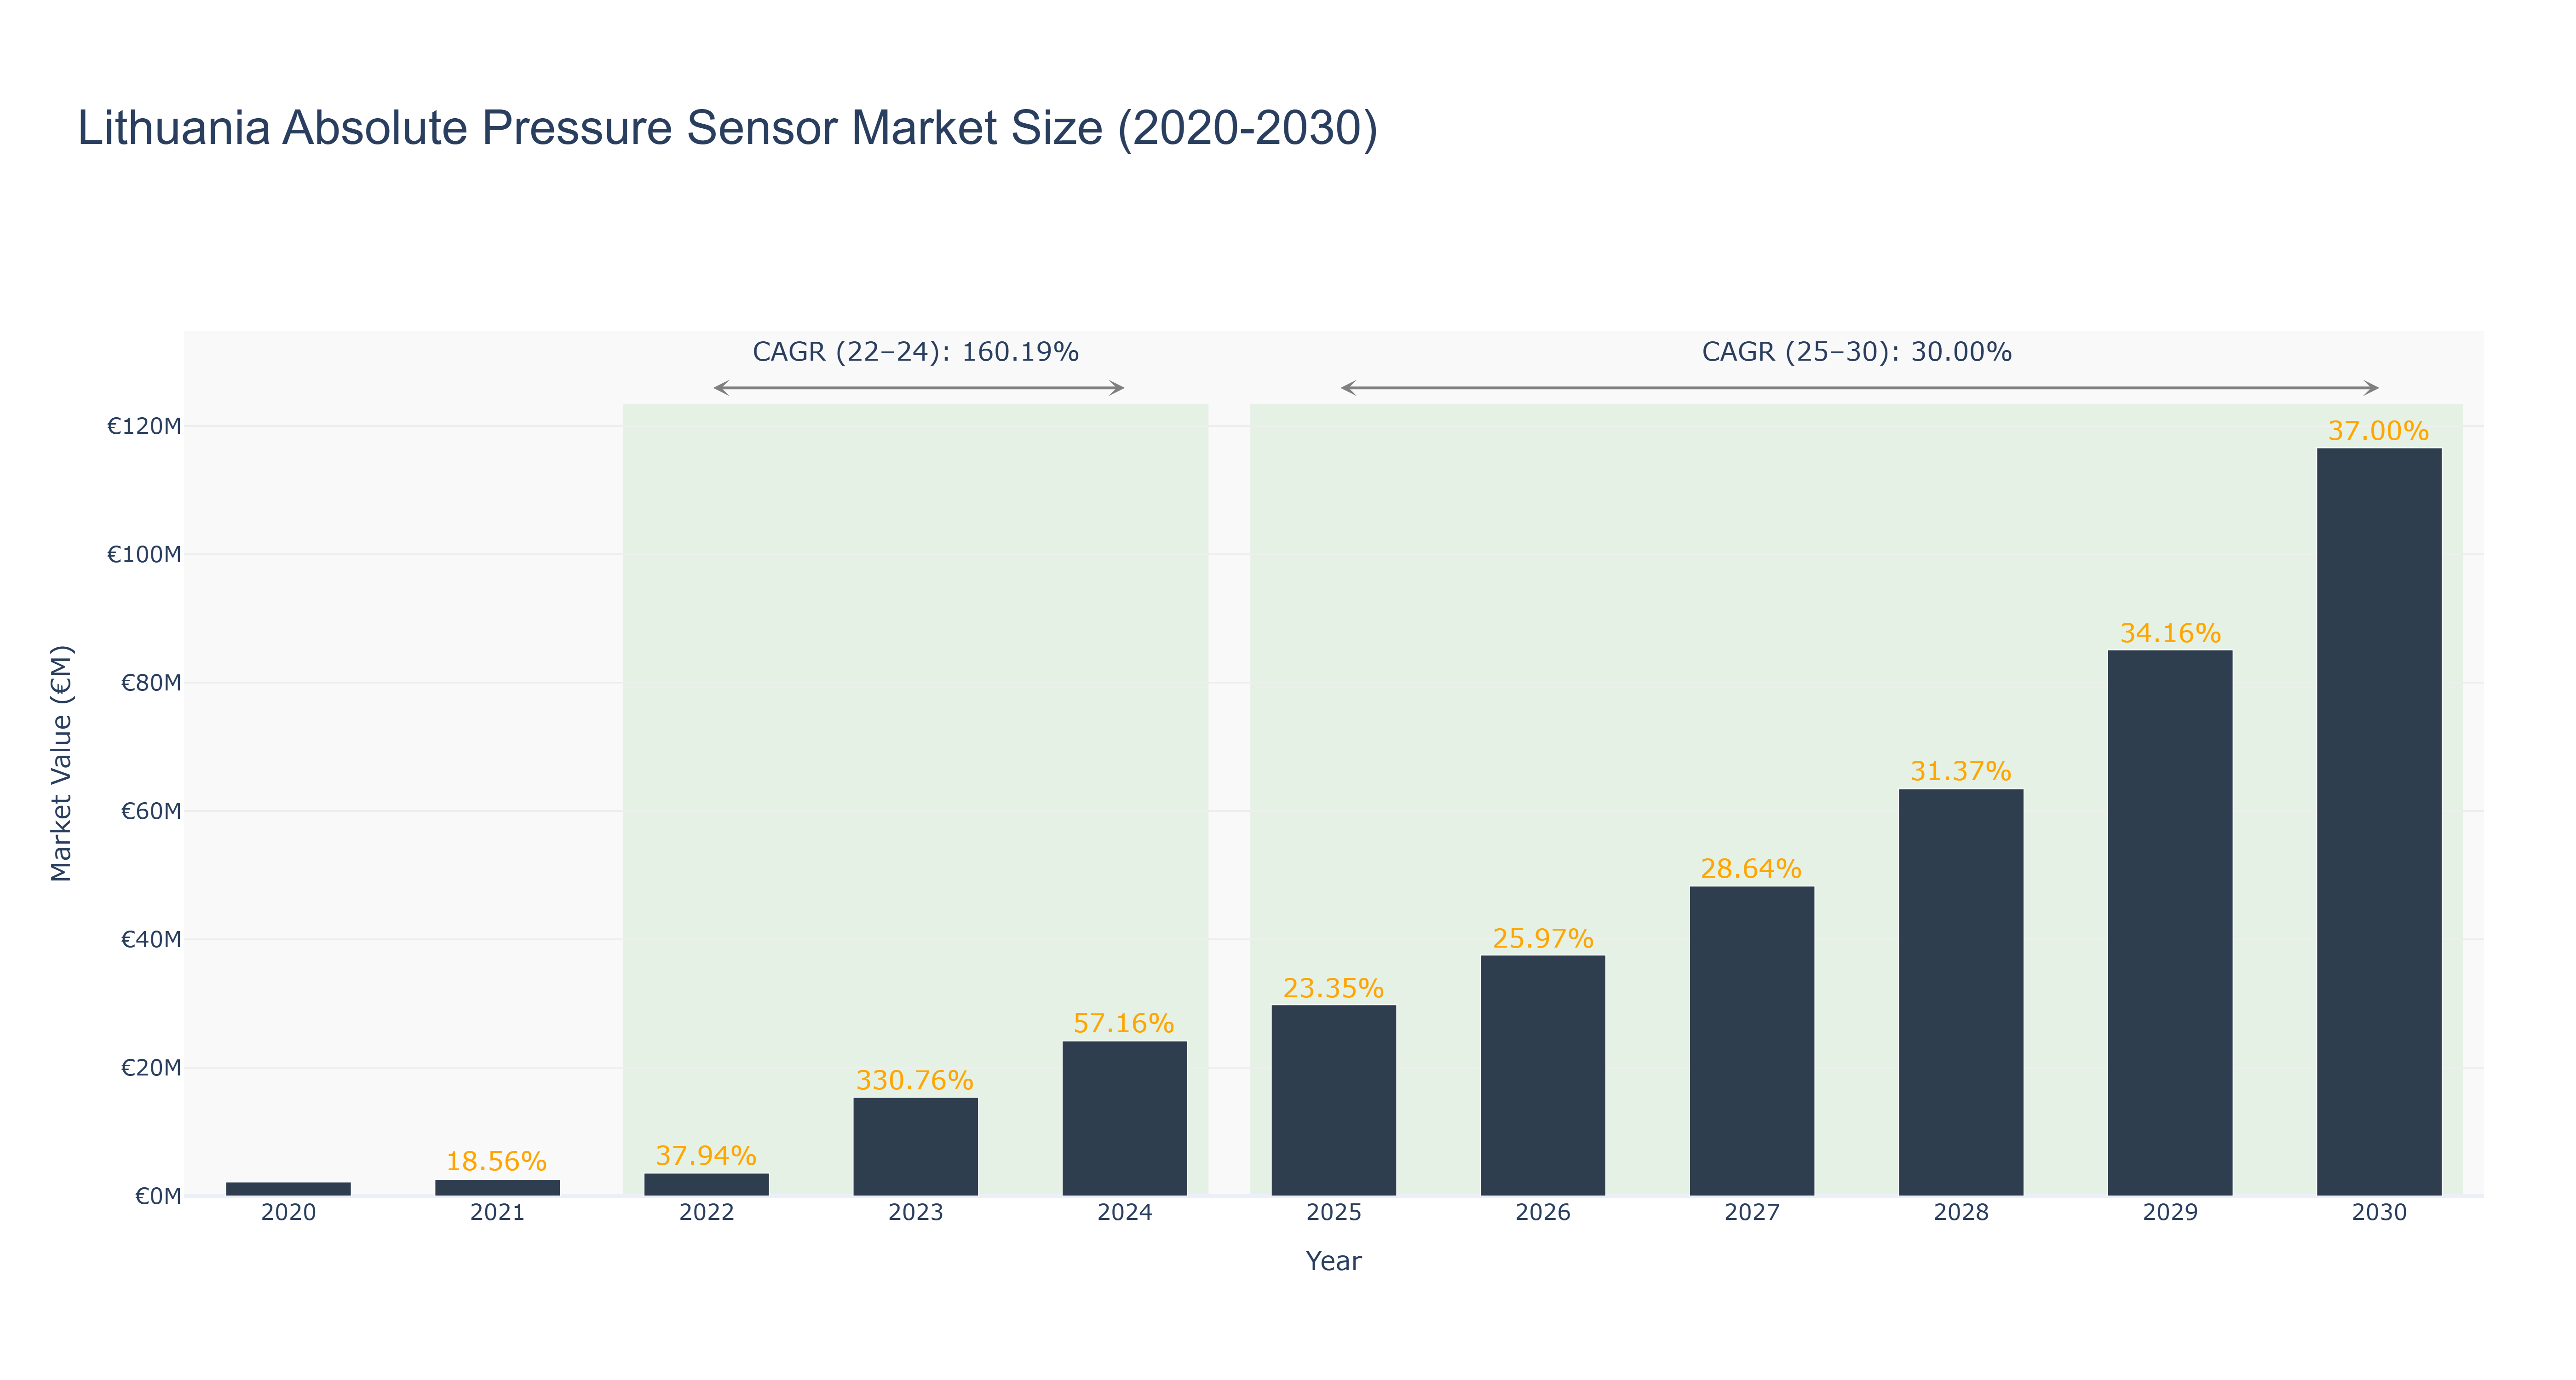
The Lithuania Absolute Pressure Sensor Market has experienced remarkable growth, with an actual market size increasing from €2.18 million in 2020 to €24.16 million in 2024, reflecting a compound annual growth rate (CAGR) of 160.19% from 2022 to 2024. The peak in market size occurred in 2023, reaching €15.37 million, driven by heightened demand across industrial automation, automotive, and healthcare sectors. Looking ahead, the forecasted period from 2025 to 2030 anticipates a continued upward trajectory, with projected market sizes growing to €116.60 million by 2030 at a CAGR of 30.00%. This growth will likely be supported by advancements in sensor technology, increased adoption of IoT solutions, and a rising focus on environmental monitoring. These macro drivers, coupled with ongoing investments in smart manufacturing, position the market for sustained expansion in the coming years.
Lithuania Absolute Pressure Sensor Market: Production & Trade Performance (2019-2025)
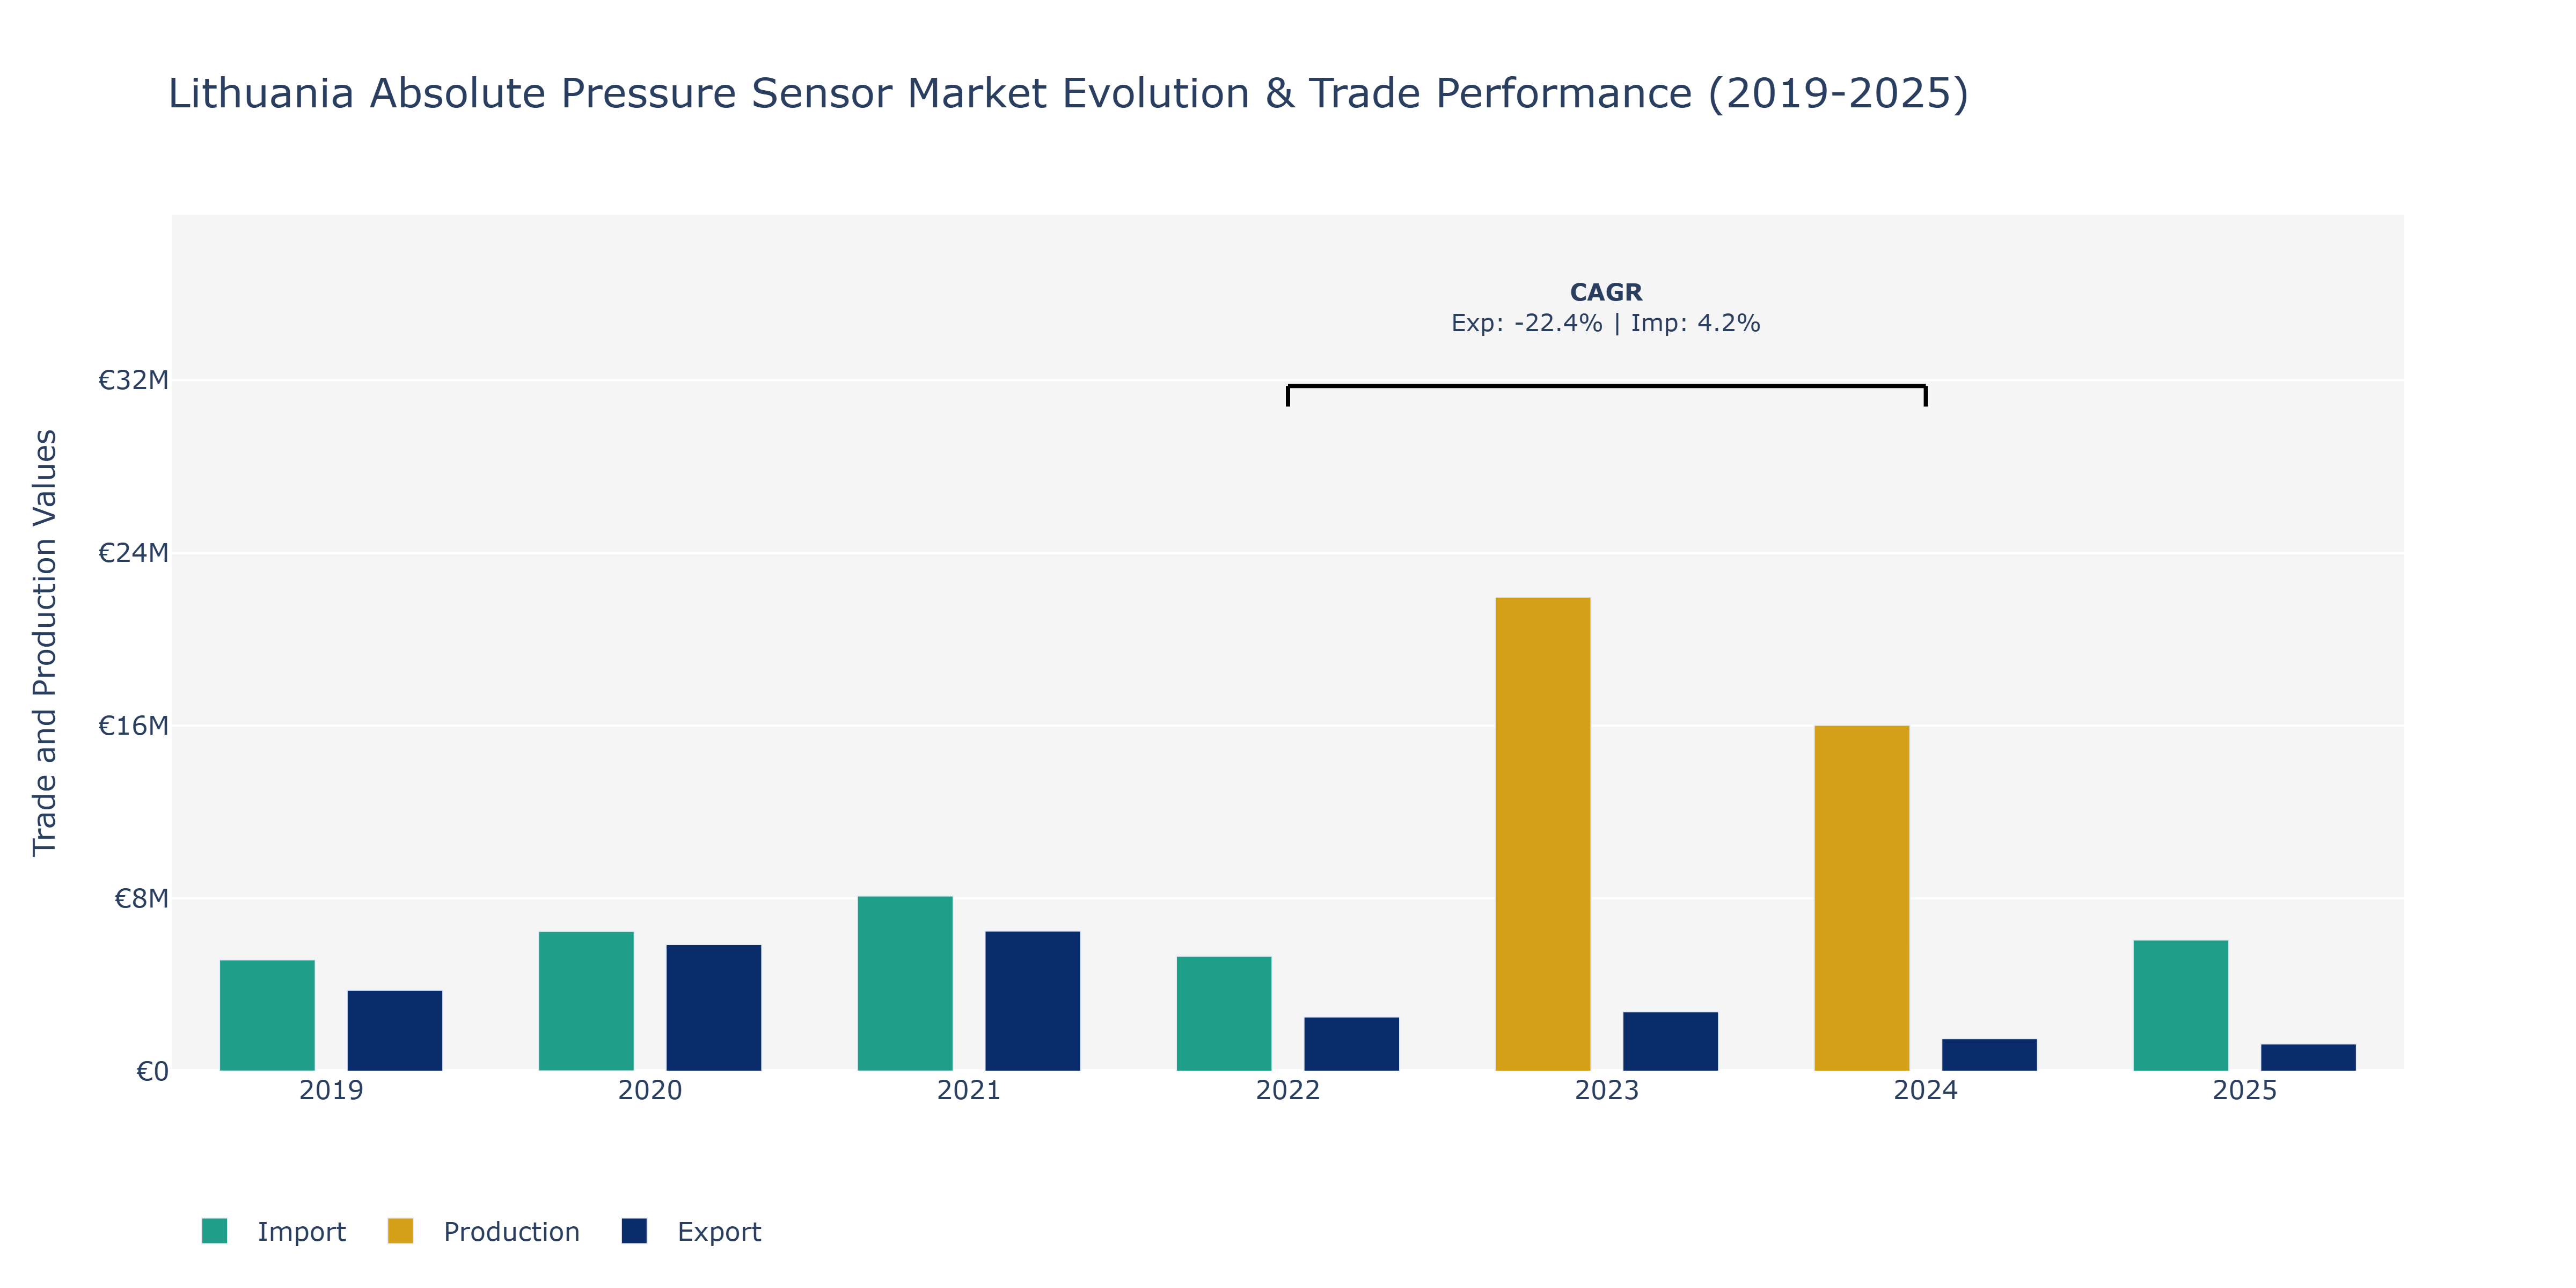
In the Lithuania Absolute Pressure Sensor Market, exports demonstrated a fluctuating trend over the years, starting at €3.75 million in 2019, increasing significantly to €5.87 million in 2020, and then sharply declining to €2.51 million in 2022 before slightly recovering to €2.75 million in 2023 and further dropping to approximately €1.26 million in 2024. This decline could be attributed to global economic uncertainties affecting demand for sensor technologies. Imports consistently rose from €5.16 million in 2019 to €8.12 million in 2021, possibly indicating increased demand for foreign pressure sensor products. Production, starting at €4.99 million in 2019, saw a substantial spike to €21.95 million in 2023 before stabilizing at €16.02 million in 2024, reflecting local manufacturing capacity expansions to meet growing market needs. The market's performance underscores the importance of adapting to global economic conditions and investing in domestic production capabilities to enhance market competitiveness.
Key Highlights of the Report:
- Lithuania Absolute Pressure Sensor Market Outlook
- Market Size of Lithuania Absolute Pressure Sensor Market, 2025
- Forecast of Lithuania Absolute Pressure Sensor Market, 2032
- Historical Data and Forecast of Lithuania Absolute Pressure Sensor Revenues & Volume for the Period 2022 - 2032F
- Lithuania Absolute Pressure Sensor Market Trend Evolution
- Lithuania Absolute Pressure Sensor Market Drivers and Challenges
- Lithuania Absolute Pressure Sensor Price Trends
- Lithuania Absolute Pressure Sensor Porter's Five Forces
- Lithuania Absolute Pressure Sensor Industry Life Cycle
- Historical Data and Forecast of Lithuania Absolute Pressure Sensor Market Revenues & Volume By Sensor Technology for the Period 2022 - 2032F
- Historical Data and Forecast of Lithuania Absolute Pressure Sensor Market Revenues & Volume By Piezoresistive for the Period 2022 - 2032F
- Historical Data and Forecast of Lithuania Absolute Pressure Sensor Market Revenues & Volume By Capacitive for the Period 2022 - 2032F
- Historical Data and Forecast of Lithuania Absolute Pressure Sensor Market Revenues & Volume By Optical for the Period 2022 - 2032F
- Historical Data and Forecast of Lithuania Absolute Pressure Sensor Market Revenues & Volume By Resonant for the Period 2022 - 2032F
- Historical Data and Forecast of Lithuania Absolute Pressure Sensor Market Revenues & Volume By Application for the Period 2022 - 2032F
- Historical Data and Forecast of Lithuania Absolute Pressure Sensor Market Revenues & Volume By Automotive for the Period 2022 - 2032F
- Historical Data and Forecast of Lithuania Absolute Pressure Sensor Market Revenues & Volume By Medical Devices for the Period 2022 - 2032F
- Historical Data and Forecast of Lithuania Absolute Pressure Sensor Market Revenues & Volume By Industrial Automation for the Period 2022 - 2032F
- Historical Data and Forecast of Lithuania Absolute Pressure Sensor Market Revenues & Volume By Aerospace for the Period 2022 - 2032F
- Historical Data and Forecast of Lithuania Absolute Pressure Sensor Market Revenues & Volume By End User for the Period 2022 - 2032F
- Historical Data and Forecast of Lithuania Absolute Pressure Sensor Market Revenues & Volume By OEMs & Tier-1 Suppliers for the Period 2022 - 2032F
- Historical Data and Forecast of Lithuania Absolute Pressure Sensor Market Revenues & Volume By Hospitals/Medical Device Manufacturers for the Period 2022 - 2032F
- Historical Data and Forecast of Lithuania Absolute Pressure Sensor Market Revenues & Volume By Process Control for the Period 2022 - 2032F
- Historical Data and Forecast of Lithuania Absolute Pressure Sensor Market Revenues & Volume By Defense Contractors for the Period 2022 - 2032F
- Lithuania Absolute Pressure Sensor Import Export Trade Statistics
- Market Opportunity Assessment By Sensor Technology
- Market Opportunity Assessment By Application
- Market Opportunity Assessment By End User
- Lithuania Absolute Pressure Sensor Top Companies Market Share
- Lithuania Absolute Pressure Sensor Competitive Benchmarking By Technical and Operational Parameters
- Lithuania Absolute Pressure Sensor Company Profiles
- Lithuania Absolute Pressure Sensor Key Strategic Recommendations
Frequently Asked Questions About the Market Study (FAQs):
6Wresearch actively monitors the Lithuania Absolute Pressure Sensor Market and publishes its comprehensive annual report, highlighting emerging trends, growth drivers, revenue analysis, and forecast outlook. Our insights help businesses to make data-backed strategic decisions with ongoing market dynamics. Our analysts track relevent industries related to the Lithuania Absolute Pressure Sensor Market, allowing our clients with actionable intelligence and reliable forecasts tailored to emerging regional needs.
Yes, we provide customisation as per your requirements. To learn more, feel free to contact us on sales@6wresearch.com
1 Executive Summary |
2 Introduction |
2.1 Key Highlights of the Report |
2.2 Report Description |
2.3 Market Scope & Segmentation |
2.4 Research Methodology |
2.5 Assumptions |
3 Lithuania Absolute Pressure Sensor Market Overview |
3.1 Lithuania Country Macro Economic Indicators |
3.2 Lithuania Absolute Pressure Sensor Market Revenues & Volume, 2022 & 2032F |
3.3 Lithuania Absolute Pressure Sensor Market - Industry Life Cycle |
3.4 Lithuania Absolute Pressure Sensor Market - Porter's Five Forces |
3.5 Lithuania Absolute Pressure Sensor Market Revenues & Volume Share, By Sensor Technology, 2022 & 2032F |
3.6 Lithuania Absolute Pressure Sensor Market Revenues & Volume Share, By Application, 2022 & 2032F |
3.7 Lithuania Absolute Pressure Sensor Market Revenues & Volume Share, By End User, 2022 & 2032F |
4 Lithuania Absolute Pressure Sensor Market Dynamics |
4.1 Impact Analysis |
4.2 Market Drivers |
4.3 Market Restraints |
5 Lithuania Absolute Pressure Sensor Market Trends |
6 Lithuania Absolute Pressure Sensor Market, By Types |
6.1 Lithuania Absolute Pressure Sensor Market, By Sensor Technology |
6.1.1 Overview and Analysis |
6.1.2 Lithuania Absolute Pressure Sensor Market Revenues & Volume, By Sensor Technology, 2022 - 2032F |
6.1.3 Lithuania Absolute Pressure Sensor Market Revenues & Volume, By Piezoresistive, 2022 - 2032F |
6.1.4 Lithuania Absolute Pressure Sensor Market Revenues & Volume, By Capacitive, 2022 - 2032F |
6.1.5 Lithuania Absolute Pressure Sensor Market Revenues & Volume, By Optical, 2022 - 2032F |
6.1.6 Lithuania Absolute Pressure Sensor Market Revenues & Volume, By Resonant, 2022 - 2032F |
6.2 Lithuania Absolute Pressure Sensor Market, By Application |
6.2.1 Overview and Analysis |
6.2.2 Lithuania Absolute Pressure Sensor Market Revenues & Volume, By Automotive, 2022 - 2032F |
6.2.3 Lithuania Absolute Pressure Sensor Market Revenues & Volume, By Medical Devices, 2022 - 2032F |
6.2.4 Lithuania Absolute Pressure Sensor Market Revenues & Volume, By Industrial Automation, 2022 - 2032F |
6.2.5 Lithuania Absolute Pressure Sensor Market Revenues & Volume, By Aerospace, 2022 - 2032F |
6.3 Lithuania Absolute Pressure Sensor Market, By End User |
6.3.1 Overview and Analysis |
6.3.2 Lithuania Absolute Pressure Sensor Market Revenues & Volume, By OEMs & Tier-1 Suppliers, 2022 - 2032F |
6.3.3 Lithuania Absolute Pressure Sensor Market Revenues & Volume, By Hospitals/Medical Device Manufacturers, 2022 - 2032F |
6.3.4 Lithuania Absolute Pressure Sensor Market Revenues & Volume, By Process Control, 2022 - 2032F |
6.3.5 Lithuania Absolute Pressure Sensor Market Revenues & Volume, By Defense Contractors, 2022 - 2032F |
7 Lithuania Absolute Pressure Sensor Market Import-Export Trade Statistics |
7.1 Lithuania Absolute Pressure Sensor Market Export to Major Countries |
7.2 Lithuania Absolute Pressure Sensor Market Imports from Major Countries |
8 Lithuania Absolute Pressure Sensor Market Key Performance Indicators |
9 Lithuania Absolute Pressure Sensor Market - Opportunity Assessment |
9.1 Lithuania Absolute Pressure Sensor Market Opportunity Assessment, By Sensor Technology, 2022 & 2032F |
9.2 Lithuania Absolute Pressure Sensor Market Opportunity Assessment, By Application, 2022 & 2032F |
9.3 Lithuania Absolute Pressure Sensor Market Opportunity Assessment, By End User, 2022 & 2032F |
10 Lithuania Absolute Pressure Sensor Market - Competitive Landscape |
10.1 Lithuania Absolute Pressure Sensor Market Revenue Share, By Companies, 2025 |
10.2 Lithuania Absolute Pressure Sensor Market Competitive Benchmarking, By Operating and Technical Parameters |
11 Company Profiles |
12 Recommendations |
13 Disclaimer |
Export potential assessment - trade Analytics for 2030
Export potential enables firms to identify high-growth global markets with greater confidence by combining advanced trade intelligence with a structured quantitative methodology. The framework analyzes emerging demand trends and country-level import patterns while integrating macroeconomic and trade datasets such as GDP and population forecasts, bilateral import–export flows, tariff structures, elasticity differentials between developed and developing economies, geographic distance, and import demand projections. Using weighted trade values from 2020–2024 as the base period to project country-to-country export potential for 2030, these inputs are operationalized through calculated drivers such as gravity model parameters, tariff impact factors, and projected GDP per-capita growth. Through an analysis of hidden potentials, demand hotspots, and market conditions that are most favorable to success, this method enables firms to focus on target countries, maximize returns, and global expansion with data, backed by accuracy.
By factoring in the projected importer demand gap that is currently unmet and could be potential opportunity, it identifies the potential for the Exporter (Country) among 190 countries, against the general trade analysis, which identifies the biggest importer or exporter.
To discover high-growth global markets and optimize your business strategy:
Click Here
Pricing
- Single User License$ 1,995
- Department License$ 2,400
- Site License$ 3,120
- Global License$ 3,795

Search
Thought Leadership and Analyst Meet


Our Clients
Latest Reports
- France Thermally Conductive Filler Dispersants Market (2026-2032) | Challenges, Restraints, Value, Share, Size, segmentation, Analysis, Trends, Investment Opportunities, Outlook, Pricing, Demand, Forecast, Revenue, Companies, Growth, Drivers, Strategy, Insights, Competition
- Egypt Thermally Conductive Filler Dispersants Market (2026-2032) | Competition, Forecast, Strategy, Value, Insights, Outlook, Investment Opportunities, Pricing, Demand, Share, segmentation, Drivers, Size, Companies, Restraints, Growth, Trends, Revenue, Challenges, Analysis
- Czech Republic Thermally Conductive Filler Dispersants Market (2026-2032) | Forecast, Pricing, Analysis, Drivers, Insights, Size, Demand, Growth, Challenges, segmentation, Competition, Outlook, Trends, Investment Opportunities, Companies, Strategy, Revenue, Share, Value, Restraints
- Colombia Thermally Conductive Filler Dispersants Market (2026-2032) | segmentation, Trends, Share, Drivers, Strategy, Companies, Demand, Insights, Size, Challenges, Value, Competition, Analysis, Growth, Revenue, Restraints, Forecast, Pricing, Outlook, Investment Opportunities
- China Thermally Conductive Filler Dispersants Market (2026-2032) | Restraints, Investment Opportunities, Pricing, Companies, Share, Size, Challenges, Trends, Outlook, Value, Analysis, Competition, Revenue, Drivers, Forecast, Demand, Insights, Growth, Strategy, segmentation
- Chile Thermally Conductive Filler Dispersants Market (2026-2032) | Investment Opportunities, Trends, Value, Restraints, Share, Companies, Forecast, segmentation, Pricing, Challenges, Demand, Size, Analysis, Drivers, Outlook, Growth, Competition, Strategy, Revenue, Insights
- Cambodia Thermally Conductive Filler Dispersants Market (2026-2032) | Analysis, Share, Outlook, Strategy, Pricing, Demand, Size, Growth, segmentation, Insights, Revenue, Forecast, Challenges, Competition, Companies, Investment Opportunities, Trends, Restraints, Value, Drivers
- Brazil Thermally Conductive Filler Dispersants Market (2026-2032) | Restraints, Forecast, Competition, Size, Revenue, Value, Investment Opportunities, Trends, Insights, Outlook, Growth, Analysis, Drivers, segmentation, Pricing, Challenges, Strategy, Share, Companies, Demand
- Bangladesh Thermally Conductive Filler Dispersants Market (2026-2032) | Restraints, Trends, Analysis, Competition, Insights, Forecast, Value, Investment Opportunities, Pricing, Share, Demand, Outlook, Revenue, segmentation, Companies, Drivers, Growth, Size, Challenges, Strategy
- Bahrain Thermally Conductive Filler Dispersants Market (2026-2032) | Trends, Outlook, Pricing, Demand, Value, Competition, Forecast, Growth, segmentation, Revenue, Companies, Analysis, Insights, Size, Drivers, Challenges, Strategy, Investment Opportunities, Share, Restraints
Industry Events and Analyst Meet

HIMTEX 2026

India Refining Summit 2026

India EV Show 2026

EV tech India Expo 2026

Auto Tech Asia 2026
Whitepaper
- Middle East & Africa Commercial Security Market Click here to view more.
- Middle East & Africa Fire Safety Systems & Equipment Market Click here to view more.
- GCC Drone Market Click here to view more.
- Middle East Lighting Fixture Market Click here to view more.
- GCC Physical & Perimeter Security Market Click here to view more.
6WResearch In News
- Doha a strategic location for EV manufacturing hub: IPA Qatar
- Demand for luxury TVs surging in the GCC, says Samsung
- Empowering Growth: The Thriving Journey of Bangladesh’s Cable Industry
- Demand for luxury TVs surging in the GCC, says Samsung
- Video call with a traditional healer? Once unthinkable, it’s now common in South Africa
- Intelligent Buildings To Smooth GCC’s Path To Net Zero