Lithuania Artificial Flowers Market (2025-2031) | Forecast, Growth, Segmentation, Analysis, Companies, Size, Share, Value, Trends, Outlook, Revenue & Industry
Market Forecast By Material Type (Clay & Porcelain, Cotton & Silk, Leather & Nylon, Paper & Wax, Plastic & Polyester), By Application (Commercial, Residential) And Competitive Landscape
| Product Code: ETC4982638 | Publication Date: Nov 2023 | Updated Date: Apr 2026 | Product Type: Market Research Report | |
| Publisher: 6Wresearch | Author: Shubham Padhi | No. of Pages: 60 | No. of Figures: 30 | No. of Tables: 5 |
Lithuania Artificial Flowers Market Size (2020-2030)
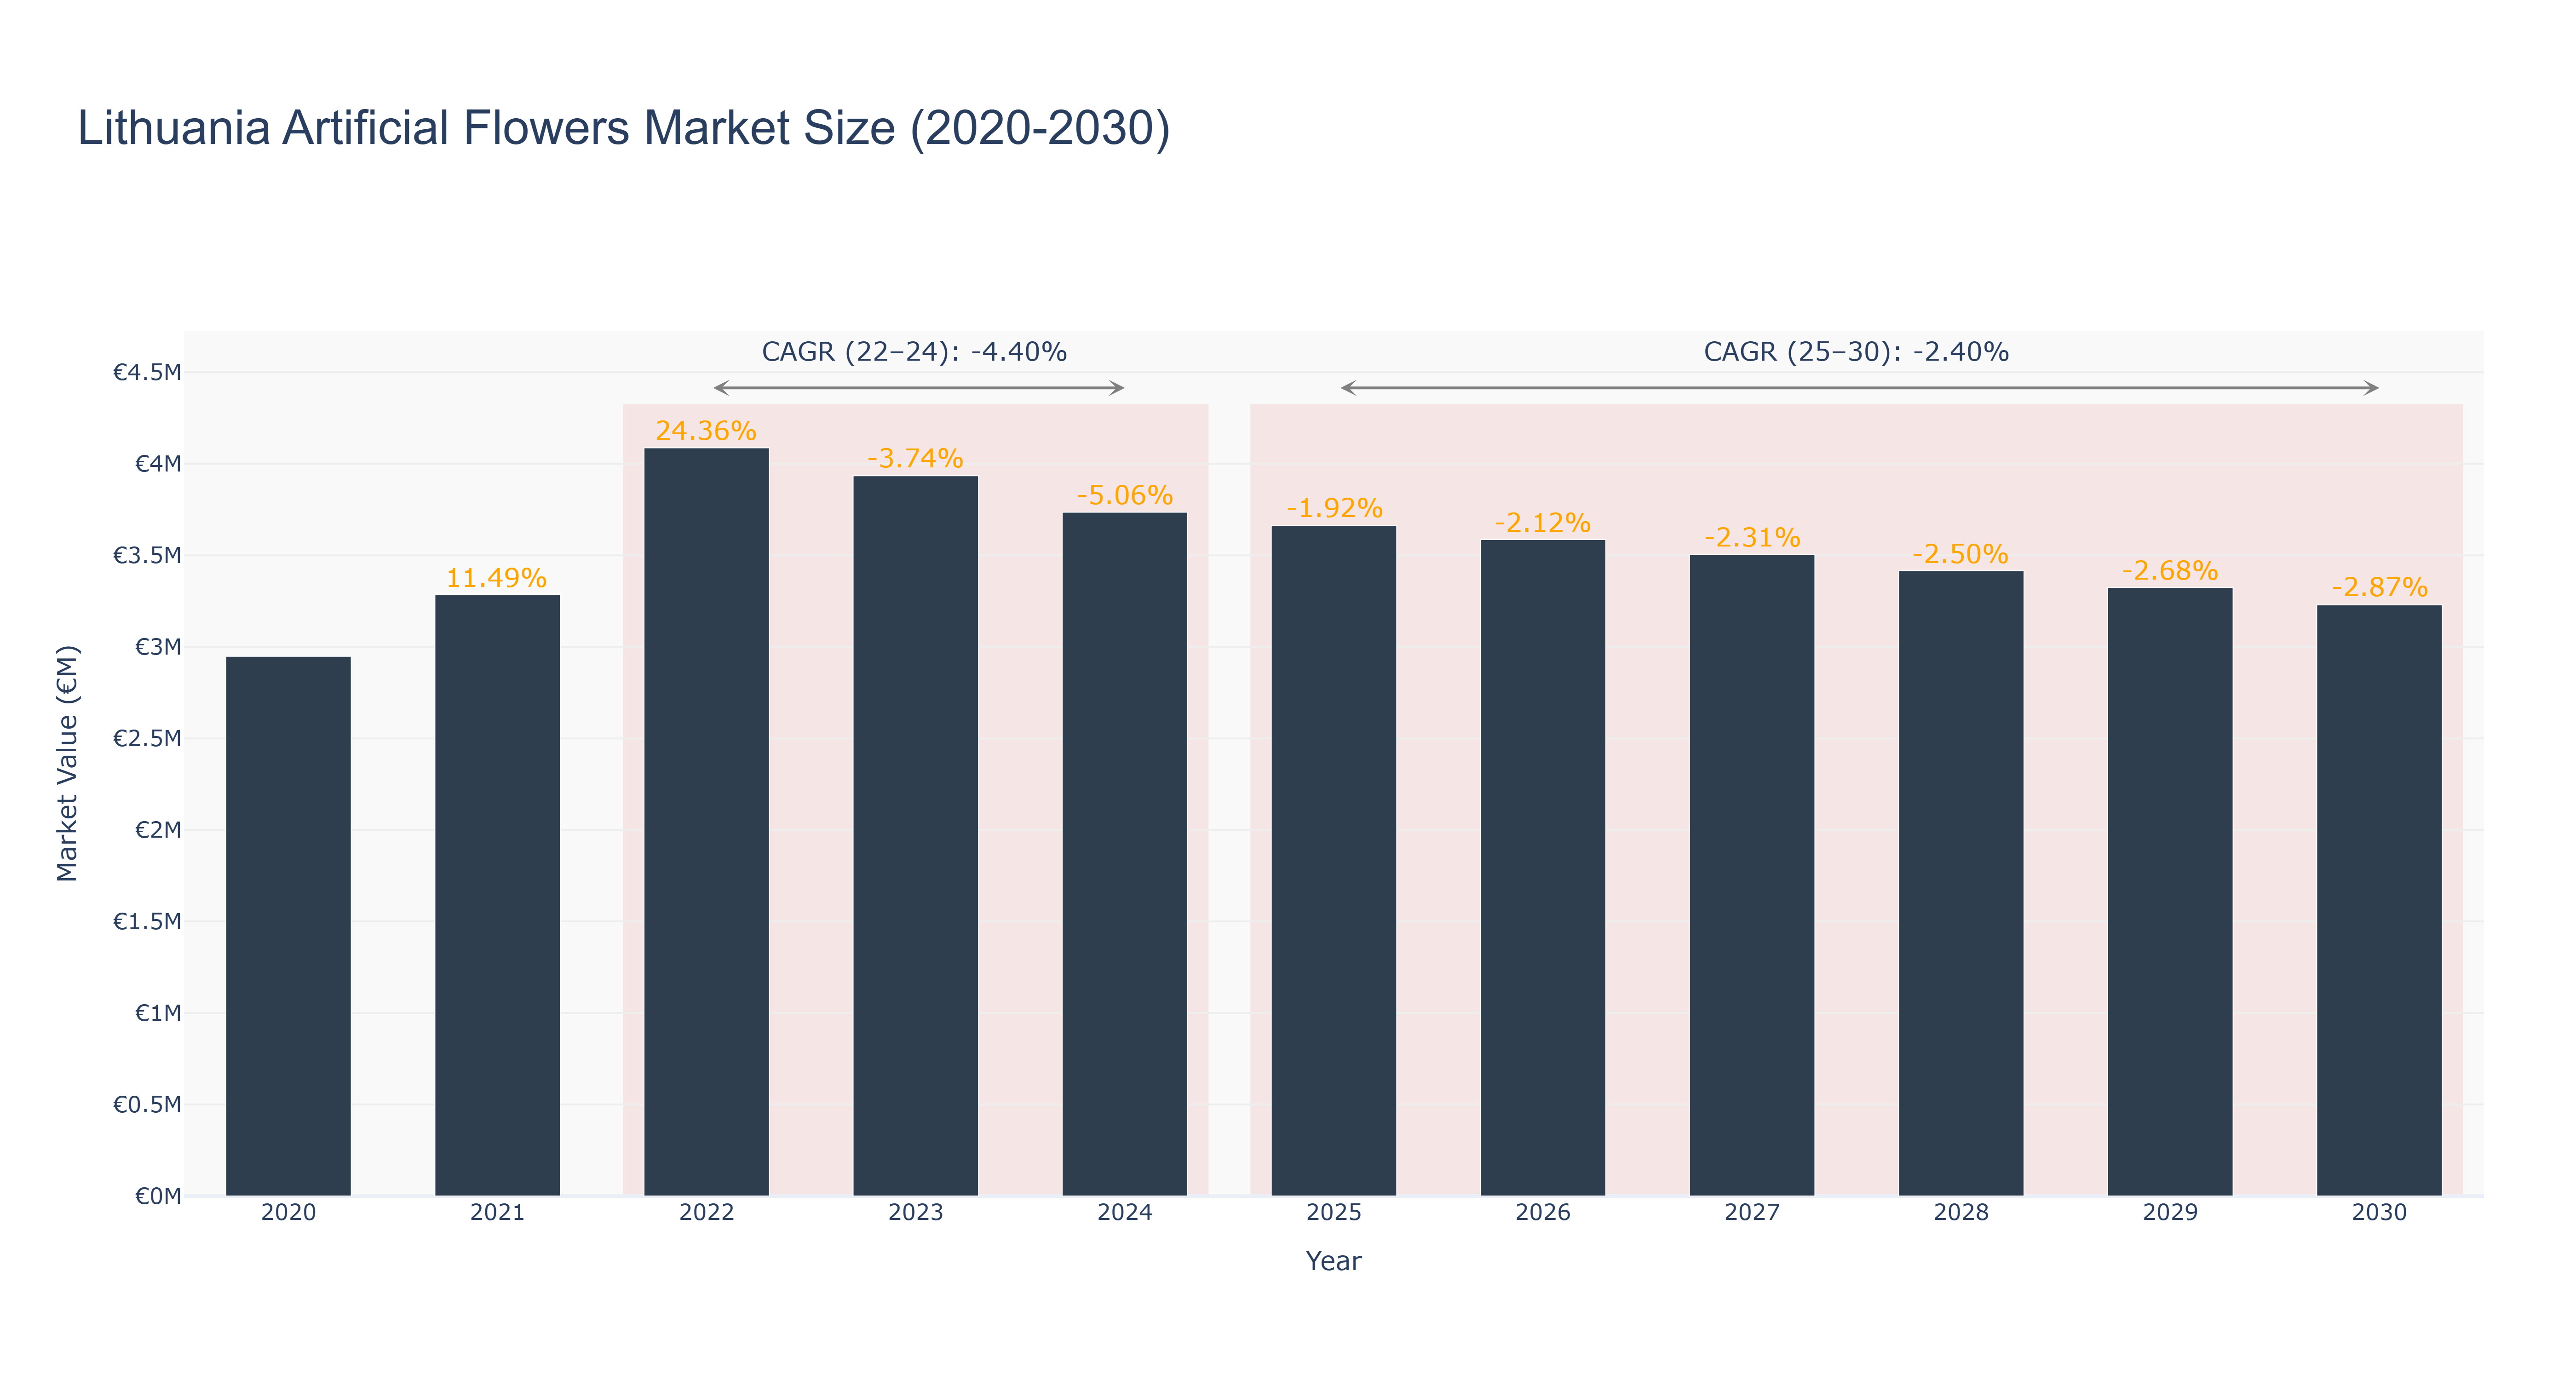
The Lithuania Artificial Flowers Market experienced a peak market size of €4.09 million in 2022. From 2020 to 2024, the market size decreased steadily from €2.95 million to €3.74 million. The forecasted market size from 2025 to 2030 is expected to continue this downward trend, reaching €3.23 million in 2030. The CAGR for the period 2022-24 was -4.40%, while for 2025-30, it is projected to be -2.40%. The decline in market size can be attributed to changing consumer preferences towards more sustainable and eco-friendly options, impacting the artificial flowers industry. Looking ahead, Lithuania is set to introduce government initiatives promoting local artisans and sustainable practices in the artificial flowers sector, aiming to revitalize market interest and drive growth in the coming years.
Lithuania Artificial Flowers Market: Production & Trade Performance (2019-2025)
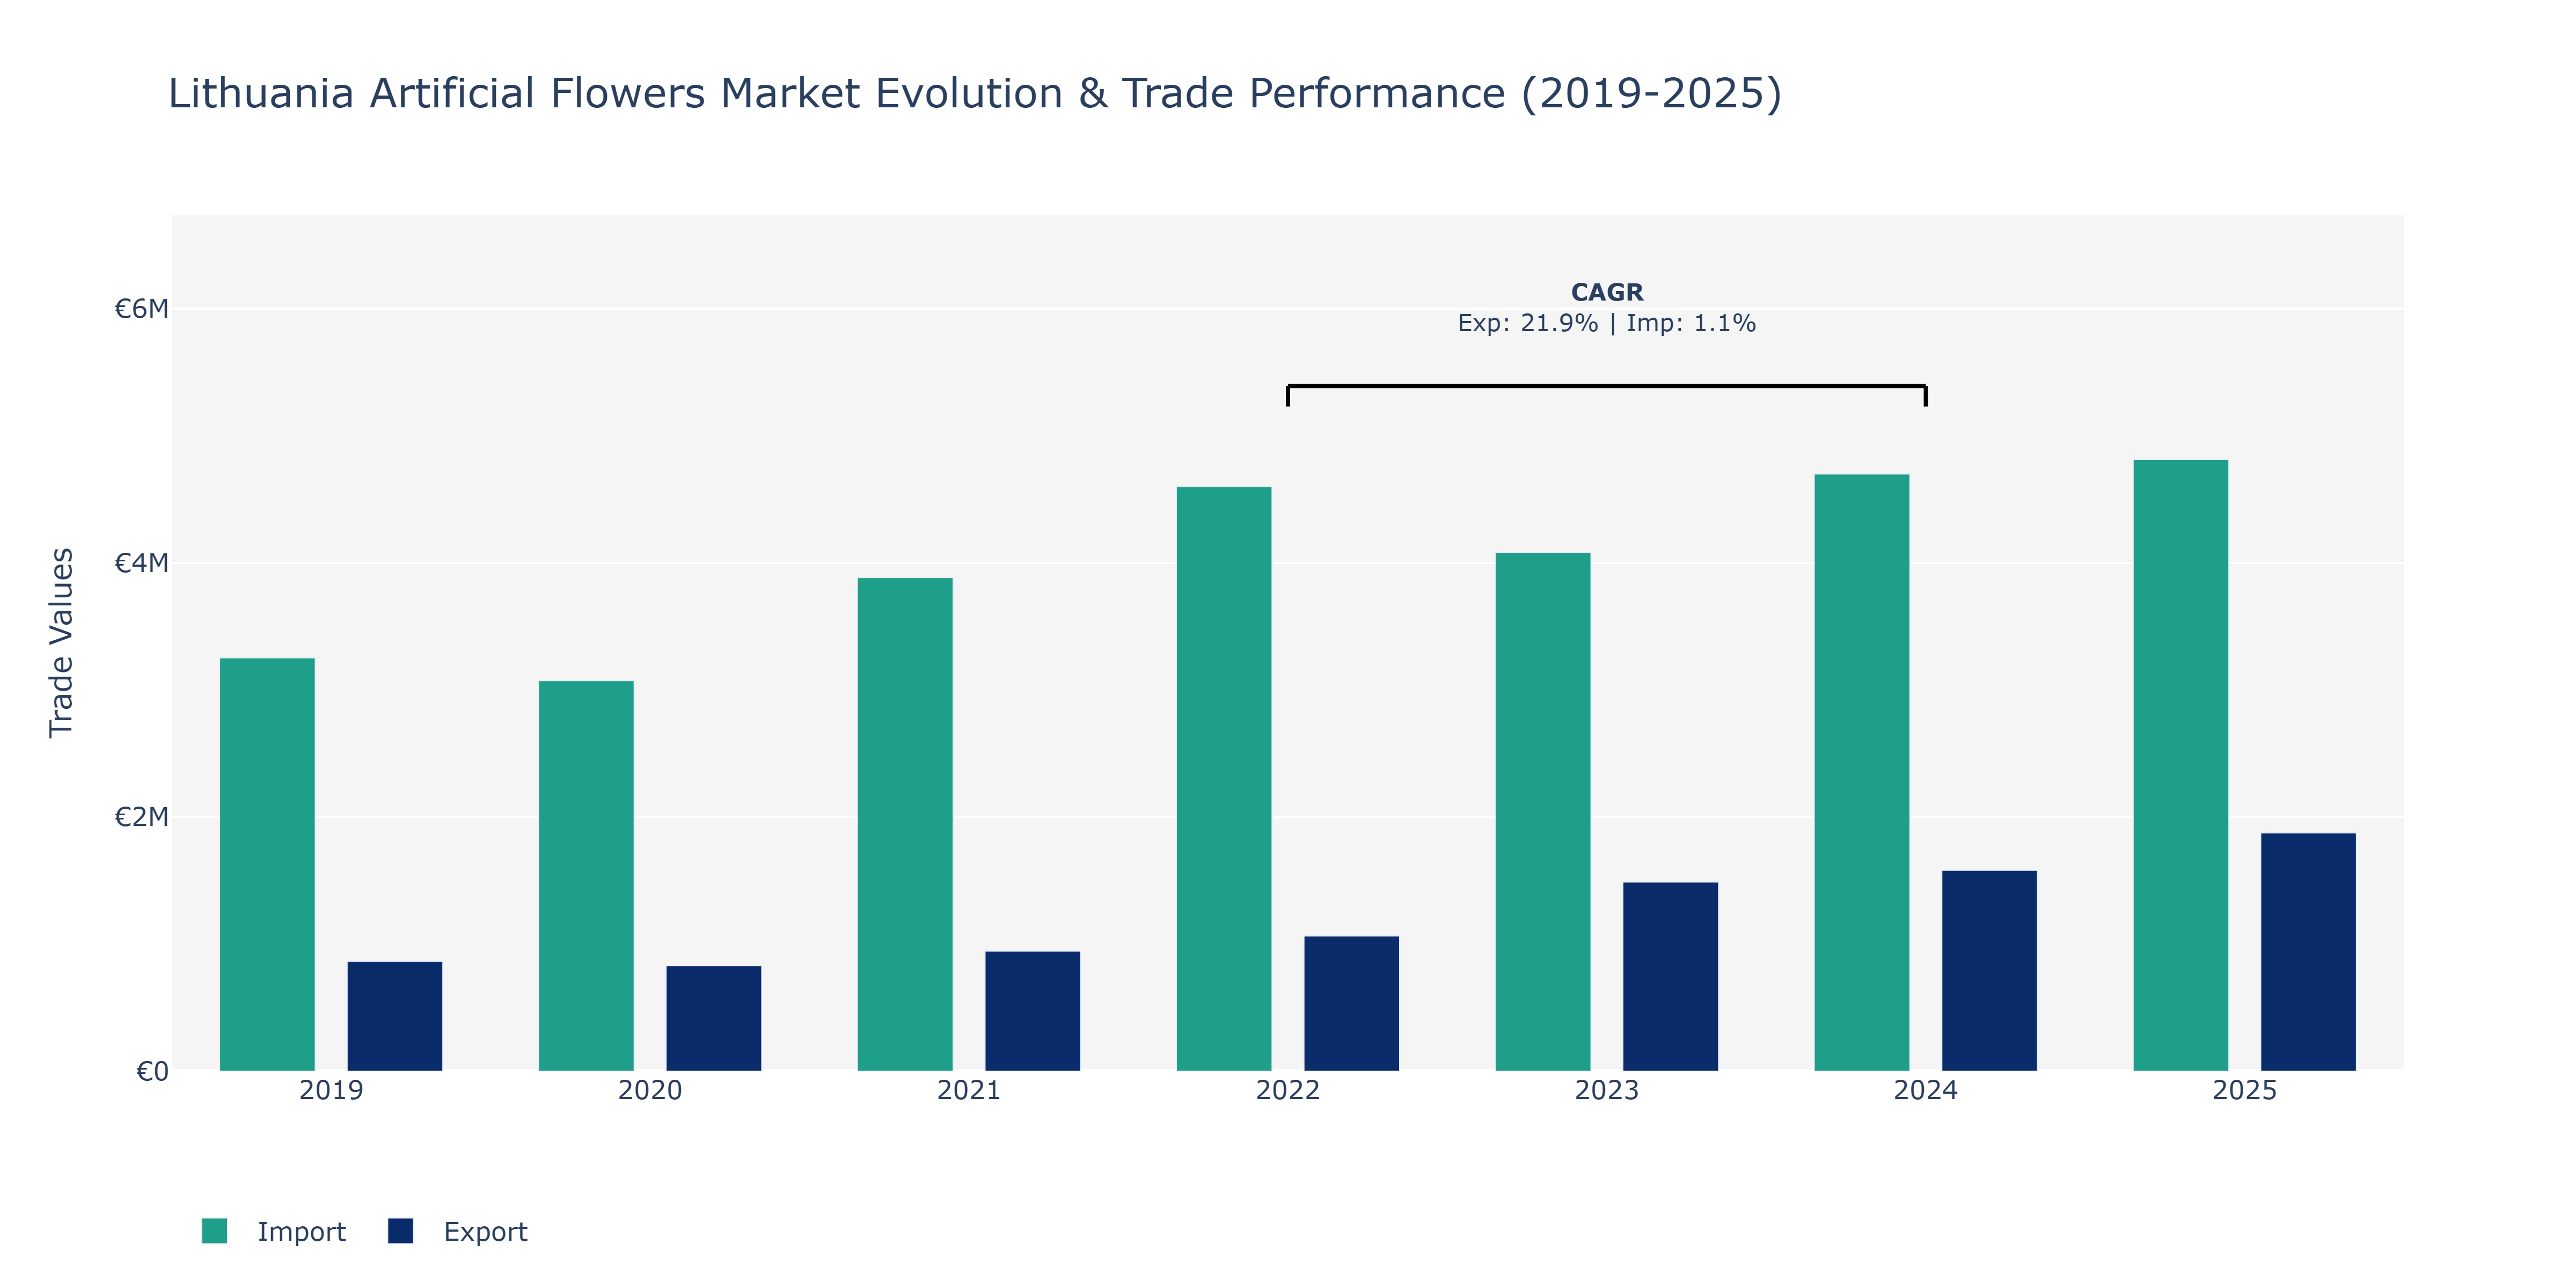
Between 2019 and 2025, the Lithuania Artificial Flowers Market saw varying trends in exports and imports. Exports experienced a steady increase from €864.58 thousand in 2019 to €1.88 million in 2025, indicating a consistent growth trajectory. On the other hand, imports fluctuated, reaching a peak of €4.7 million in 2024 after a slight decline in 2023. This surge in imports in 2024 could be attributed to increased demand for raw materials or finished artificial flower products not readily available domestically, leading to a higher reliance on imports. In contrast, the growth in exports may be due to improvements in product quality, expanded market reach, or favorable trade agreements, demonstrating Lithuania's competitiveness in the artificial flowers sector. These trends align with the global artificial flowers market growth, driven by changing consumer preferences, technological advancements, and expanding applications in the home decor and gifting industries.
Key Highlights of the Report:
- Lithuania Artificial Flowers Market Outlook
- Market Size of Lithuania Artificial Flowers Market, 2024
- Forecast of Lithuania Artificial Flowers Market, 2031
- Historical Data and Forecast of Lithuania Artificial Flowers Revenues & Volume for the Period 2021-2031
- Lithuania Artificial Flowers Market Trend Evolution
- Lithuania Artificial Flowers Market Drivers and Challenges
- Lithuania Artificial Flowers Price Trends
- Lithuania Artificial Flowers Porter`s Five Forces
- Lithuania Artificial Flowers Industry Life Cycle
- Historical Data and Forecast of Lithuania Artificial Flowers Market Revenues & Volume By Material Type for the Period 2021-2031
- Historical Data and Forecast of Lithuania Artificial Flowers Market Revenues & Volume By Clay & Porcelain for the Period 2021-2031
- Historical Data and Forecast of Lithuania Artificial Flowers Market Revenues & Volume By Cotton & Silk for the Period 2021-2031
- Historical Data and Forecast of Lithuania Artificial Flowers Market Revenues & Volume By Leather & Nylon for the Period 2021-2031
- Historical Data and Forecast of Lithuania Artificial Flowers Market Revenues & Volume By Paper & Wax for the Period 2021-2031
- Historical Data and Forecast of Lithuania Artificial Flowers Market Revenues & Volume By Plastic & Polyester for the Period 2021-2031
- Historical Data and Forecast of Lithuania Artificial Flowers Market Revenues & Volume By Application for the Period 2021-2031
- Historical Data and Forecast of Lithuania Artificial Flowers Market Revenues & Volume By Commercial for the Period 2021-2031
- Historical Data and Forecast of Lithuania Artificial Flowers Market Revenues & Volume By Residential for the Period 2021-2031
- Lithuania Artificial Flowers Import Export Trade Statistics
- Market Opportunity Assessment By Material Type
- Market Opportunity Assessment By Application
- Lithuania Artificial Flowers Top Companies Market Share
- Lithuania Artificial Flowers Competitive Benchmarking By Technical and Operational Parameters
- Lithuania Artificial Flowers Company Profiles
- Lithuania Artificial Flowers Key Strategic Recommendations
Frequently Asked Questions About the Market Study (FAQs):
6Wresearch actively monitors the Lithuania Artificial Flowers Market and publishes its comprehensive annual report, highlighting emerging trends, growth drivers, revenue analysis, and forecast outlook. Our insights help businesses to make data-backed strategic decisions with ongoing market dynamics. Our analysts track relevent industries related to the Lithuania Artificial Flowers Market, allowing our clients with actionable intelligence and reliable forecasts tailored to emerging regional needs.
Yes, we provide customisation as per your requirements. To learn more, feel free to contact us on sales@6wresearch.com
1 Executive Summary |
2 Introduction |
2.1 Key Highlights of the Report |
2.2 Report Description |
2.3 Market Scope & Segmentation |
2.4 Research Methodology |
2.5 Assumptions |
3 Lithuania Artificial Flowers Market Overview |
3.1 Lithuania Country Macro Economic Indicators |
3.2 Lithuania Artificial Flowers Market Revenues & Volume, 2021 & 2031F |
3.3 Lithuania Artificial Flowers Market - Industry Life Cycle |
3.4 Lithuania Artificial Flowers Market - Porter's Five Forces |
3.5 Lithuania Artificial Flowers Market Revenues & Volume Share, By Material Type, 2021 & 2031F |
3.6 Lithuania Artificial Flowers Market Revenues & Volume Share, By Application, 2021 & 2031F |
4 Lithuania Artificial Flowers Market Dynamics |
4.1 Impact Analysis |
4.2 Market Drivers |
4.2.1 Increasing popularity of artificial flowers as a sustainable and long-lasting alternative to real flowers. |
4.2.2 Growing demand for artificial flowers in home decor and event decoration. |
4.2.3 Technological advancements leading to higher quality and more realistic artificial flower products. |
4.3 Market Restraints |
4.3.1 Perception of artificial flowers as less authentic and natural compared to real flowers. |
4.3.2 Competition from fresh flower market and preference for real flowers in certain cultural and traditional events. |
5 Lithuania Artificial Flowers Market Trends |
6 Lithuania Artificial Flowers Market Segmentations |
6.1 Lithuania Artificial Flowers Market, By Material Type |
6.1.1 Overview and Analysis |
6.1.2 Lithuania Artificial Flowers Market Revenues & Volume, By Clay & Porcelain, 2021-2031F |
6.1.3 Lithuania Artificial Flowers Market Revenues & Volume, By Cotton & Silk, 2021-2031F |
6.1.4 Lithuania Artificial Flowers Market Revenues & Volume, By Leather & Nylon, 2021-2031F |
6.1.5 Lithuania Artificial Flowers Market Revenues & Volume, By Paper & Wax, 2021-2031F |
6.1.6 Lithuania Artificial Flowers Market Revenues & Volume, By Plastic & Polyester, 2021-2031F |
6.2 Lithuania Artificial Flowers Market, By Application |
6.2.1 Overview and Analysis |
6.2.2 Lithuania Artificial Flowers Market Revenues & Volume, By Commercial, 2021-2031F |
6.2.3 Lithuania Artificial Flowers Market Revenues & Volume, By Residential, 2021-2031F |
7 Lithuania Artificial Flowers Market Import-Export Trade Statistics |
7.1 Lithuania Artificial Flowers Market Export to Major Countries |
7.2 Lithuania Artificial Flowers Market Imports from Major Countries |
8 Lithuania Artificial Flowers Market Key Performance Indicators |
8.1 Customer satisfaction and repeat purchase rate for artificial flowers. |
8.2 Adoption rate of artificial flowers in different segments like home decor, weddings, and corporate events. |
8.3 Innovation rate in artificial flower designs and materials. |
8.4 Sustainability practices and eco-friendly initiatives in artificial flower production. |
8.5 Market penetration and growth in new customer segments or geographic regions. |
9 Lithuania Artificial Flowers Market - Opportunity Assessment |
9.1 Lithuania Artificial Flowers Market Opportunity Assessment, By Material Type, 2021 & 2031F |
9.2 Lithuania Artificial Flowers Market Opportunity Assessment, By Application, 2021 & 2031F |
10 Lithuania Artificial Flowers Market - Competitive Landscape |
10.1 Lithuania Artificial Flowers Market Revenue Share, By Companies, 2024 |
10.2 Lithuania Artificial Flowers Market Competitive Benchmarking, By Operating and Technical Parameters |
11 Company Profiles |
12 Recommendations | 13 Disclaimer |
Global Go To Market Strategy - 2030
Export potential enables firms to identify high-growth global markets with greater confidence by combining advanced trade intelligence with a structured quantitative methodology. The framework analyzes emerging demand trends and country-level import patterns while integrating macroeconomic and trade datasets such as GDP and population forecasts, bilateral import–export flows, tariff structures, elasticity differentials between developed and developing economies, geographic distance, and import demand projections. Using weighted trade values from 2020–2024 as the base period to project country-to-country export potential for 2030, these inputs are operationalized through calculated drivers such as gravity model parameters, tariff impact factors, and projected GDP per-capita growth. Through an analysis of hidden potentials, demand hotspots, and market conditions that are most favorable to success, this method enables firms to focus on target countries, maximize returns, and global expansion with data, backed by accuracy.
By factoring in the projected importer demand gap that is currently unmet and could be potential opportunity, it identifies the potential for the Exporter (Country) among 190 countries, against the general trade analysis, which identifies the biggest importer or exporter.
To discover high-growth global markets and optimize your business strategy:
Click Here
Pricing
- Single User License$ 1,995
- Department License$ 2,400
- Site License$ 3,120
- Global License$ 3,795

Leadership Perspectives from Industry Events
Search
Thought Leadership and Analyst Meet


Our Clients
6WResearch In News
- Doha a strategic location for EV manufacturing hub: IPA Qatar
- Demand for luxury TVs surging in the GCC, says Samsung
- Empowering Growth: The Thriving Journey of Bangladesh’s Cable Industry
- Demand for luxury TVs surging in the GCC, says Samsung
- Video call with a traditional healer? Once unthinkable, it’s now common in South Africa
- Intelligent Buildings To Smooth GCC’s Path To Net Zero
Latest Reports
- Taiwan Airport Wireless Infrastructure Market (2026-2032)
- Vietnam Airport Wireless Infrastructure Market (2026-2032)
- Thailand Airport Wireless Infrastructure Market (2026-2032)
- South Korea Airport Wireless Infrastructure Market (2026-2032)
- Romania Airport Wireless Infrastructure Market (2026-2032)
- Qatar Airport Wireless Infrastructure Market (2026-2032)
- Philippines Airport Wireless Infrastructure Market (2026-2032)
- Japan Airport Wireless Infrastructure Market (2026-2032)
- Taiwan Airport Winter Services Market (2026-2032)
- Vietnam Airport Winter Services Market (2026-2032)
Industry Events and Analyst Meet

HIMTEX 2026

India Refining Summit 2026

India EV Show 2026

EV tech India Expo 2026

Auto Tech Asia 2026
Whitepaper
- Middle East & Africa Commercial Security Market Click here to view more.
- Middle East & Africa Fire Safety Systems & Equipment Market Click here to view more.
- GCC Drone Market Click here to view more.
- Middle East Lighting Fixture Market Click here to view more.
- GCC Physical & Perimeter Security Market Click here to view more.