Lithuania Automotive Active Purge Pump Market (2026-2032) | Forecast, Competitive Landscape, Analysis, Industry, Size & Revenue, Value, Companies, Trends, Growth, Share, Segmentation, Outlook
Market Forecast By Components (Sensors, DC Motor, Valves, Actuators), By Material (Non Metal, Metal), By Manufacturing Process (Vacuum Forming, Cutting, Injection Molding), By Vehicle Type (Commercial Vehicle, Passenger Vehicle), By Sales Channel (Aftermarket, Original Equipment Manufacturers (OEMs)) And Competitive Landscape
| Product Code: ETC8034843 | Publication Date: Sep 2024 | Updated Date: Apr 2026 | Product Type: Market Research Report | |
| Publisher: 6Wresearch | Author: Sumit Sagar | No. of Pages: 75 | No. of Figures: 35 | No. of Tables: 20 |
Lithuania Automotive Active Purge Pump Market Size (2020-2030)
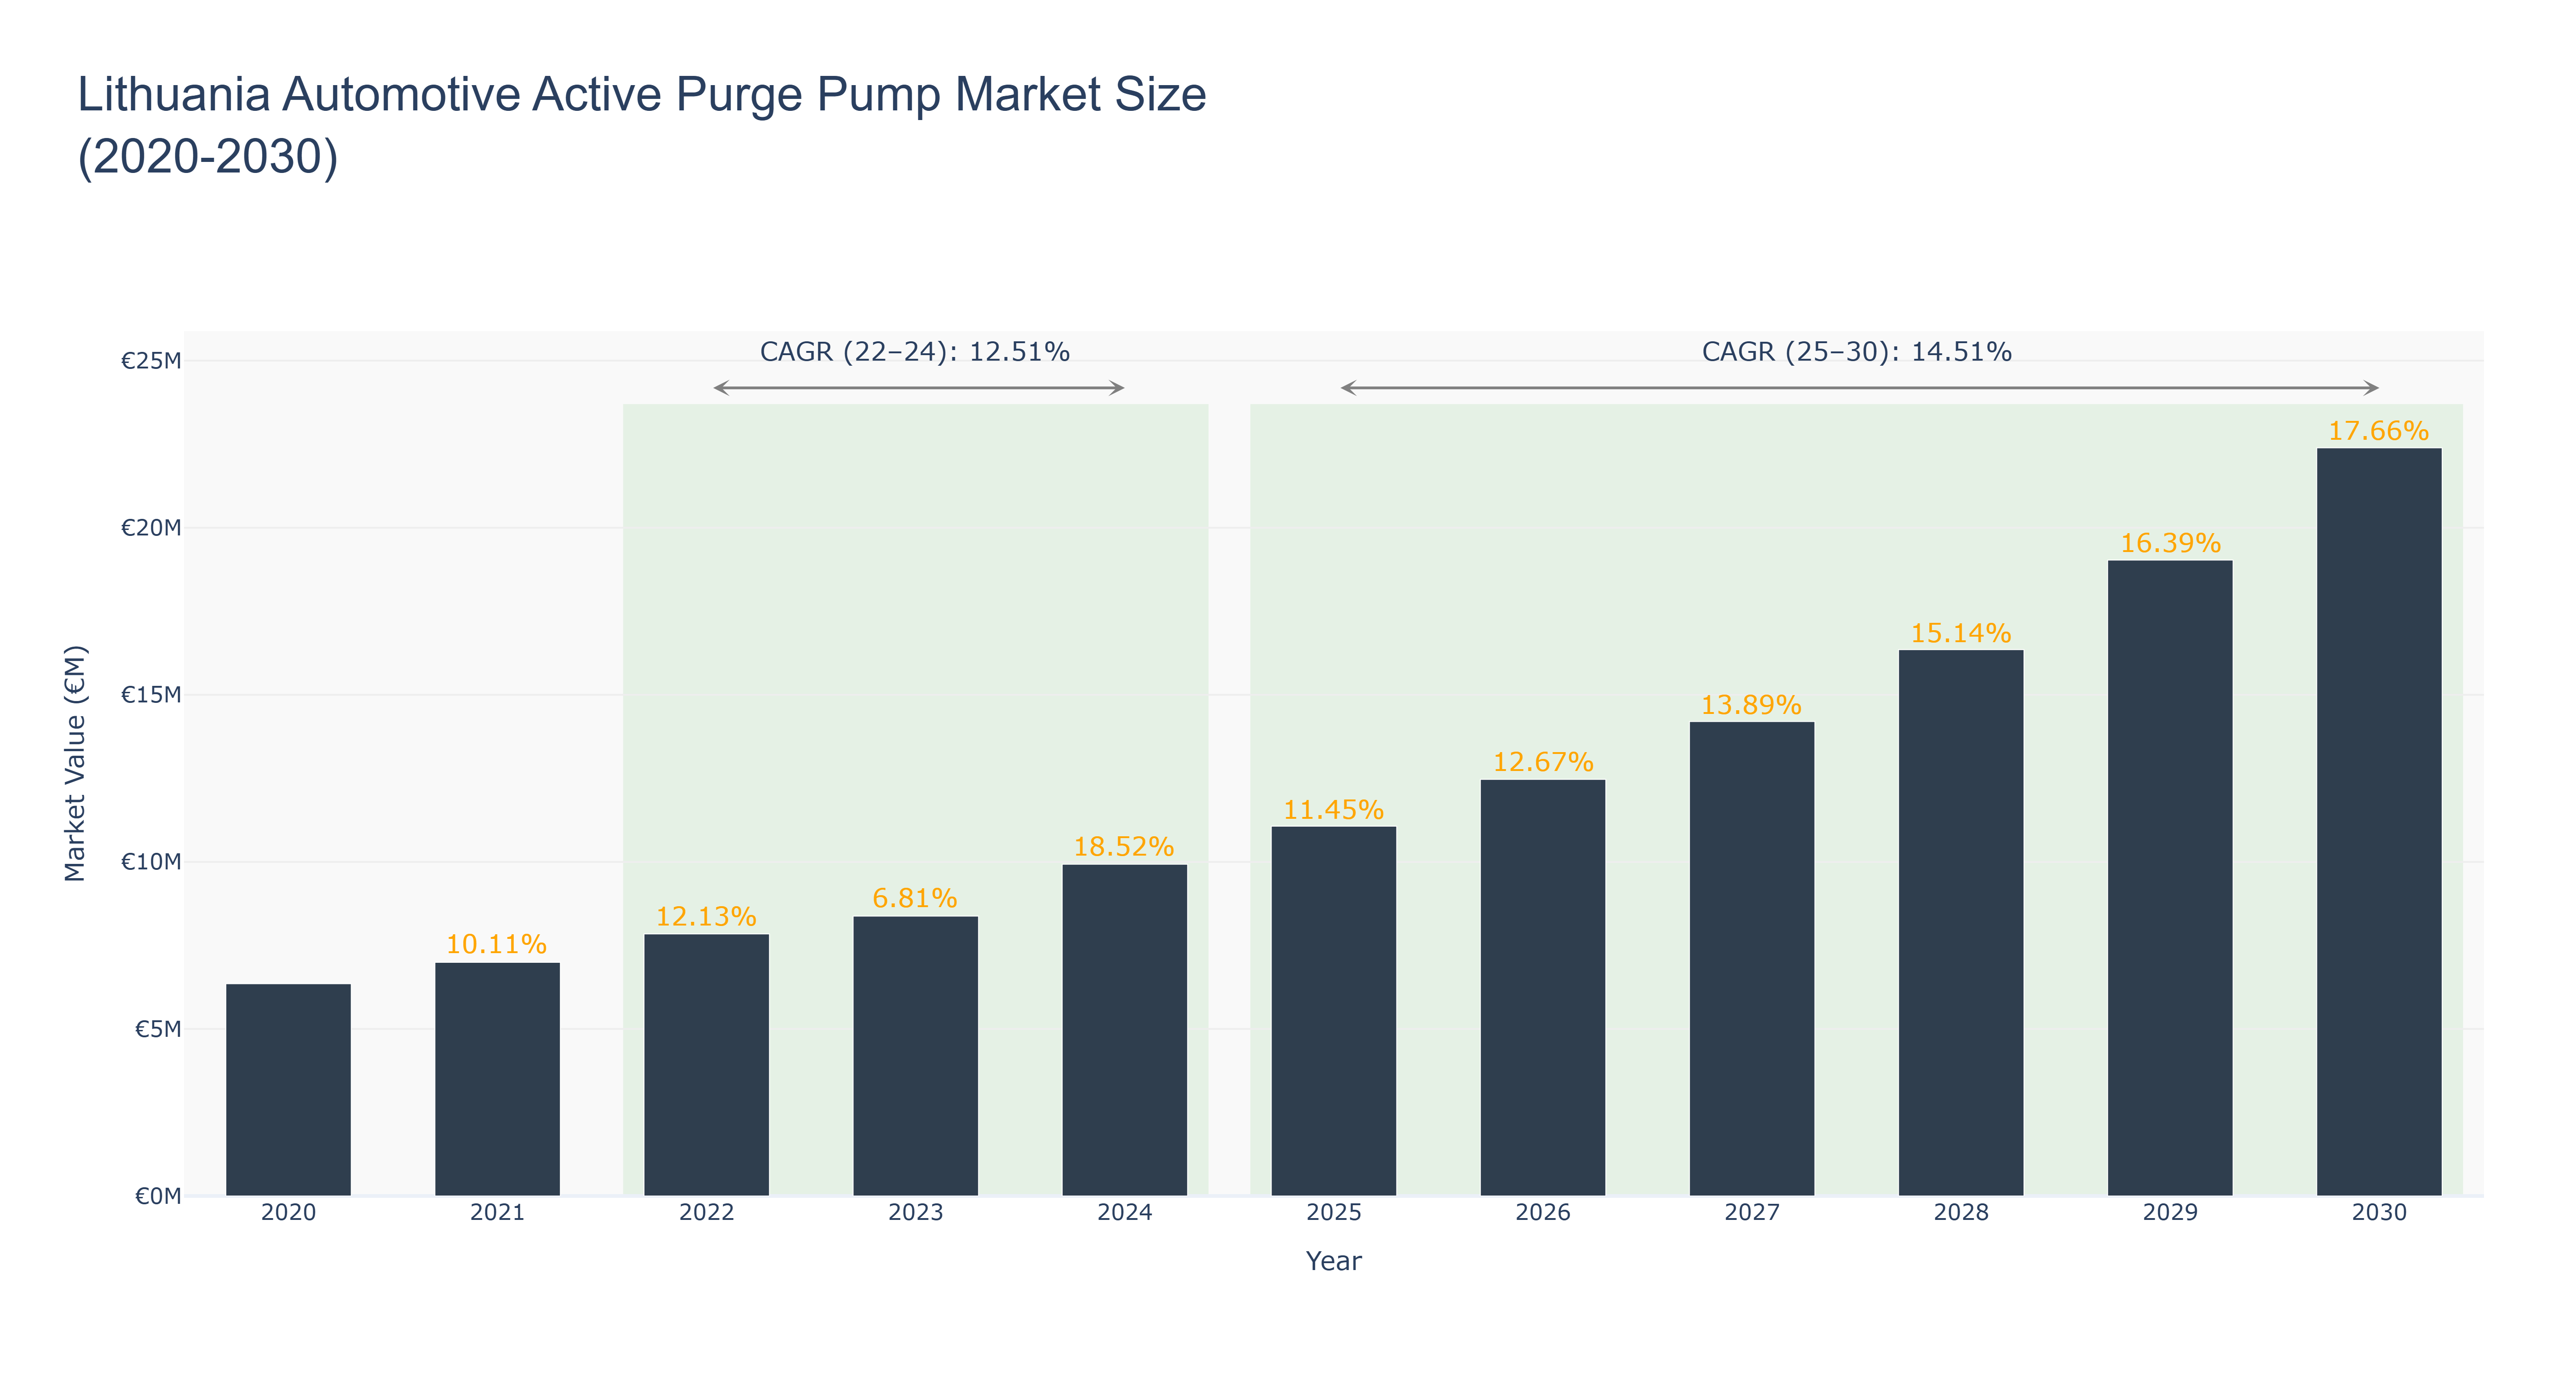
The Lithuania Automotive Active Purge Pump Market has shown a steady growth trajectory over the years. The peak market size of €22.39 million is forecasted for 2030, with an impressive CAGR of 14.51% from 2025 to 2030. The market size has notably increased from €6.35 million in 2020 to €9.93 million in 2024, driven by technological advancements and increasing demand for automotive components. The period from 2025 to 2030 is expected to witness accelerated growth due to the rising adoption of active purge pump systems in vehicles for enhanced fuel efficiency and reduced emissions. Recent developments in the Lithuanian automotive sector include collaborations with leading global manufacturers to introduce innovative purge pump technologies, paving the way for further market expansion and competitiveness.
Lithuania Automotive Active Purge Pump Market: Production & Trade Performance (2019-2025)
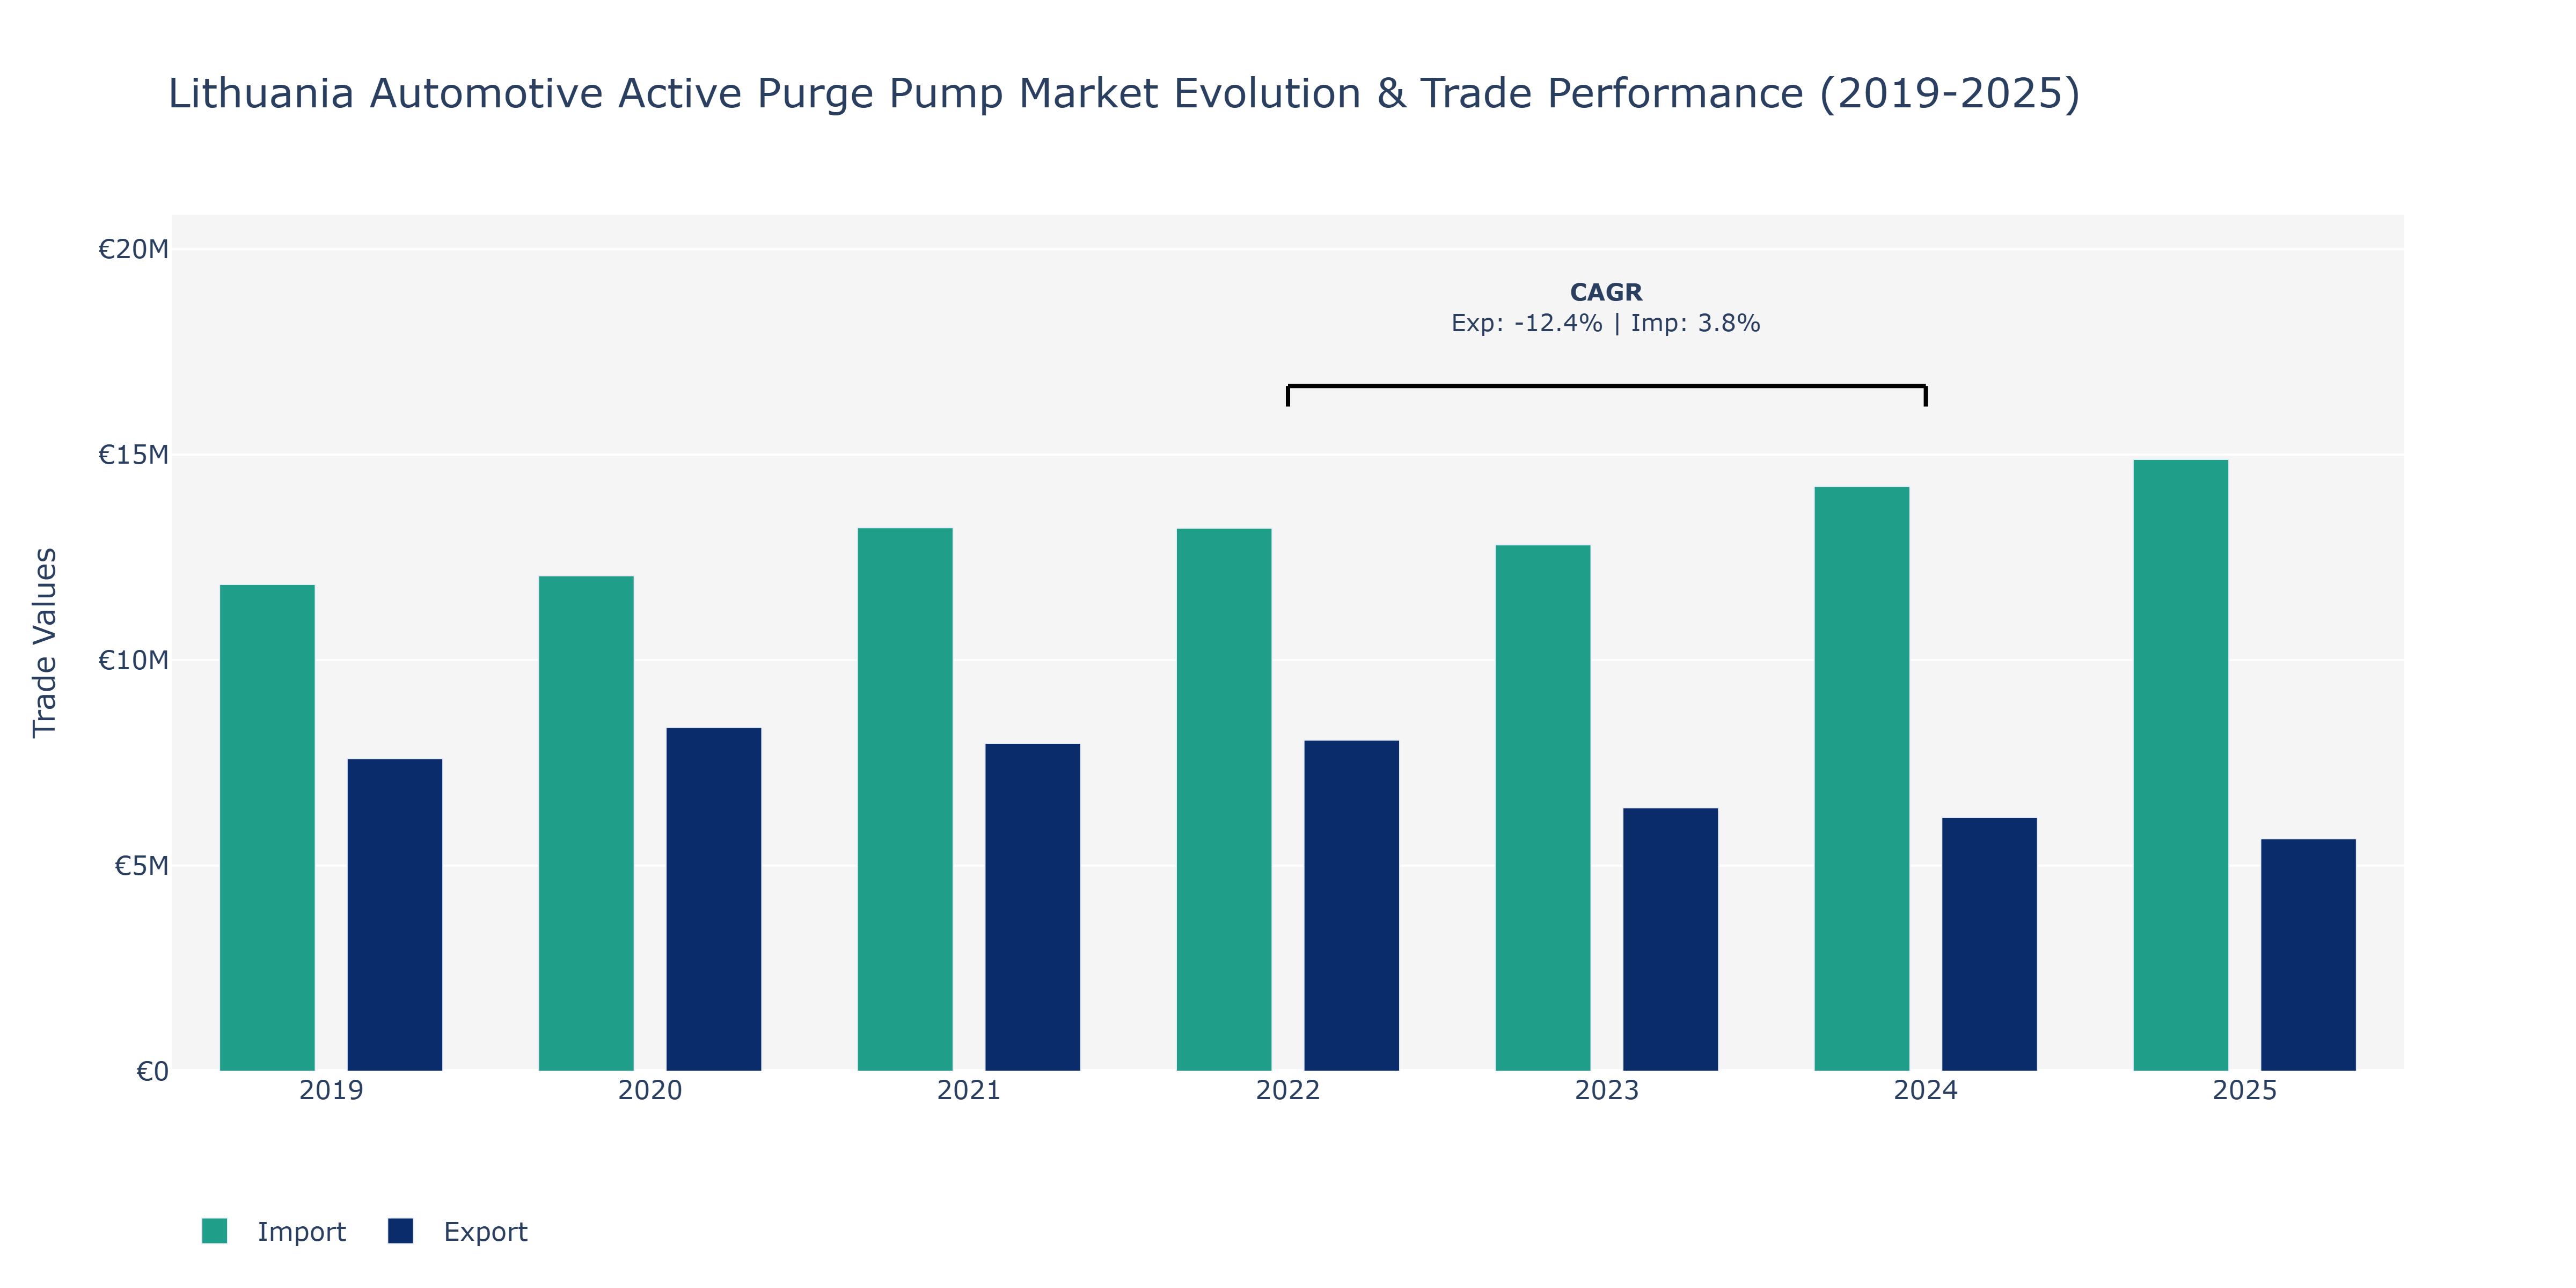
The Lithuania Automotive Active Purge Pump Market witnessed fluctuations in both Exports and Imports over the years. In 2019, Imports stood at €11.84 million, higher than Exports at €7.61 million. By 2020, both Exports and Imports saw an increase, with Exports reaching €8.36 million and Imports at €12.05 million. However, in 2021, Exports decreased to €7.98 million while Imports surged to €13.22 million, indicating a shift in trade dynamics. The trend continued in 2022, with Exports at €8.06 million and Imports at €13.21 million. Notably, in 2024, Exports experienced a drop to €6.17 million, contrasting with a peak in Imports at €14.23 million. The decline in Exports may be attributed to evolving market demands or competitive pressures, while the rise in Imports could signal increased domestic consumption or strategic sourcing decisions within the automotive sector.
Key Highlights of the Report:
- Lithuania Automotive Active Purge Pump Market Outlook
- Market Size of Lithuania Automotive Active Purge Pump Market, 2025
- Forecast of Lithuania Automotive Active Purge Pump Market, 2032
- Historical Data and Forecast of Lithuania Automotive Active Purge Pump Revenues & Volume for the Period 2022 - 2032
- Lithuania Automotive Active Purge Pump Market Trend Evolution
- Lithuania Automotive Active Purge Pump Market Drivers and Challenges
- Lithuania Automotive Active Purge Pump Price Trends
- Lithuania Automotive Active Purge Pump Porter's Five Forces
- Lithuania Automotive Active Purge Pump Industry Life Cycle
- Historical Data and Forecast of Lithuania Automotive Active Purge Pump Market Revenues & Volume By Components for the Period 2022 - 2032
- Historical Data and Forecast of Lithuania Automotive Active Purge Pump Market Revenues & Volume By Sensors for the Period 2022 - 2032
- Historical Data and Forecast of Lithuania Automotive Active Purge Pump Market Revenues & Volume By DC Motor for the Period 2022 - 2032
- Historical Data and Forecast of Lithuania Automotive Active Purge Pump Market Revenues & Volume By Valves for the Period 2022 - 2032
- Historical Data and Forecast of Lithuania Automotive Active Purge Pump Market Revenues & Volume By Actuators for the Period 2022 - 2032
- Historical Data and Forecast of Lithuania Automotive Active Purge Pump Market Revenues & Volume By Material for the Period 2022 - 2032
- Historical Data and Forecast of Lithuania Automotive Active Purge Pump Market Revenues & Volume By Non Metal for the Period 2022 - 2032
- Historical Data and Forecast of Lithuania Automotive Active Purge Pump Market Revenues & Volume By Metal for the Period 2022 - 2032
- Historical Data and Forecast of Lithuania Automotive Active Purge Pump Market Revenues & Volume By Manufacturing Process for the Period 2022 - 2032
- Historical Data and Forecast of Lithuania Automotive Active Purge Pump Market Revenues & Volume By Vacuum Forming for the Period 2022 - 2032
- Historical Data and Forecast of Lithuania Automotive Active Purge Pump Market Revenues & Volume By Cutting for the Period 2022 - 2032
- Historical Data and Forecast of Lithuania Automotive Active Purge Pump Market Revenues & Volume By Injection Molding for the Period 2022 - 2032
- Historical Data and Forecast of Lithuania Automotive Active Purge Pump Market Revenues & Volume By Vehicle Type for the Period 2022 - 2032
- Historical Data and Forecast of Lithuania Automotive Active Purge Pump Market Revenues & Volume By Commercial Vehicle for the Period 2022 - 2032
- Historical Data and Forecast of Lithuania Automotive Active Purge Pump Market Revenues & Volume By Passenger Vehicle for the Period 2022 - 2032
- Historical Data and Forecast of Lithuania Automotive Active Purge Pump Market Revenues & Volume By Sales Channel for the Period 2022 - 2032
- Historical Data and Forecast of Lithuania Automotive Active Purge Pump Market Revenues & Volume By Aftermarket for the Period 2022 - 2032
- Historical Data and Forecast of Lithuania Automotive Active Purge Pump Market Revenues & Volume By Original Equipment Manufacturers (OEMs) for the Period 2022 - 2032
- Lithuania Automotive Active Purge Pump Import Export Trade Statistics
- Market Opportunity Assessment By Components
- Market Opportunity Assessment By Material
- Market Opportunity Assessment By Manufacturing Process
- Market Opportunity Assessment By Vehicle Type
- Market Opportunity Assessment By Sales Channel
- Lithuania Automotive Active Purge Pump Top Companies Market Share
- Lithuania Automotive Active Purge Pump Competitive Benchmarking By Technical and Operational Parameters
- Lithuania Automotive Active Purge Pump Company Profiles
- Lithuania Automotive Active Purge Pump Key Strategic Recommendations
Frequently Asked Questions About the Market Study (FAQs):
6Wresearch actively monitors the Lithuania Automotive Active Purge Pump Market and publishes its comprehensive annual report, highlighting emerging trends, growth drivers, revenue analysis, and forecast outlook. Our insights help businesses to make data-backed strategic decisions with ongoing market dynamics. Our analysts track relevent industries related to the Lithuania Automotive Active Purge Pump Market, allowing our clients with actionable intelligence and reliable forecasts tailored to emerging regional needs.
Yes, we provide customisation as per your requirements. To learn more, feel free to contact us on sales@6wresearch.com
1 Executive Summary |
2 Introduction |
2.1 Key Highlights of the Report |
2.2 Report Description |
2.3 Market Scope & Segmentation |
2.4 Research Methodology |
2.5 Assumptions |
3 Lithuania Automotive Active Purge Pump Market Overview |
3.1 Lithuania Country Macro Economic Indicators |
3.2 Lithuania Automotive Active Purge Pump Market Revenues & Volume, 2022 & 2032F |
3.3 Lithuania Automotive Active Purge Pump Market - Industry Life Cycle |
3.4 Lithuania Automotive Active Purge Pump Market - Porter's Five Forces |
3.5 Lithuania Automotive Active Purge Pump Market Revenues & Volume Share, By Components, 2022 & 2032F |
3.6 Lithuania Automotive Active Purge Pump Market Revenues & Volume Share, By Material, 2022 & 2032F |
3.7 Lithuania Automotive Active Purge Pump Market Revenues & Volume Share, By Manufacturing Process, 2022 & 2032F |
3.8 Lithuania Automotive Active Purge Pump Market Revenues & Volume Share, By Vehicle Type, 2022 & 2032F |
3.9 Lithuania Automotive Active Purge Pump Market Revenues & Volume Share, By Sales Channel, 2022 & 2032F |
4 Lithuania Automotive Active Purge Pump Market Dynamics |
4.1 Impact Analysis |
4.2 Market Drivers |
4.2.1 Stringent emission regulations in Lithuania promoting the adoption of automotive active purge pumps for reducing vehicle emissions. |
4.2.2 Increasing awareness among consumers and manufacturers about the benefits of automotive active purge pumps in improving fuel efficiency and reducing environmental impact. |
4.2.3 Growing demand for advanced vehicle technologies and components in the Lithuanian automotive market. |
4.3 Market Restraints |
4.3.1 High initial investment costs associated with the implementation of automotive active purge pump systems. |
4.3.2 Limited availability of skilled technicians and engineers for the installation and maintenance of automotive active purge pumps. |
5 Lithuania Automotive Active Purge Pump Market Trends |
6 Lithuania Automotive Active Purge Pump Market, By Types |
6.1 Lithuania Automotive Active Purge Pump Market, By Components |
6.1.1 Overview and Analysis |
6.1.2 Lithuania Automotive Active Purge Pump Market Revenues & Volume, By Components, 2022 - 2032F |
6.1.3 Lithuania Automotive Active Purge Pump Market Revenues & Volume, By Sensors, 2022 - 2032F |
6.1.4 Lithuania Automotive Active Purge Pump Market Revenues & Volume, By DC Motor, 2022 - 2032F |
6.1.5 Lithuania Automotive Active Purge Pump Market Revenues & Volume, By Valves, 2022 - 2032F |
6.1.6 Lithuania Automotive Active Purge Pump Market Revenues & Volume, By Actuators, 2022 - 2032F |
6.2 Lithuania Automotive Active Purge Pump Market, By Material |
6.2.1 Overview and Analysis |
6.2.2 Lithuania Automotive Active Purge Pump Market Revenues & Volume, By Non Metal, 2022 - 2032F |
6.2.3 Lithuania Automotive Active Purge Pump Market Revenues & Volume, By Metal, 2022 - 2032F |
6.3 Lithuania Automotive Active Purge Pump Market, By Manufacturing Process |
6.3.1 Overview and Analysis |
6.3.2 Lithuania Automotive Active Purge Pump Market Revenues & Volume, By Vacuum Forming, 2022 - 2032F |
6.3.3 Lithuania Automotive Active Purge Pump Market Revenues & Volume, By Cutting, 2022 - 2032F |
6.3.4 Lithuania Automotive Active Purge Pump Market Revenues & Volume, By Injection Molding, 2022 - 2032F |
6.4 Lithuania Automotive Active Purge Pump Market, By Vehicle Type |
6.4.1 Overview and Analysis |
6.4.2 Lithuania Automotive Active Purge Pump Market Revenues & Volume, By Commercial Vehicle, 2022 - 2032F |
6.4.3 Lithuania Automotive Active Purge Pump Market Revenues & Volume, By Passenger Vehicle, 2022 - 2032F |
6.5 Lithuania Automotive Active Purge Pump Market, By Sales Channel |
6.5.1 Overview and Analysis |
6.5.2 Lithuania Automotive Active Purge Pump Market Revenues & Volume, By Aftermarket, 2022 - 2032F |
6.5.3 Lithuania Automotive Active Purge Pump Market Revenues & Volume, By Original Equipment Manufacturers (OEMs), 2022 - 2032F |
7 Lithuania Automotive Active Purge Pump Market Import-Export Trade Statistics |
7.1 Lithuania Automotive Active Purge Pump Market Export to Major Countries |
7.2 Lithuania Automotive Active Purge Pump Market Imports from Major Countries |
8 Lithuania Automotive Active Purge Pump Market Key Performance Indicators |
8.1 Percentage increase in the adoption rate of automotive active purge pumps in new vehicles in Lithuania. |
8.2 Average reduction in vehicle emissions achieved through the use of automotive active purge pumps. |
8.3 Number of partnerships and collaborations between automotive manufacturers and active purge pump suppliers in Lithuania. |
9 Lithuania Automotive Active Purge Pump Market - Opportunity Assessment |
9.1 Lithuania Automotive Active Purge Pump Market Opportunity Assessment, By Components, 2022 & 2032F |
9.2 Lithuania Automotive Active Purge Pump Market Opportunity Assessment, By Material, 2022 & 2032F |
9.3 Lithuania Automotive Active Purge Pump Market Opportunity Assessment, By Manufacturing Process, 2022 & 2032F |
9.4 Lithuania Automotive Active Purge Pump Market Opportunity Assessment, By Vehicle Type, 2022 & 2032F |
9.5 Lithuania Automotive Active Purge Pump Market Opportunity Assessment, By Sales Channel, 2022 & 2032F |
10 Lithuania Automotive Active Purge Pump Market - Competitive Landscape |
10.1 Lithuania Automotive Active Purge Pump Market Revenue Share, By Companies, 2025 |
10.2 Lithuania Automotive Active Purge Pump Market Competitive Benchmarking, By Operating and Technical Parameters |
11 Company Profiles |
12 Recommendations |
13 Disclaimer |
Export potential assessment - trade Analytics for 2030
Export potential enables firms to identify high-growth global markets with greater confidence by combining advanced trade intelligence with a structured quantitative methodology. The framework analyzes emerging demand trends and country-level import patterns while integrating macroeconomic and trade datasets such as GDP and population forecasts, bilateral import–export flows, tariff structures, elasticity differentials between developed and developing economies, geographic distance, and import demand projections. Using weighted trade values from 2020–2024 as the base period to project country-to-country export potential for 2030, these inputs are operationalized through calculated drivers such as gravity model parameters, tariff impact factors, and projected GDP per-capita growth. Through an analysis of hidden potentials, demand hotspots, and market conditions that are most favorable to success, this method enables firms to focus on target countries, maximize returns, and global expansion with data, backed by accuracy.
By factoring in the projected importer demand gap that is currently unmet and could be potential opportunity, it identifies the potential for the Exporter (Country) among 190 countries, against the general trade analysis, which identifies the biggest importer or exporter.
To discover high-growth global markets and optimize your business strategy:
Click Here
Pricing
- Single User License$ 1,995
- Department License$ 2,400
- Site License$ 3,120
- Global License$ 3,795

Search
Thought Leadership and Analyst Meet


Our Clients
Latest Reports
- United Kingdom (UK) Outdoor Cooking Equipment Market (2026-2032) | Investment Opportunities, Outlook, Growth, Competition, Trends, Pricing, Demand, Insights, Challenges, Drivers, Size, Restraints, segmentation, Value, Share, Forecast, Companies, Analysis, Revenue, Strategy
- United Arab Emirates (UAE) Outdoor Cooking Equipment Market (2026-2032) | Challenges, Value, Restraints, Growth, Competition, Revenue, Trends, Outlook, Analysis, Drivers, Share, Investment Opportunities, Strategy, Demand, Companies, Forecast, Pricing, segmentation, Size, Insights
- Vietnam Outdoor Cooking Equipment Market (2026-2032) | Demand, Investment Opportunities, Growth, Pricing, Trends, Restraints, Competition, Outlook, Drivers, Strategy, Challenges, Revenue, Analysis, segmentation, Value, Size, Share, Insights, Companies, Forecast
- Venezuela Outdoor Cooking Equipment Market (2026-2032) | Challenges, Revenue, Demand, Value, Pricing, Strategy, Competition, Analysis, Companies, Insights, Growth, Outlook, Forecast, Size, Restraints, segmentation, Drivers, Trends, Investment Opportunities, Share
- Uganda Outdoor Cooking Equipment Market (2026-2032) | Drivers, Pricing, Challenges, Value, Growth, Companies, segmentation, Strategy, Analysis, Demand, Outlook, Size, Competition, Restraints, Revenue, Forecast, Investment Opportunities, Insights, Trends, Share
- Turkey Outdoor Cooking Equipment Market (2026-2032) | Size, Competition, Outlook, Strategy, Forecast, Drivers, Trends, Companies, Revenue, Growth, Analysis, segmentation, Insights, Pricing, Restraints, Demand, Investment Opportunities, Value, Share, Challenges
- Tunisia Outdoor Cooking Equipment Market (2026-2032) | Analysis, Share, Pricing, Trends, Size, Outlook, Revenue, segmentation, Demand, Insights, Investment Opportunities, Restraints, Growth, Forecast, Competition, Drivers, Challenges, Companies, Strategy, Value
- Thailand Outdoor Cooking Equipment Market (2026-2032) | Growth, Revenue, Insights, Companies, Drivers, Strategy, Forecast, Size, Analysis, segmentation, Trends, Challenges, Competition, Share, Investment Opportunities, Demand, Pricing, Value, Restraints, Outlook
- Tanzania Outdoor Cooking Equipment Market (2026-2032) | Share, Drivers, Forecast, Revenue, Growth, Outlook, Analysis, Investment Opportunities, Restraints, segmentation, Demand, Pricing, Size, Insights, Challenges, Competition, Companies, Value, Trends, Strategy
- Tajikistan Outdoor Cooking Equipment Market (2026-2032) | Value, Pricing, Companies, Share, Strategy, Revenue, Investment Opportunities, Demand, Forecast, Size, Competition, Challenges, Growth, Insights, Restraints, segmentation, Analysis, Trends, Drivers, Outlook
Industry Events and Analyst Meet

HIMTEX 2026

India Refining Summit 2026

India EV Show 2026

EV tech India Expo 2026

Auto Tech Asia 2026
Whitepaper
- Middle East & Africa Commercial Security Market Click here to view more.
- Middle East & Africa Fire Safety Systems & Equipment Market Click here to view more.
- GCC Drone Market Click here to view more.
- Middle East Lighting Fixture Market Click here to view more.
- GCC Physical & Perimeter Security Market Click here to view more.
6WResearch In News
- Doha a strategic location for EV manufacturing hub: IPA Qatar
- Demand for luxury TVs surging in the GCC, says Samsung
- Empowering Growth: The Thriving Journey of Bangladesh’s Cable Industry
- Demand for luxury TVs surging in the GCC, says Samsung
- Video call with a traditional healer? Once unthinkable, it’s now common in South Africa
- Intelligent Buildings To Smooth GCC’s Path To Net Zero