Lithuania Blenders Market (2026-2032) | Trends, Forecast, Revenue, Size, Value, Growth, Analysis, Segmentation, Share, Companies, Outlook & Industry
Market Forecast By Types (Hand Blenders, Single-Serve Blenders, Full-Size Blenders), By Applications (Commercial, Household) And Competitive Landscape
| Product Code: ETC4798699 | Publication Date: Nov 2023 | Updated Date: Apr 2026 | Product Type: Market Research Report | |
| Publisher: 6Wresearch | Author: Shubham Padhi | No. of Pages: 60 | No. of Figures: 30 | No. of Tables: 5 |
Lithuania Blenders Market Size (2020-2030)
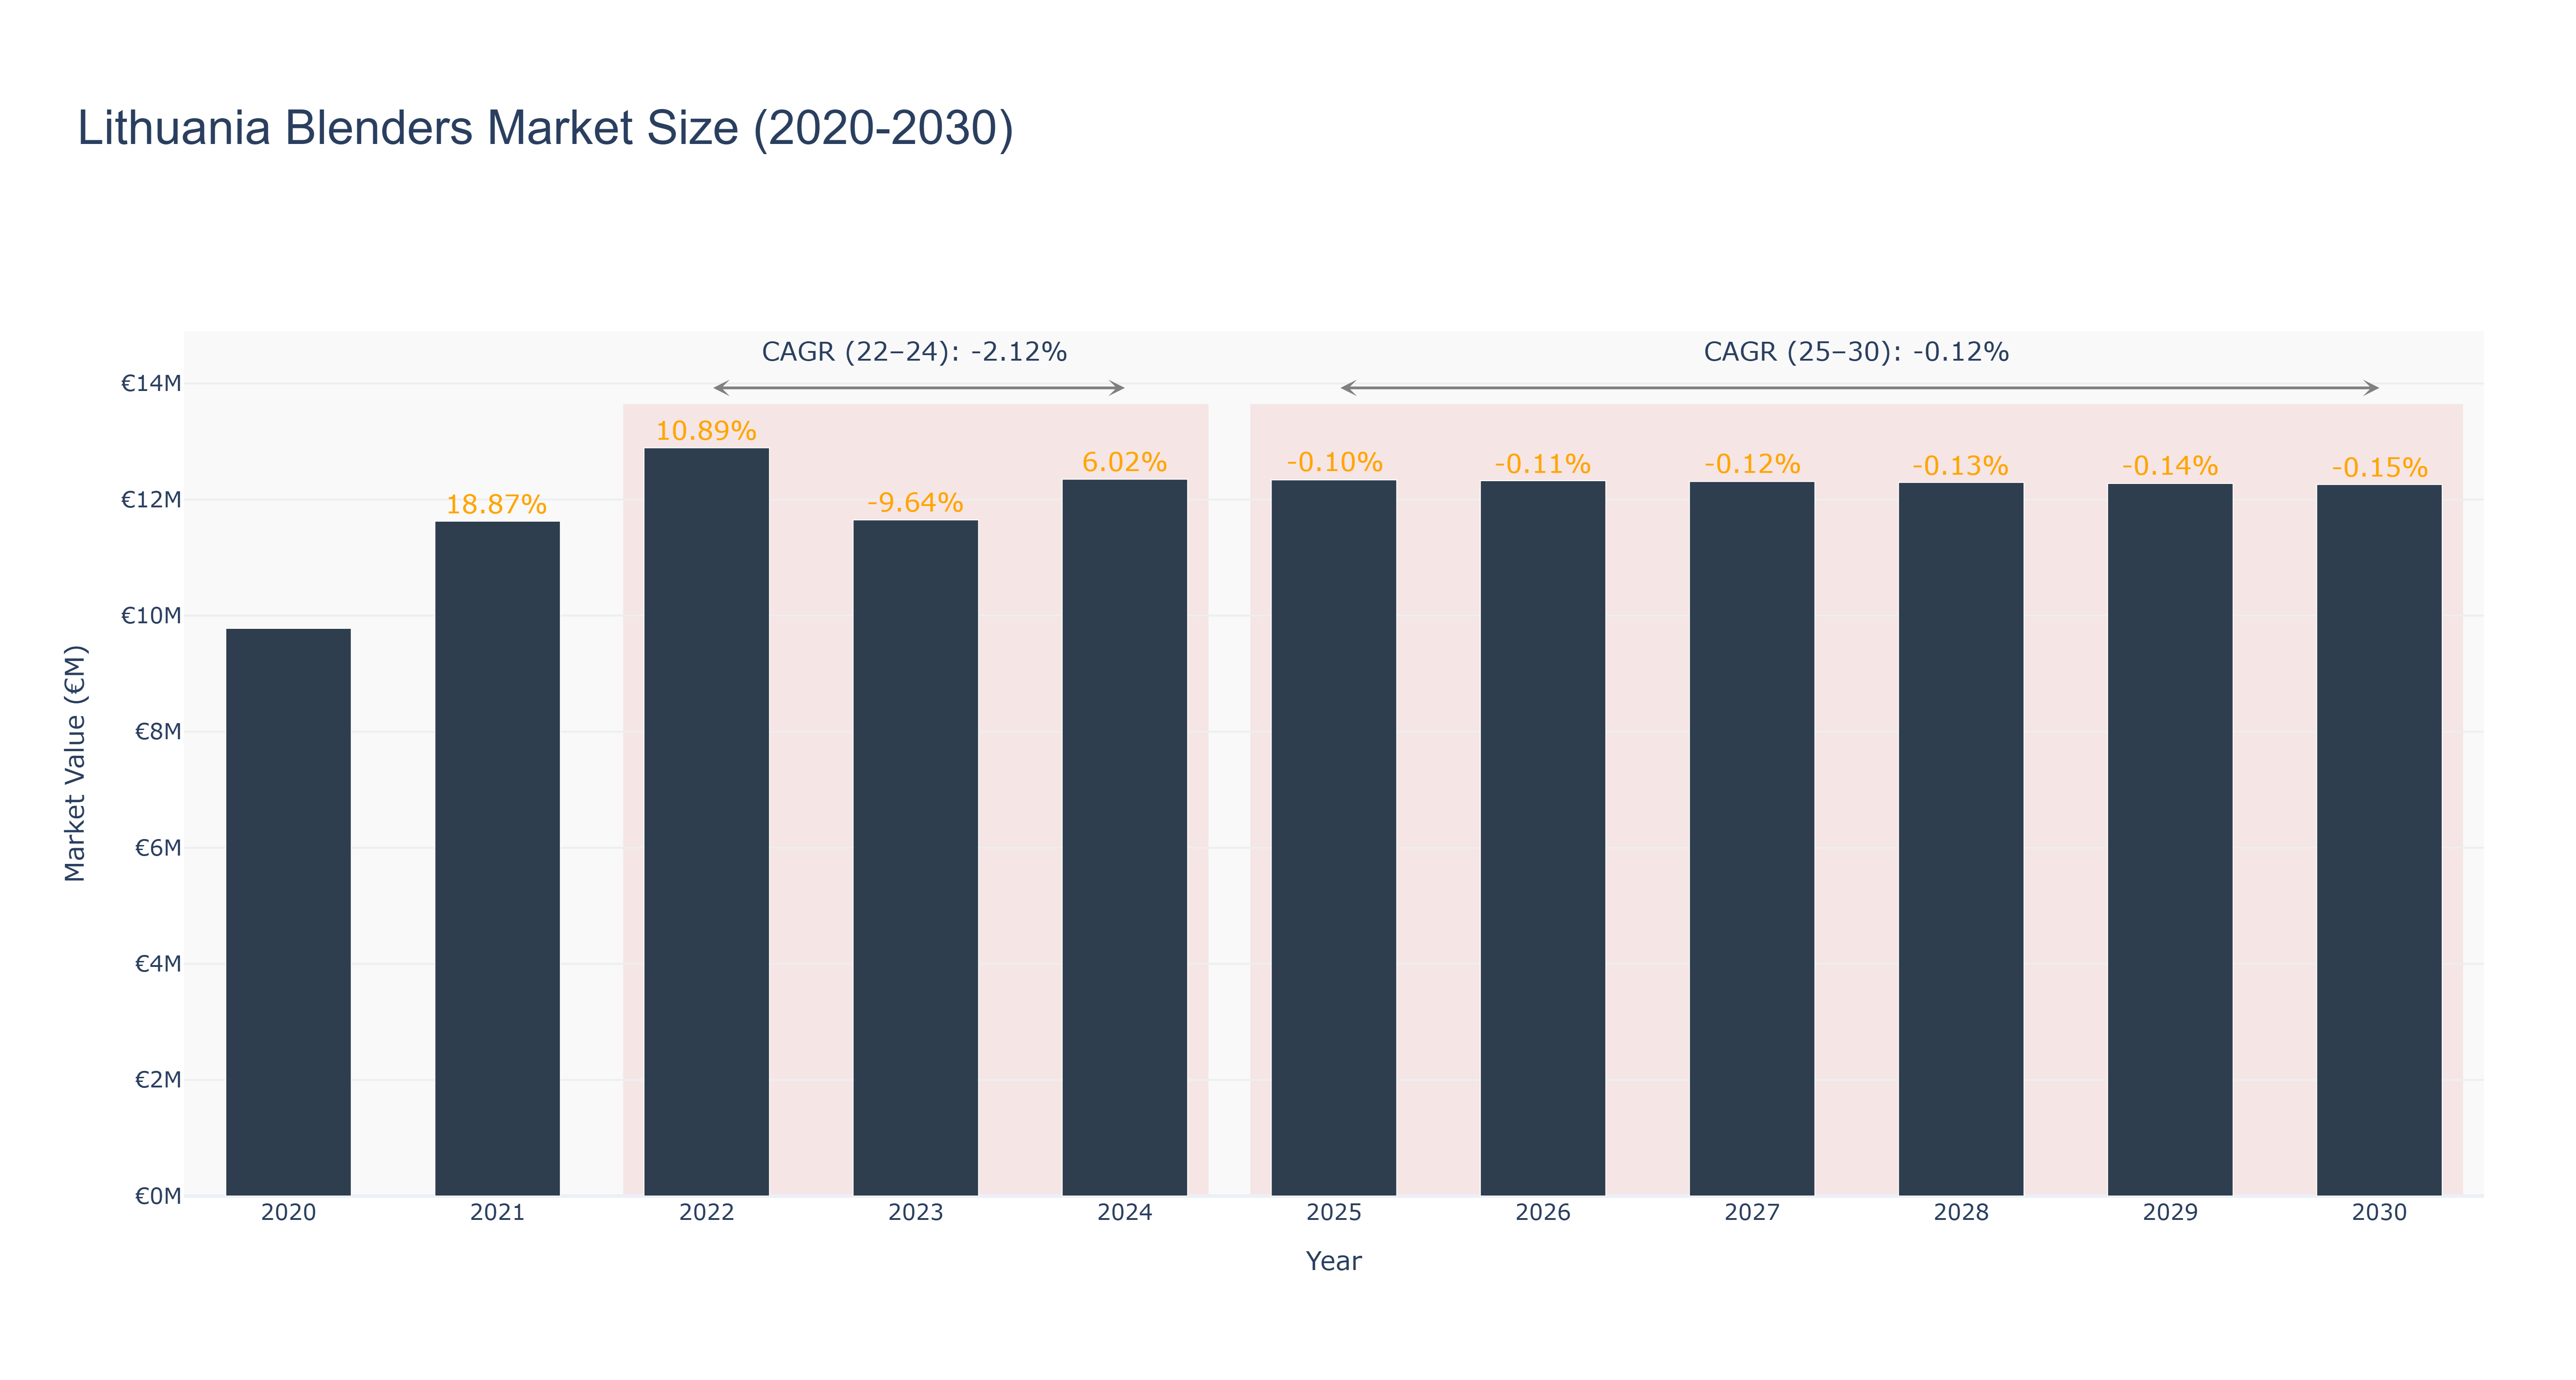
The Lithuania Blenders Market experienced a peak market size of €12.89 million in 2022, with a subsequent decline to €12.35 million in 2024. The forecasted trend shows a gradual decrease from €12.34 million in 2025 to €12.26 million in 2030, with a CAGR of -0.123% from 2025 to 2030. The market faced challenges post-2022 due to evolving consumer preferences and increased competition, leading to a slight contraction in size. Looking ahead, the market is expected to focus on innovation and product differentiation to regain momentum. Recent developments indicate a shift towards sustainable blending technologies and the introduction of smart blender models to cater to the growing demand for convenience and health-conscious products in the region. These initiatives are poised to drive growth and revitalize the market in the coming years.
Lithuania Blenders Market: Production & Trade Performance (2019-2025)
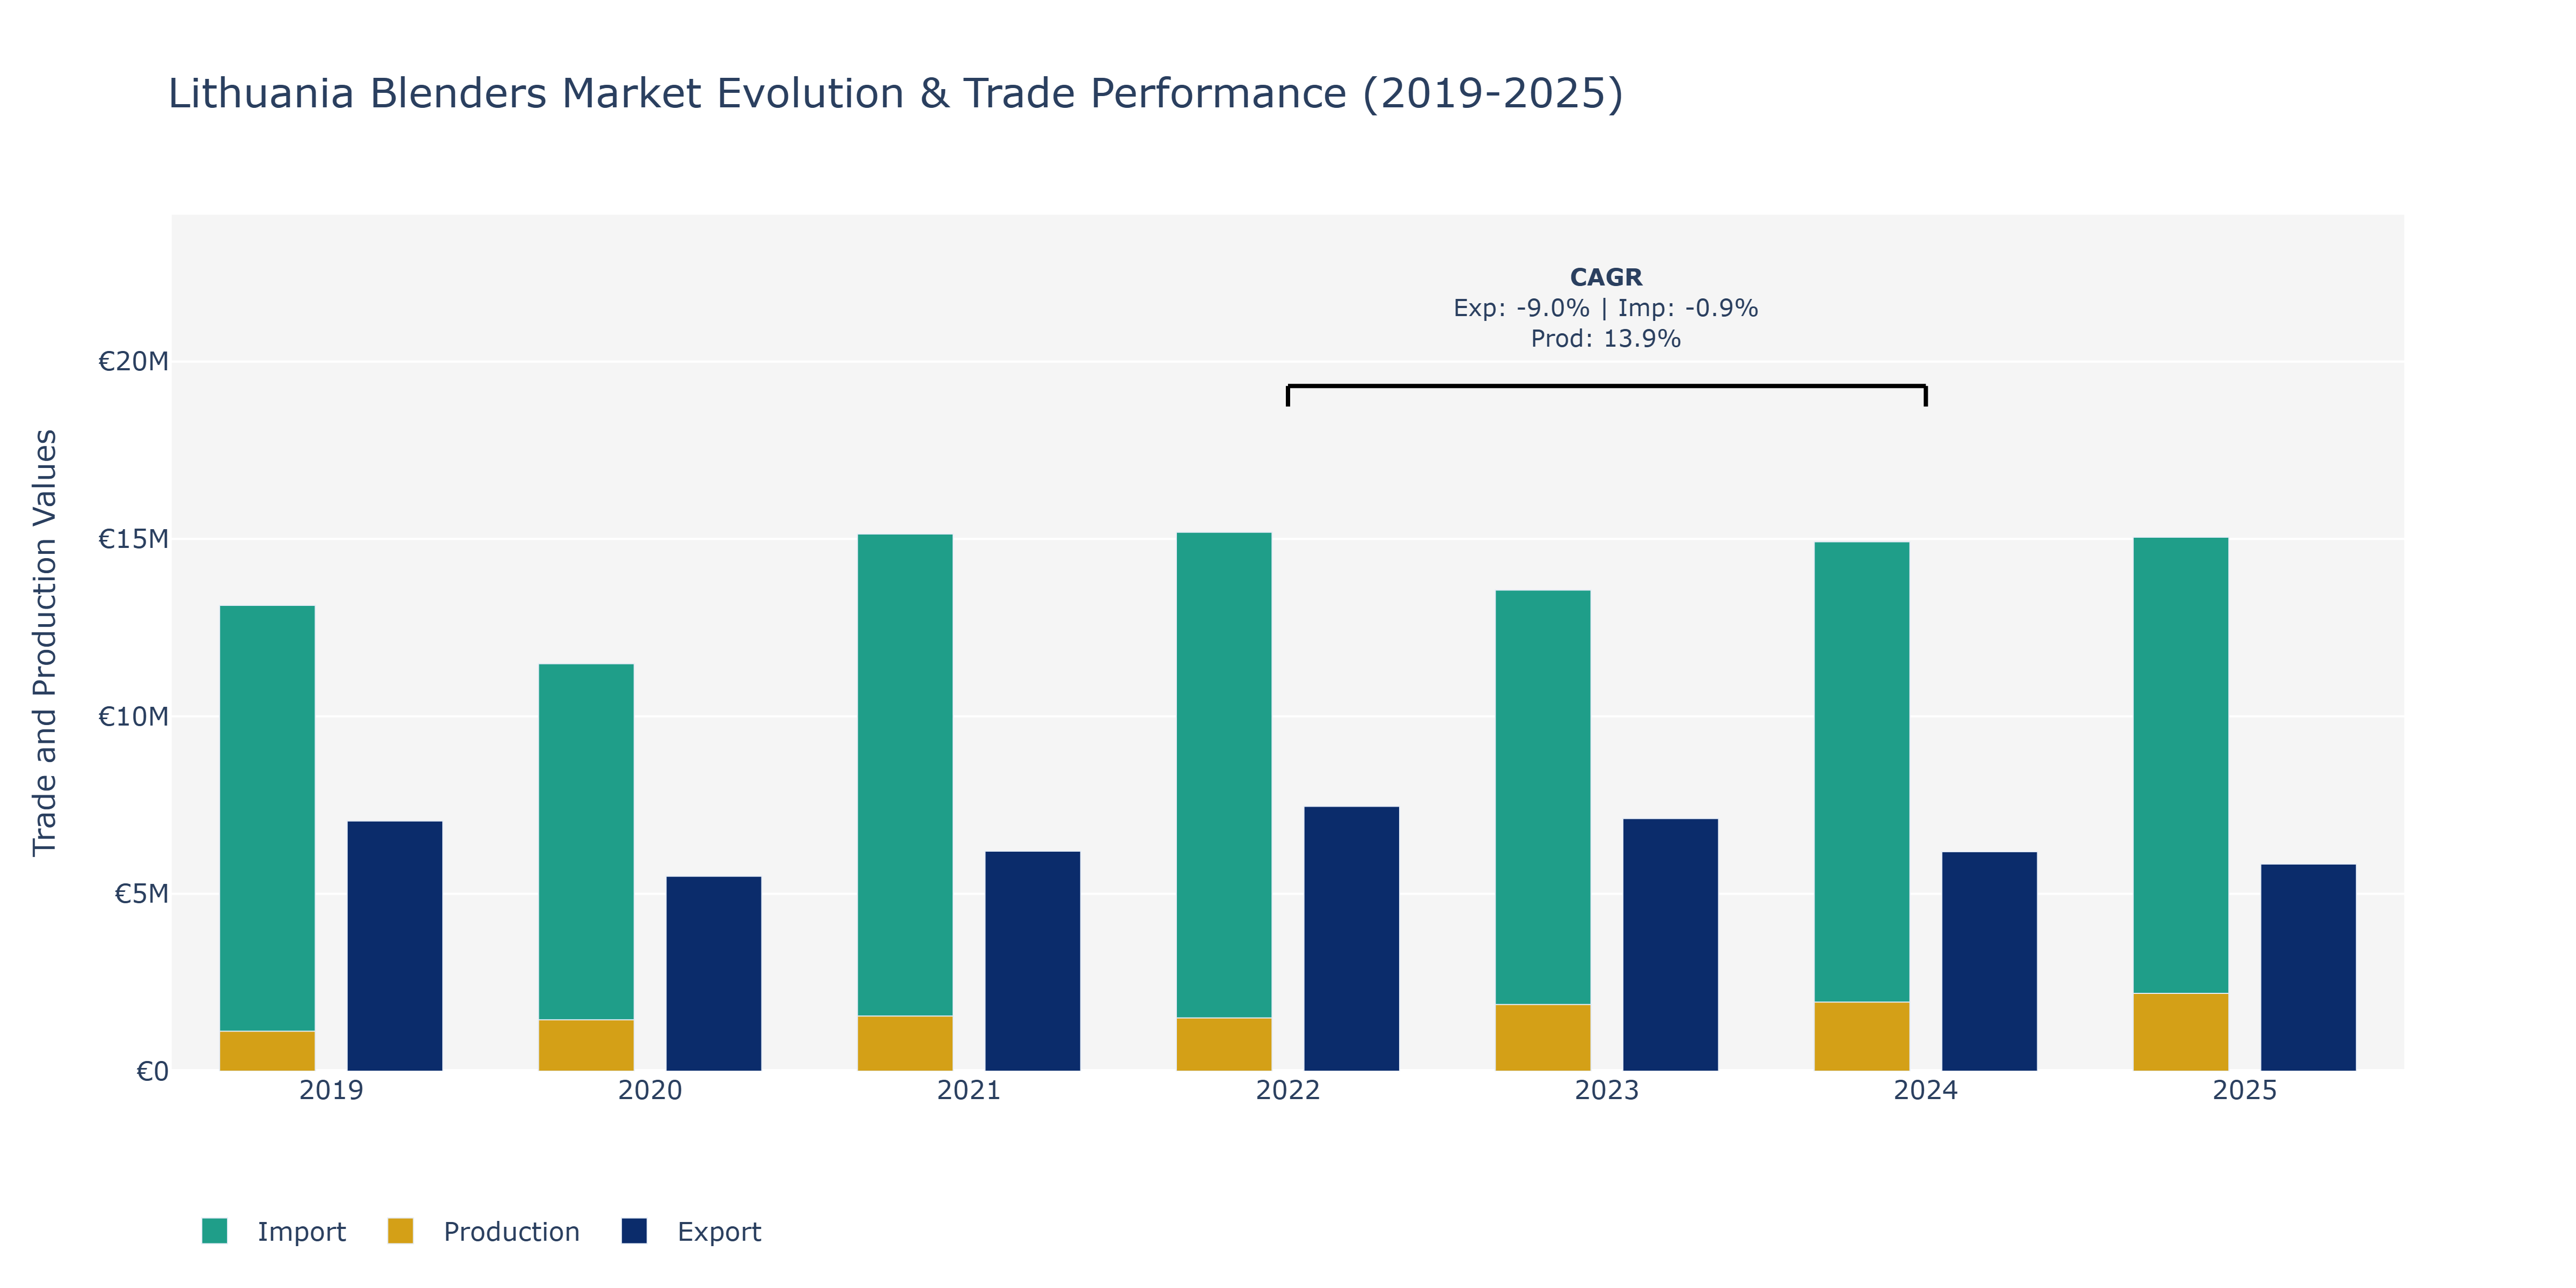
The Lithuania Blenders Market witnessed fluctuations in Exports, Imports, and Production from 2019 to 2025. Exports saw a peak in 2022 at €7.46 million, followed by a decline in subsequent years. Imports, on the other hand, showed a consistent increase, reaching €15.05 million in 2025. Production peaked in 2025 at €2.19 billion, showcasing a steady growth trend. The surge in Production could be attributed to advancements in blending technologies, leading to increased efficiency and output capacity. The decline in Exports post-2022 may be linked to changing global trade dynamics or intensified competition in the blender market. The upward trajectory of Imports suggests a growing demand for blended products in Lithuania, possibly fueled by evolving consumer preferences towards convenience and quality. These trends signify the evolving landscape of the blender market, necessitating market players to adapt strategies to remain competitive and meet changing consumer demands.
Key Highlights of the Report:
- Lithuania Blenders Market Outlook
- Market Size of Lithuania Blenders Market, 2025
- Forecast of Lithuania Blenders Market, 2032
- Historical Data and Forecast of Lithuania Blenders Revenues & Volume for the Period 2022 - 2032F
- Lithuania Blenders Market Trend Evolution
- Lithuania Blenders Market Drivers and Challenges
- Lithuania Blenders Price Trends
- Lithuania Blenders Porter`s Five Forces
- Lithuania Blenders Industry Life Cycle
- Historical Data and Forecast of Lithuania Blenders Market Revenues & Volume By Types for the Period 2022 - 2032F
- Historical Data and Forecast of Lithuania Blenders Market Revenues & Volume By Hand Blenders for the Period 2022 - 2032F
- Historical Data and Forecast of Lithuania Blenders Market Revenues & Volume By Single-Serve Blenders for the Period 2022 - 2032F
- Historical Data and Forecast of Lithuania Blenders Market Revenues & Volume By Full-Size Blenders for the Period 2022 - 2032F
- Historical Data and Forecast of Lithuania Blenders Market Revenues & Volume By Applications for the Period 2022 - 2032F
- Historical Data and Forecast of Lithuania Blenders Market Revenues & Volume By Commercial for the Period 2022 - 2032F
- Historical Data and Forecast of Lithuania Blenders Market Revenues & Volume By Household for the Period 2022 - 2032F
- Lithuania Blenders Import Export Trade Statistics
- Market Opportunity Assessment By Types
- Market Opportunity Assessment By Applications
- Lithuania Blenders Top Companies Market Share
- Lithuania Blenders Competitive Benchmarking By Technical and Operational Parameters
- Lithuania Blenders Company Profiles
- Lithuania Blenders Key Strategic Recommendations
Frequently Asked Questions About the Market Study (FAQs):
6Wresearch actively monitors the Lithuania Blenders Market and publishes its comprehensive annual report, highlighting emerging trends, growth drivers, revenue analysis, and forecast outlook. Our insights help businesses to make data-backed strategic decisions with ongoing market dynamics. Our analysts track relevent industries related to the Lithuania Blenders Market, allowing our clients with actionable intelligence and reliable forecasts tailored to emerging regional needs.
Yes, we provide customisation as per your requirements. To learn more, feel free to contact us on sales@6wresearch.com
1 Executive Summary |
2 Introduction |
2.1 Key Highlights of the Report |
2.2 Report Description |
2.3 Market Scope & Segmentation |
2.4 Research Methodology |
2.5 Assumptions |
3 Lithuania Blenders Market Overview |
3.1 Lithuania Country Macro Economic Indicators |
3.2 Lithuania Blenders Market Revenues & Volume, 2022 & 2032F |
3.3 Lithuania Blenders Market - Industry Life Cycle |
3.4 Lithuania Blenders Market - Porter's Five Forces |
3.5 Lithuania Blenders Market Revenues & Volume Share Segmentations, 2022 & 2032F |
3.6 Lithuania Blenders Market Revenues & Volume Share, By Applications, 2022 & 2032F |
4 Lithuania Blenders Market Dynamics |
4.1 Impact Analysis |
4.2 Market Drivers |
4.2.1 Increasing demand for healthy and convenient food options leading to higher adoption of blenders |
4.2.2 Growing trend of home cooking and DIY food preparation |
4.2.3 Rising disposable income levels in Lithuania driving purchases of kitchen appliances |
4.3 Market Restraints |
4.3.1 Intense competition among blender manufacturers leading to price wars and margin pressures |
4.3.2 Fluctuating raw material costs impacting blender pricing and profitability |
5 Lithuania Blenders Market Trends |
6 Lithuania Blenders Market Segmentations |
6.1 Lithuania Blenders Market Segmentations |
6.1.1 Overview and Analysis |
6.1.2 Lithuania Blenders Market Revenues & Volume, By Hand Blenders, 2022 - 2032F |
6.1.3 Lithuania Blenders Market Revenues & Volume, By Single-Serve Blenders, 2022 - 2032F |
6.1.4 Lithuania Blenders Market Revenues & Volume, By Full-Size Blenders, 2022 - 2032F |
6.2 Lithuania Blenders Market, By Applications |
6.2.1 Overview and Analysis |
6.2.2 Lithuania Blenders Market Revenues & Volume, By Commercial, 2022 - 2032F |
6.2.3 Lithuania Blenders Market Revenues & Volume, By Household, 2022 - 2032F |
7 Lithuania Blenders Market Import-Export Trade Statistics |
7.1 Lithuania Blenders Market Export to Major Countries |
7.2 Lithuania Blenders Market Imports from Major Countries |
8 Lithuania Blenders Market Key Performance Indicators |
8.1 Consumer awareness and perception of blender brands |
8.2 Rate of new product development and innovation in the blender market |
8.3 Customer satisfaction and loyalty towards blender brands |
8.4 Adoption rate of smart/bluetooth-enabled blenders |
8.5 Environmental sustainability practices in blender manufacturing and packaging |
9 Lithuania Blenders Market - Opportunity Assessment |
9.1 Lithuania Blenders Market Opportunity Assessment Segmentations, 2022 & 2032F |
9.2 Lithuania Blenders Market Opportunity Assessment, By Applications, 2022 & 2032F |
10 Lithuania Blenders Market - Competitive Landscape |
10.1 Lithuania Blenders Market Revenue Share, By Companies, 2025 |
10.2 Lithuania Blenders Market Competitive Benchmarking, By Operating and Technical Parameters |
11 Company Profiles |
12 Recommendations | 13 Disclaimer |
Global Go To Market Strategy - 2030
Export potential enables firms to identify high-growth global markets with greater confidence by combining advanced trade intelligence with a structured quantitative methodology. The framework analyzes emerging demand trends and country-level import patterns while integrating macroeconomic and trade datasets such as GDP and population forecasts, bilateral import–export flows, tariff structures, elasticity differentials between developed and developing economies, geographic distance, and import demand projections. Using weighted trade values from 2020–2024 as the base period to project country-to-country export potential for 2030, these inputs are operationalized through calculated drivers such as gravity model parameters, tariff impact factors, and projected GDP per-capita growth. Through an analysis of hidden potentials, demand hotspots, and market conditions that are most favorable to success, this method enables firms to focus on target countries, maximize returns, and global expansion with data, backed by accuracy.
By factoring in the projected importer demand gap that is currently unmet and could be potential opportunity, it identifies the potential for the Exporter (Country) among 190 countries, against the general trade analysis, which identifies the biggest importer or exporter.
To discover high-growth global markets and optimize your business strategy:
Click Here
Pricing
- Single User License$ 1,995
- Department License$ 2,400
- Site License$ 3,120
- Global License$ 3,795

Leadership Perspectives from Industry Events
Search
Thought Leadership and Analyst Meet


Our Clients
6WResearch In News
- India Export Attractiveness Tracker 2026
- India Air Conditioner Market Set for Strong Rebound in 2026 After Weather-Led Correction and GST-Driven Recovery: 6Wresearch
- ADAS in India: How Automatic Emergency Braking, Blind Spot Detection & Driver Monitoring are Transforming Road Safety
- Doha a strategic location for EV manufacturing hub: IPA Qatar
- Demand for luxury TVs surging in the GCC, says Samsung
- Empowering Growth: The Thriving Journey of Bangladesh’s Cable Industry
Latest Reports
- Nicaragua RPG Gaming Market (2026-2032)
- New Zealand RPG Gaming Market (2026-2032)
- Netherlands RPG Gaming Market (2026-2032)
- Nauru RPG Gaming Market (2026-2032)
- Namibia RPG Gaming Market (2026-2032)
- Mozambique RPG Gaming Market (2026-2032)
- Montenegro RPG Gaming Market (2026-2032)
- Mongolia RPG Gaming Market (2026-2032)
- Monaco RPG Gaming Market (2026-2032)
- Micronesia RPG Gaming Market (2026-2032)
Industry Events and Analyst Meet

EV India Expo 2026

HIMTEX 2026

India Refining Summit 2026

India EV Show 2026

EV tech India Expo 2026
Whitepaper
- Middle East & Africa Commercial Security Market Click here to view more.
- Middle East & Africa Fire Safety Systems & Equipment Market Click here to view more.
- GCC Drone Market Click here to view more.
- Middle East Lighting Fixture Market Click here to view more.
- GCC Physical & Perimeter Security Market Click here to view more.