Lithuania Braze Alloys Market (2026-2032) | Outlook, Value, Growth, Size & Revenue, Segmentation, Analysis, Industry, Share, Trends, Companies, Forecast, Competitive Landscape
Market Forecast By Base Metal (Primary, Secondary), By Process (Copper, Gold, Aluminum, Silver, Nickel, Others) And Competitive Landscape
| Product Code: ETC8036193 | Publication Date: Sep 2024 | Updated Date: Apr 2026 | Product Type: Market Research Report | |
| Publisher: 6Wresearch | Author: Sumit Sagar | No. of Pages: 75 | No. of Figures: 35 | No. of Tables: 20 |
Lithuania Braze Alloys Market Size (2020-2030)
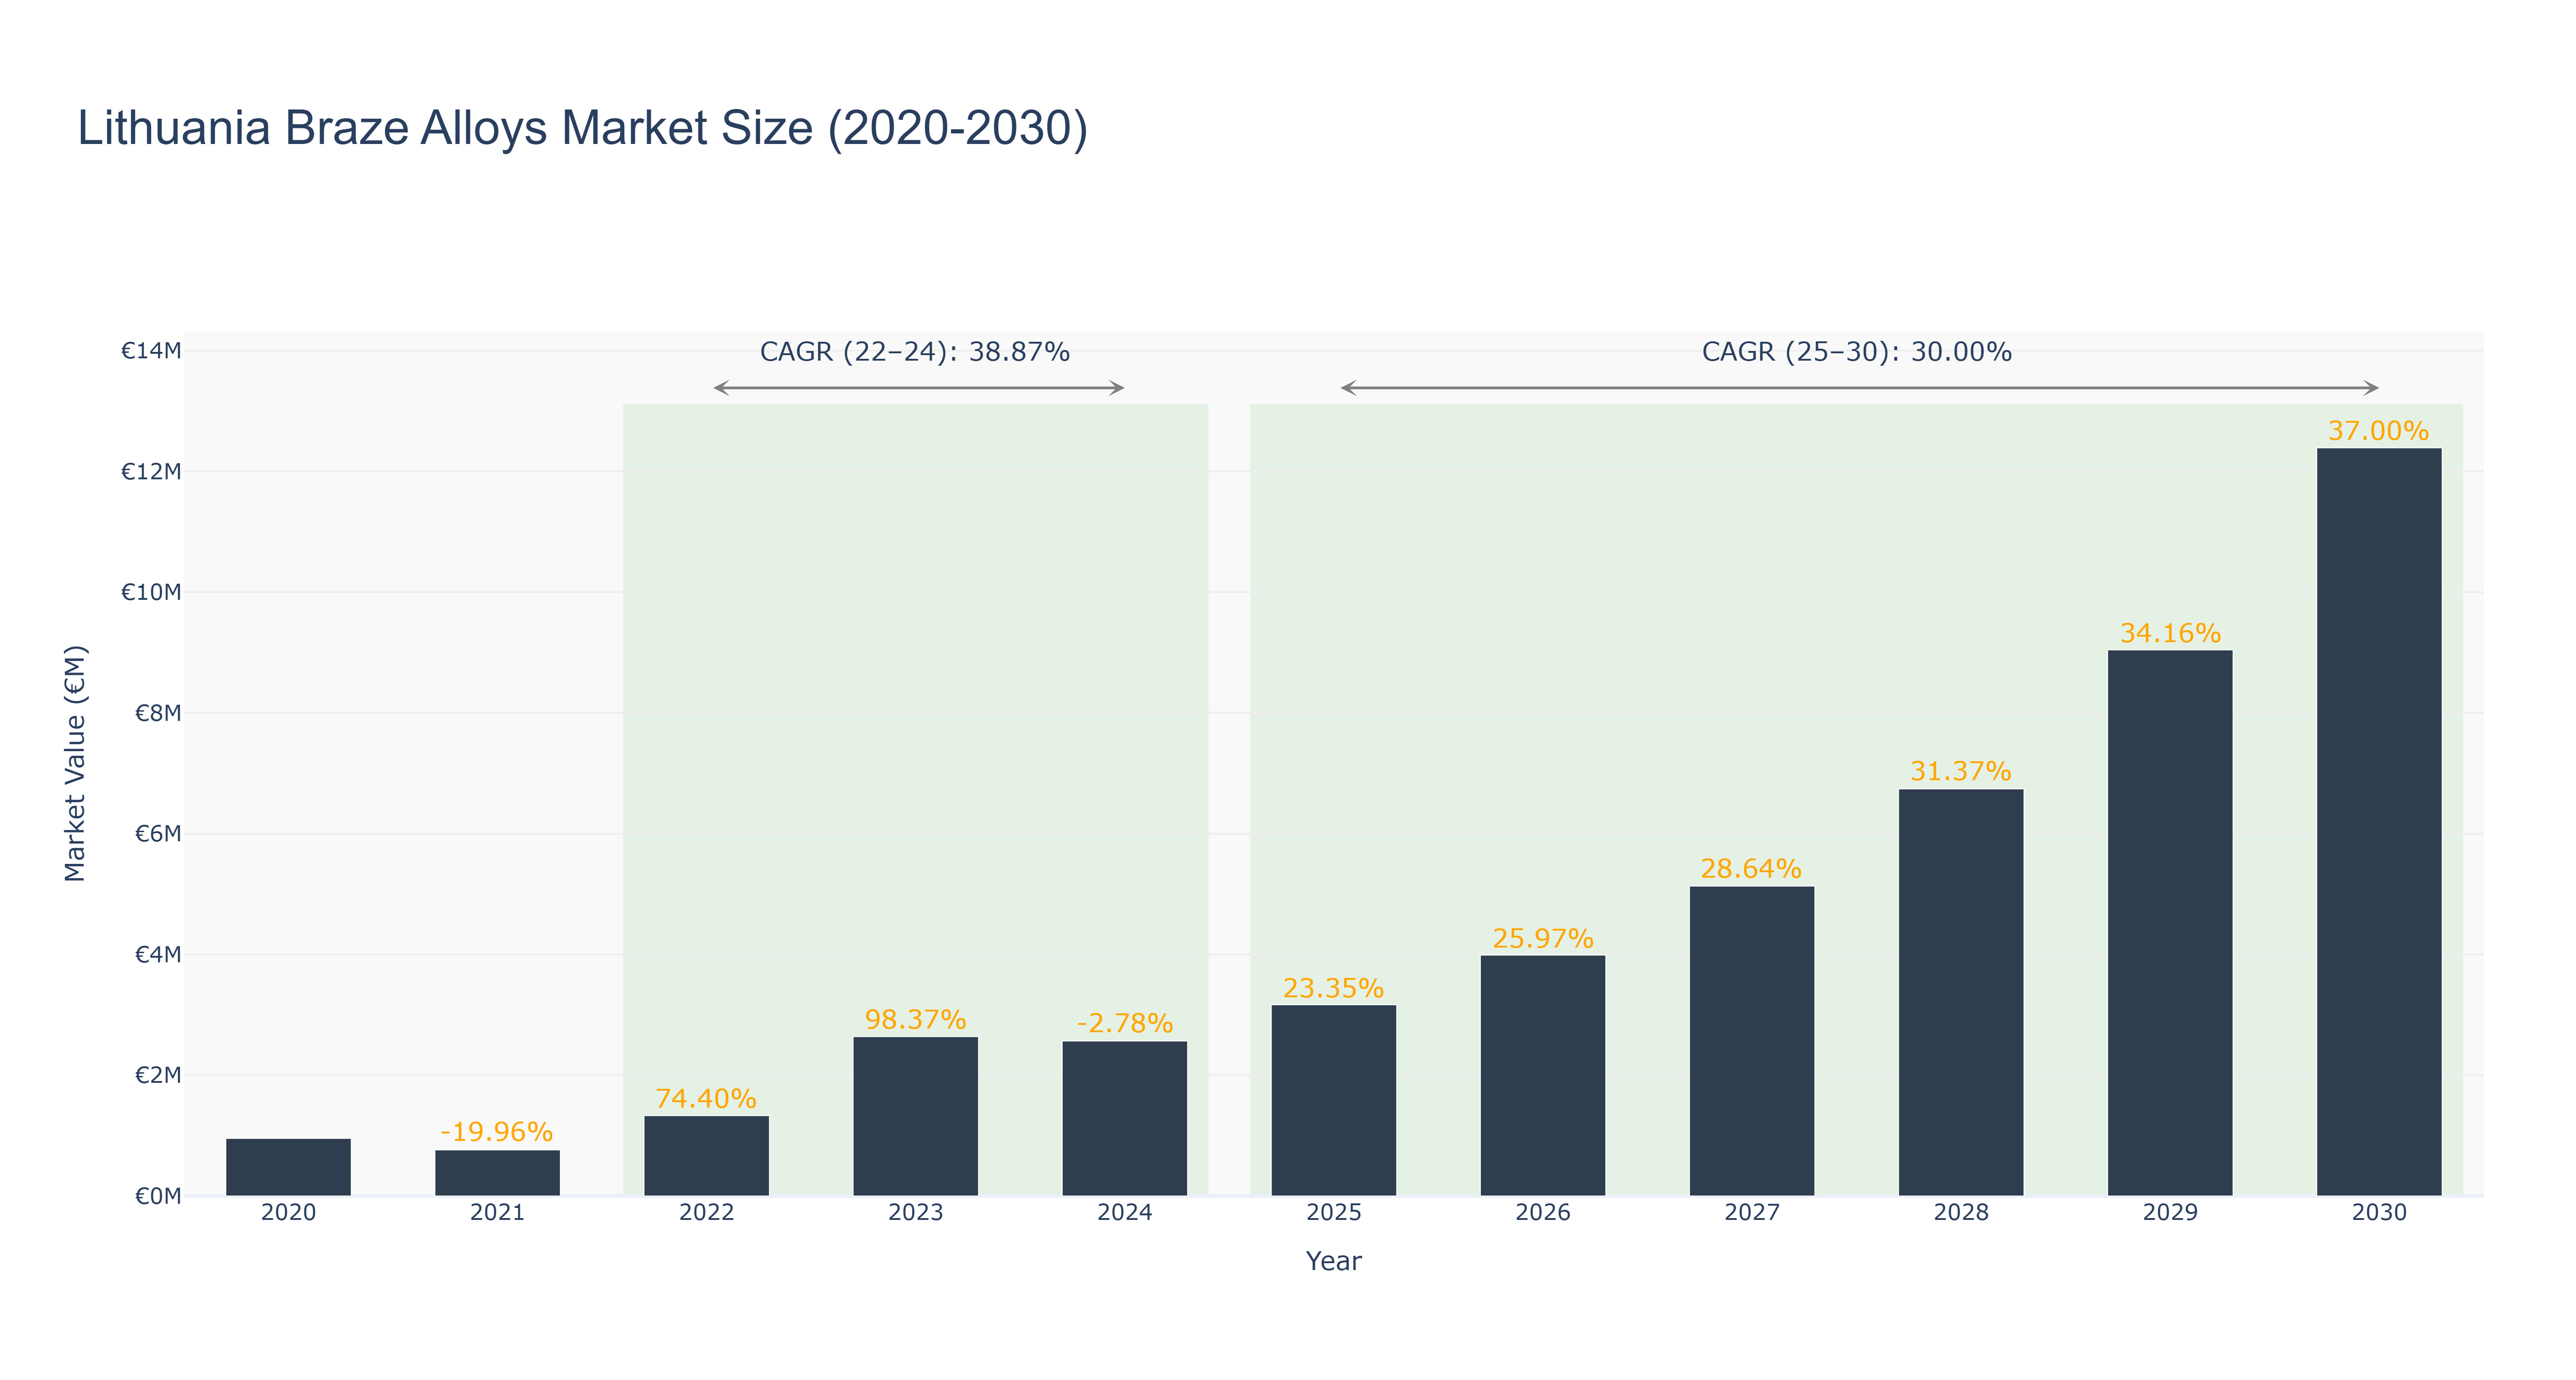
The Lithuania Braze Alloys Market has shown significant growth over the years. The peak market size of €12.39 million is forecasted for 2030, with a steady increase from €0.95 million in 2020 to €6.74 million in 2028. The market experienced a slight decline in 2024, but quickly recovered and continued to grow steadily. The CAGR for 2022-24 is 38.87%, indicating rapid expansion, while the CAGR for 2025-30 is expected to be 30.0%. The industry drivers behind this growth include increasing demand for braze alloys in manufacturing and construction sectors. Looking ahead, upcoming projects in Lithuania's manufacturing industry are set to further boost the demand for braze alloys, ensuring a positive trajectory for the market in the coming years.
Lithuania Braze Alloys Market: Production & Trade Performance (2019-2025)
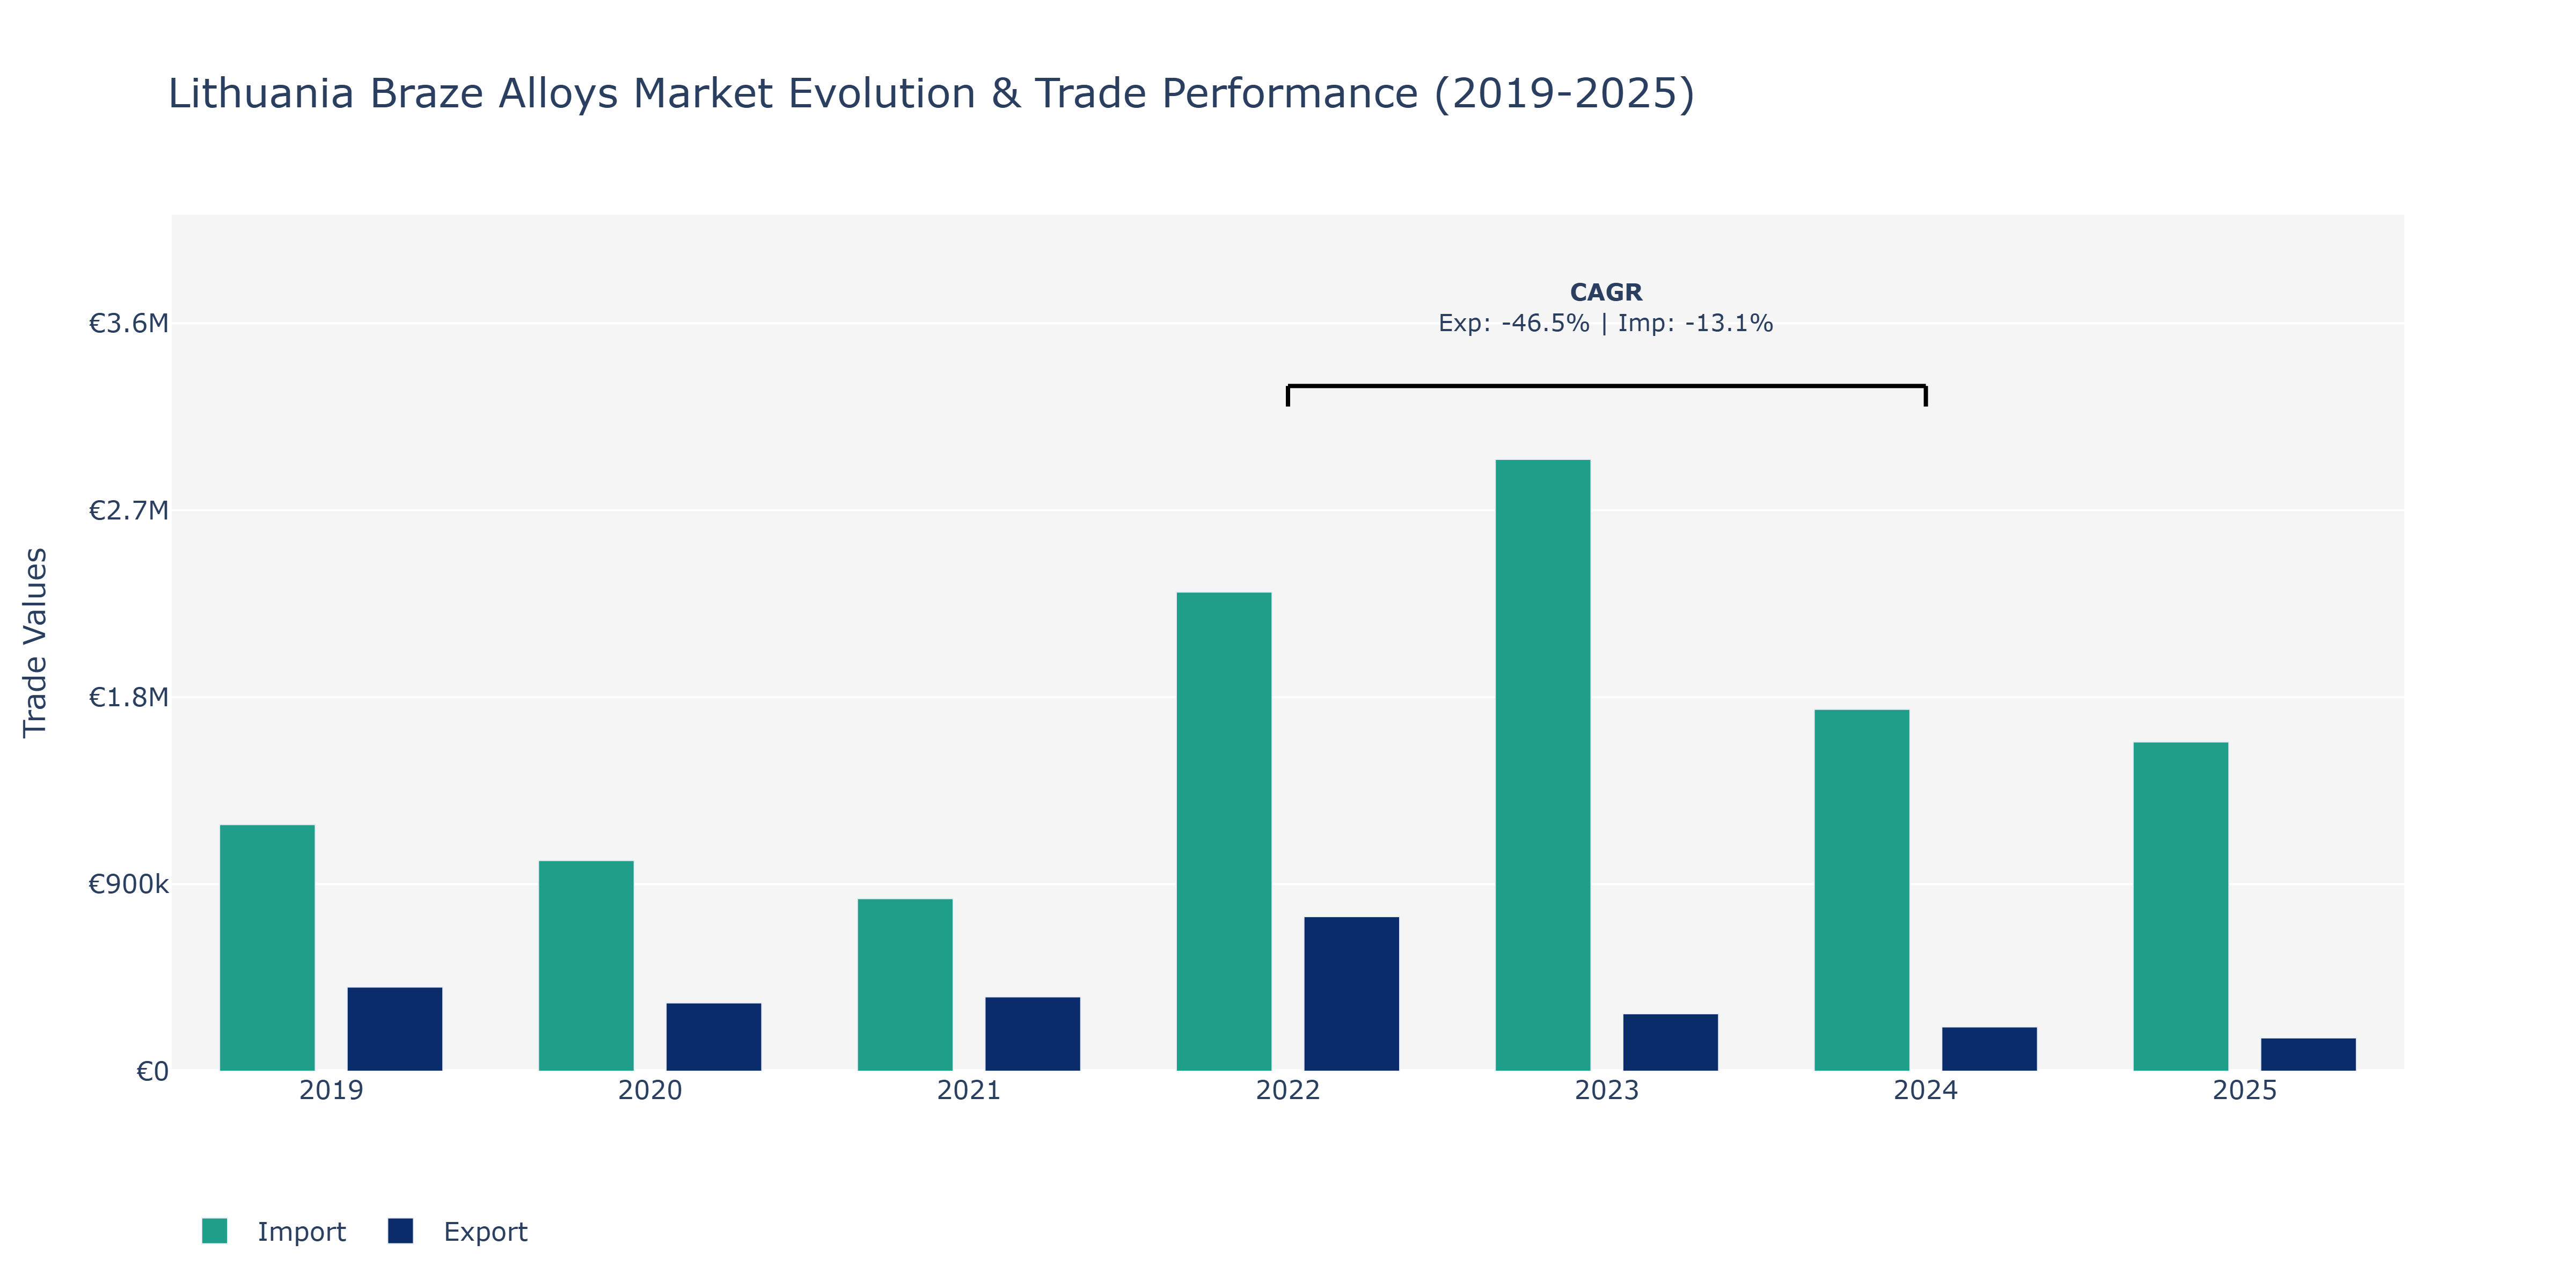
In the Lithuania Braze Alloys Market, exports displayed notable fluctuations over the years. Starting at €404.78 thousand in 2019, exports declined sharply in 2020 to €328.48 thousand before witnessing a significant surge in 2022, reaching €743.58 thousand. However, the trend reversed in the following years, dropping to €276.29 thousand in 2023 and further to €212.84 thousand in 2024. This decline could be attributed to various factors such as global economic conditions impacting demand for braze alloys, fluctuations in commodity prices, and evolving trade policies affecting market dynamics. Conversely, imports followed a similar pattern, starting at €1.19 million in 2019, decreasing to €830.43 thousand in 2021, then experiencing a peak in 2022 at €2.31 million before declining in the subsequent years. These fluctuations in imports could be influenced by shifts in domestic manufacturing trends, changes in sourcing strategies, and regulatory developments impacting international trade in braze alloys.
Key Highlights of the Report:
- Lithuania Braze Alloys Market Outlook
- Market Size of Lithuania Braze Alloys Market, 2025
- Forecast of Lithuania Braze Alloys Market, 2032
- Historical Data and Forecast of Lithuania Braze Alloys Revenues & Volume for the Period 2022 - 2032
- Lithuania Braze Alloys Market Trend Evolution
- Lithuania Braze Alloys Market Drivers and Challenges
- Lithuania Braze Alloys Price Trends
- Lithuania Braze Alloys Porter's Five Forces
- Lithuania Braze Alloys Industry Life Cycle
- Historical Data and Forecast of Lithuania Braze Alloys Market Revenues & Volume By Base Metal for the Period 2022 - 2032
- Historical Data and Forecast of Lithuania Braze Alloys Market Revenues & Volume By Primary for the Period 2022 - 2032
- Historical Data and Forecast of Lithuania Braze Alloys Market Revenues & Volume By Secondary for the Period 2022 - 2032
- Historical Data and Forecast of Lithuania Braze Alloys Market Revenues & Volume By Process for the Period 2022 - 2032
- Historical Data and Forecast of Lithuania Braze Alloys Market Revenues & Volume By Copper for the Period 2022 - 2032
- Historical Data and Forecast of Lithuania Braze Alloys Market Revenues & Volume By Gold for the Period 2022 - 2032
- Historical Data and Forecast of Lithuania Braze Alloys Market Revenues & Volume By Aluminum for the Period 2022 - 2032
- Historical Data and Forecast of Lithuania Braze Alloys Market Revenues & Volume By Silver for the Period 2022 - 2032
- Historical Data and Forecast of Lithuania Braze Alloys Market Revenues & Volume By Nickel for the Period 2022 - 2032
- Historical Data and Forecast of Lithuania Braze Alloys Market Revenues & Volume By Others for the Period 2022 - 2032
- Lithuania Braze Alloys Import Export Trade Statistics
- Market Opportunity Assessment By Base Metal
- Market Opportunity Assessment By Process
- Lithuania Braze Alloys Top Companies Market Share
- Lithuania Braze Alloys Competitive Benchmarking By Technical and Operational Parameters
- Lithuania Braze Alloys Company Profiles
- Lithuania Braze Alloys Key Strategic Recommendations
Frequently Asked Questions About the Market Study (FAQs):
6Wresearch actively monitors the Lithuania Braze Alloys Market and publishes its comprehensive annual report, highlighting emerging trends, growth drivers, revenue analysis, and forecast outlook. Our insights help businesses to make data-backed strategic decisions with ongoing market dynamics. Our analysts track relevent industries related to the Lithuania Braze Alloys Market, allowing our clients with actionable intelligence and reliable forecasts tailored to emerging regional needs.
Yes, we provide customisation as per your requirements. To learn more, feel free to contact us on sales@6wresearch.com
1 Executive Summary |
2 Introduction |
2.1 Key Highlights of the Report |
2.2 Report Description |
2.3 Market Scope & Segmentation |
2.4 Research Methodology |
2.5 Assumptions |
3 Lithuania Braze Alloys Market Overview |
3.1 Lithuania Country Macro Economic Indicators |
3.2 Lithuania Braze Alloys Market Revenues & Volume, 2022 & 2032F |
3.3 Lithuania Braze Alloys Market - Industry Life Cycle |
3.4 Lithuania Braze Alloys Market - Porter's Five Forces |
3.5 Lithuania Braze Alloys Market Revenues & Volume Share, By Base Metal, 2022 & 2032F |
3.6 Lithuania Braze Alloys Market Revenues & Volume Share, By Process, 2022 & 2032F |
4 Lithuania Braze Alloys Market Dynamics |
4.1 Impact Analysis |
4.2 Market Drivers |
4.2.1 Growing demand for braze alloys in the automotive and aerospace industries |
4.2.2 Increasing investments in infrastructure development that require brazing applications |
4.2.3 Technological advancements leading to the development of high-performance braze alloys |
4.3 Market Restraints |
4.3.1 Fluctuating raw material prices impacting production costs |
4.3.2 Intense competition from substitute materials like welding and soldering |
4.3.3 Stringent government regulations related to emissions and material usage in manufacturing processes |
5 Lithuania Braze Alloys Market Trends |
6 Lithuania Braze Alloys Market, By Types |
6.1 Lithuania Braze Alloys Market, By Base Metal |
6.1.1 Overview and Analysis |
6.1.2 Lithuania Braze Alloys Market Revenues & Volume, By Base Metal, 2022 - 2032F |
6.1.3 Lithuania Braze Alloys Market Revenues & Volume, By Primary, 2022 - 2032F |
6.1.4 Lithuania Braze Alloys Market Revenues & Volume, By Secondary, 2022 - 2032F |
6.2 Lithuania Braze Alloys Market, By Process |
6.2.1 Overview and Analysis |
6.2.2 Lithuania Braze Alloys Market Revenues & Volume, By Copper, 2022 - 2032F |
6.2.3 Lithuania Braze Alloys Market Revenues & Volume, By Gold, 2022 - 2032F |
6.2.4 Lithuania Braze Alloys Market Revenues & Volume, By Aluminum, 2022 - 2032F |
6.2.5 Lithuania Braze Alloys Market Revenues & Volume, By Silver, 2022 - 2032F |
6.2.6 Lithuania Braze Alloys Market Revenues & Volume, By Nickel, 2022 - 2032F |
6.2.7 Lithuania Braze Alloys Market Revenues & Volume, By Others, 2022 - 2032F |
7 Lithuania Braze Alloys Market Import-Export Trade Statistics |
7.1 Lithuania Braze Alloys Market Export to Major Countries |
7.2 Lithuania Braze Alloys Market Imports from Major Countries |
8 Lithuania Braze Alloys Market Key Performance Indicators |
8.1 Research and development investment in new braze alloy formulations |
8.2 Adoption rate of automated brazing processes in manufacturing |
8.3 Number of patents filed for innovative braze alloy technologies |
8.4 Percentage of repeat customers indicating product quality and customer satisfaction |
8.5 Rate of adoption of environmentally-friendly braze alloys and processes |
9 Lithuania Braze Alloys Market - Opportunity Assessment |
9.1 Lithuania Braze Alloys Market Opportunity Assessment, By Base Metal, 2022 & 2032F |
9.2 Lithuania Braze Alloys Market Opportunity Assessment, By Process, 2022 & 2032F |
10 Lithuania Braze Alloys Market - Competitive Landscape |
10.1 Lithuania Braze Alloys Market Revenue Share, By Companies, 2025 |
10.2 Lithuania Braze Alloys Market Competitive Benchmarking, By Operating and Technical Parameters |
11 Company Profiles |
12 Recommendations |
13 Disclaimer |
Global Go To Market Strategy - 2030
Export potential enables firms to identify high-growth global markets with greater confidence by combining advanced trade intelligence with a structured quantitative methodology. The framework analyzes emerging demand trends and country-level import patterns while integrating macroeconomic and trade datasets such as GDP and population forecasts, bilateral import–export flows, tariff structures, elasticity differentials between developed and developing economies, geographic distance, and import demand projections. Using weighted trade values from 2020–2024 as the base period to project country-to-country export potential for 2030, these inputs are operationalized through calculated drivers such as gravity model parameters, tariff impact factors, and projected GDP per-capita growth. Through an analysis of hidden potentials, demand hotspots, and market conditions that are most favorable to success, this method enables firms to focus on target countries, maximize returns, and global expansion with data, backed by accuracy.
By factoring in the projected importer demand gap that is currently unmet and could be potential opportunity, it identifies the potential for the Exporter (Country) among 190 countries, against the general trade analysis, which identifies the biggest importer or exporter.
To discover high-growth global markets and optimize your business strategy:
Click Here
Pricing
- Single User License$ 1,995
- Department License$ 2,400
- Site License$ 3,120
- Global License$ 3,795

Leadership Perspectives from Industry Events
Search
Thought Leadership and Analyst Meet


Our Clients
6WResearch In News
- Doha a strategic location for EV manufacturing hub: IPA Qatar
- Demand for luxury TVs surging in the GCC, says Samsung
- Empowering Growth: The Thriving Journey of Bangladesh’s Cable Industry
- Demand for luxury TVs surging in the GCC, says Samsung
- Video call with a traditional healer? Once unthinkable, it’s now common in South Africa
- Intelligent Buildings To Smooth GCC’s Path To Net Zero
Latest Reports
- Taiwan Airport Wireless Infrastructure Market (2026-2032)
- Vietnam Airport Wireless Infrastructure Market (2026-2032)
- Thailand Airport Wireless Infrastructure Market (2026-2032)
- South Korea Airport Wireless Infrastructure Market (2026-2032)
- Romania Airport Wireless Infrastructure Market (2026-2032)
- Qatar Airport Wireless Infrastructure Market (2026-2032)
- Philippines Airport Wireless Infrastructure Market (2026-2032)
- Japan Airport Wireless Infrastructure Market (2026-2032)
- Taiwan Airport Winter Services Market (2026-2032)
- Vietnam Airport Winter Services Market (2026-2032)
Industry Events and Analyst Meet

HIMTEX 2026

India Refining Summit 2026

India EV Show 2026

EV tech India Expo 2026

Auto Tech Asia 2026
Whitepaper
- Middle East & Africa Commercial Security Market Click here to view more.
- Middle East & Africa Fire Safety Systems & Equipment Market Click here to view more.
- GCC Drone Market Click here to view more.
- Middle East Lighting Fixture Market Click here to view more.
- GCC Physical & Perimeter Security Market Click here to view more.