Lithuania Carbon Brush Market (2026-2032) | Value, Outlook, Industry, Companies, Size, Trends, Segmentation, Share, Revenue, Forecast, Growth & Analysis
Market Forecast By Type (Graphite, Carbon Fiber, Electro Graphite, Metal Graphite, Others), By Industry (Industrial, Automotive, Household, Electrical, Others), By Application (Motors, Generators/Alternators, Grounding Devices, Signal & Power Transmission, Others) And Competitive Landscape
| Product Code: ETC5111648 | Publication Date: Nov 2023 | Updated Date: Apr 2026 | Product Type: Market Research Report | |
| Publisher: 6Wresearch | Author: Shubham Padhi | No. of Pages: 60 | No. of Figures: 30 | No. of Tables: 5 |
Lithuania Carbon Brush Market Size (2020-2030)
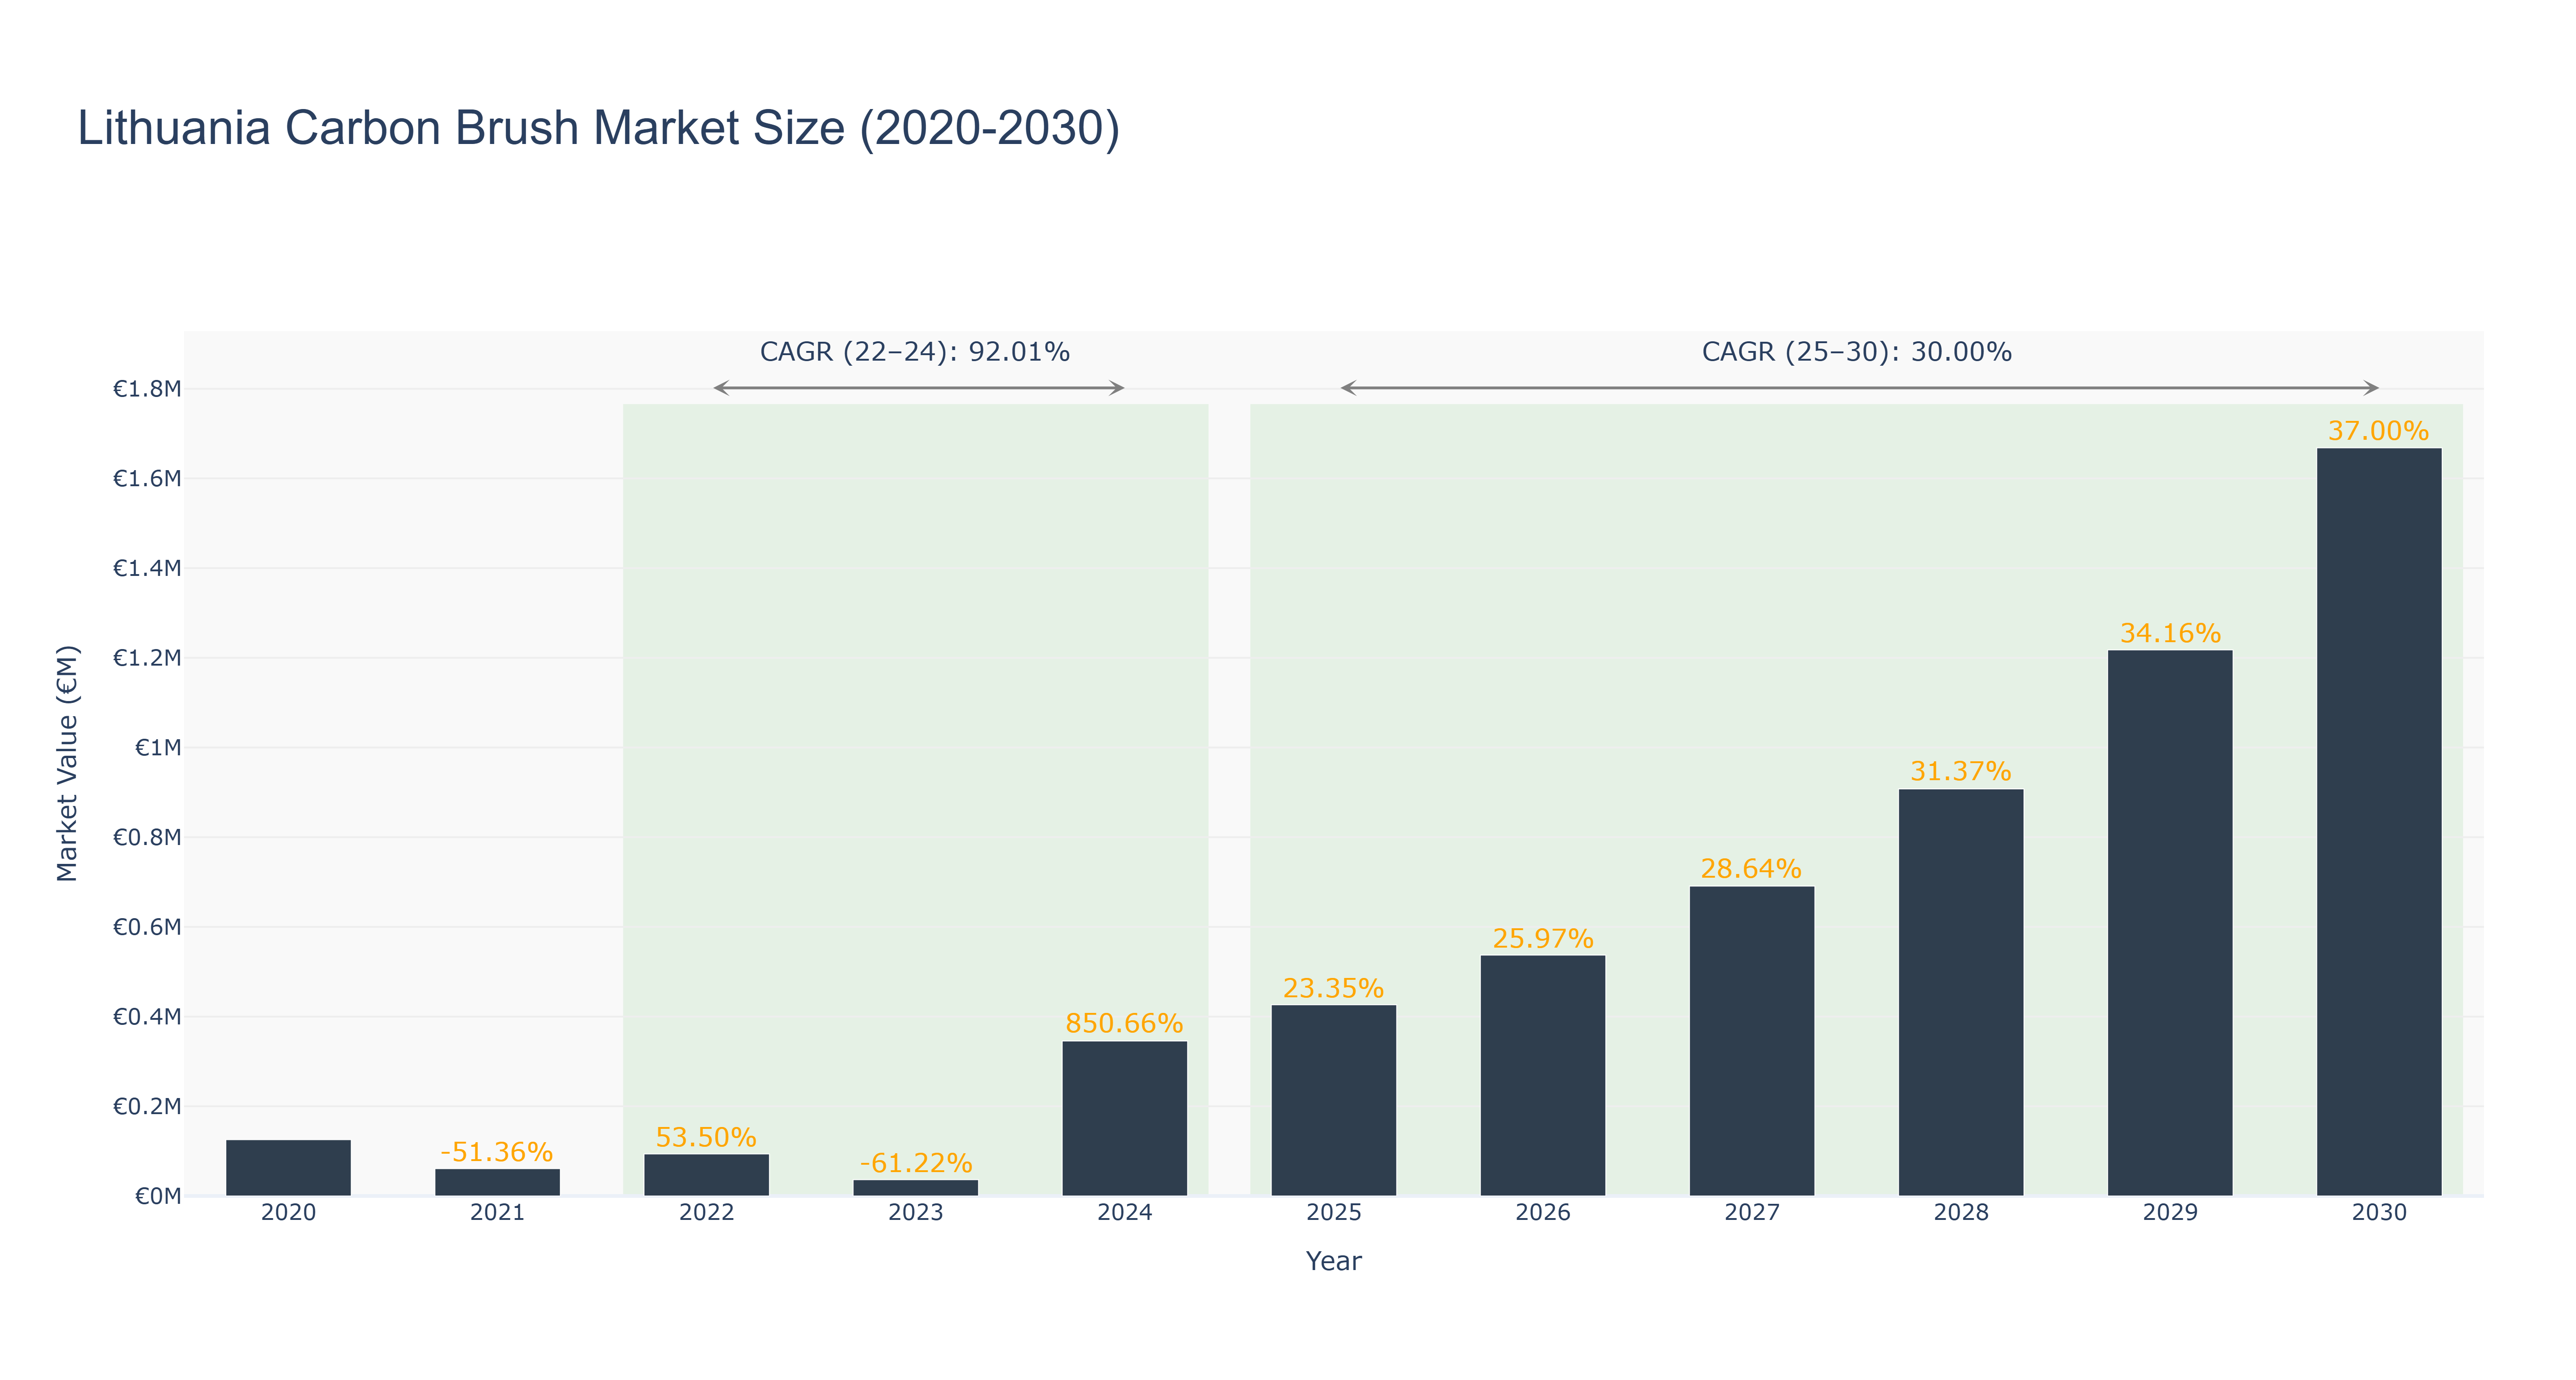
The Lithuania Carbon Brush Market has exhibited considerable volatility in recent years, with the peak market size recorded in 2020 at €125.56 thousand, followed by a significant decline in 2021 to €61.08 thousand, reflecting a staggering growth rate of -51.36%. However, the market rebounded in 2022, reaching €93.75 thousand, and is projected to witness remarkable growth, culminating in a peak of €345.65 thousand in 2024, driven by increasing industrial applications and a shift towards sustainable technologies, resulting in a CAGR of 92.01% from 2022 to 2024. Looking ahead, the forecasted period from 2025 to 2030 indicates a more stable growth trajectory, with market size expected to reach €1.67 million by 2030, reflecting a CAGR of 30.00%. This growth is likely fueled by ongoing investments in renewable energy sectors and advancements in electric vehicle technologies, positioning Lithuania as a key player in the carbon brush industry.
Lithuania Carbon Brush Market: Production & Trade Performance (2019-2025)
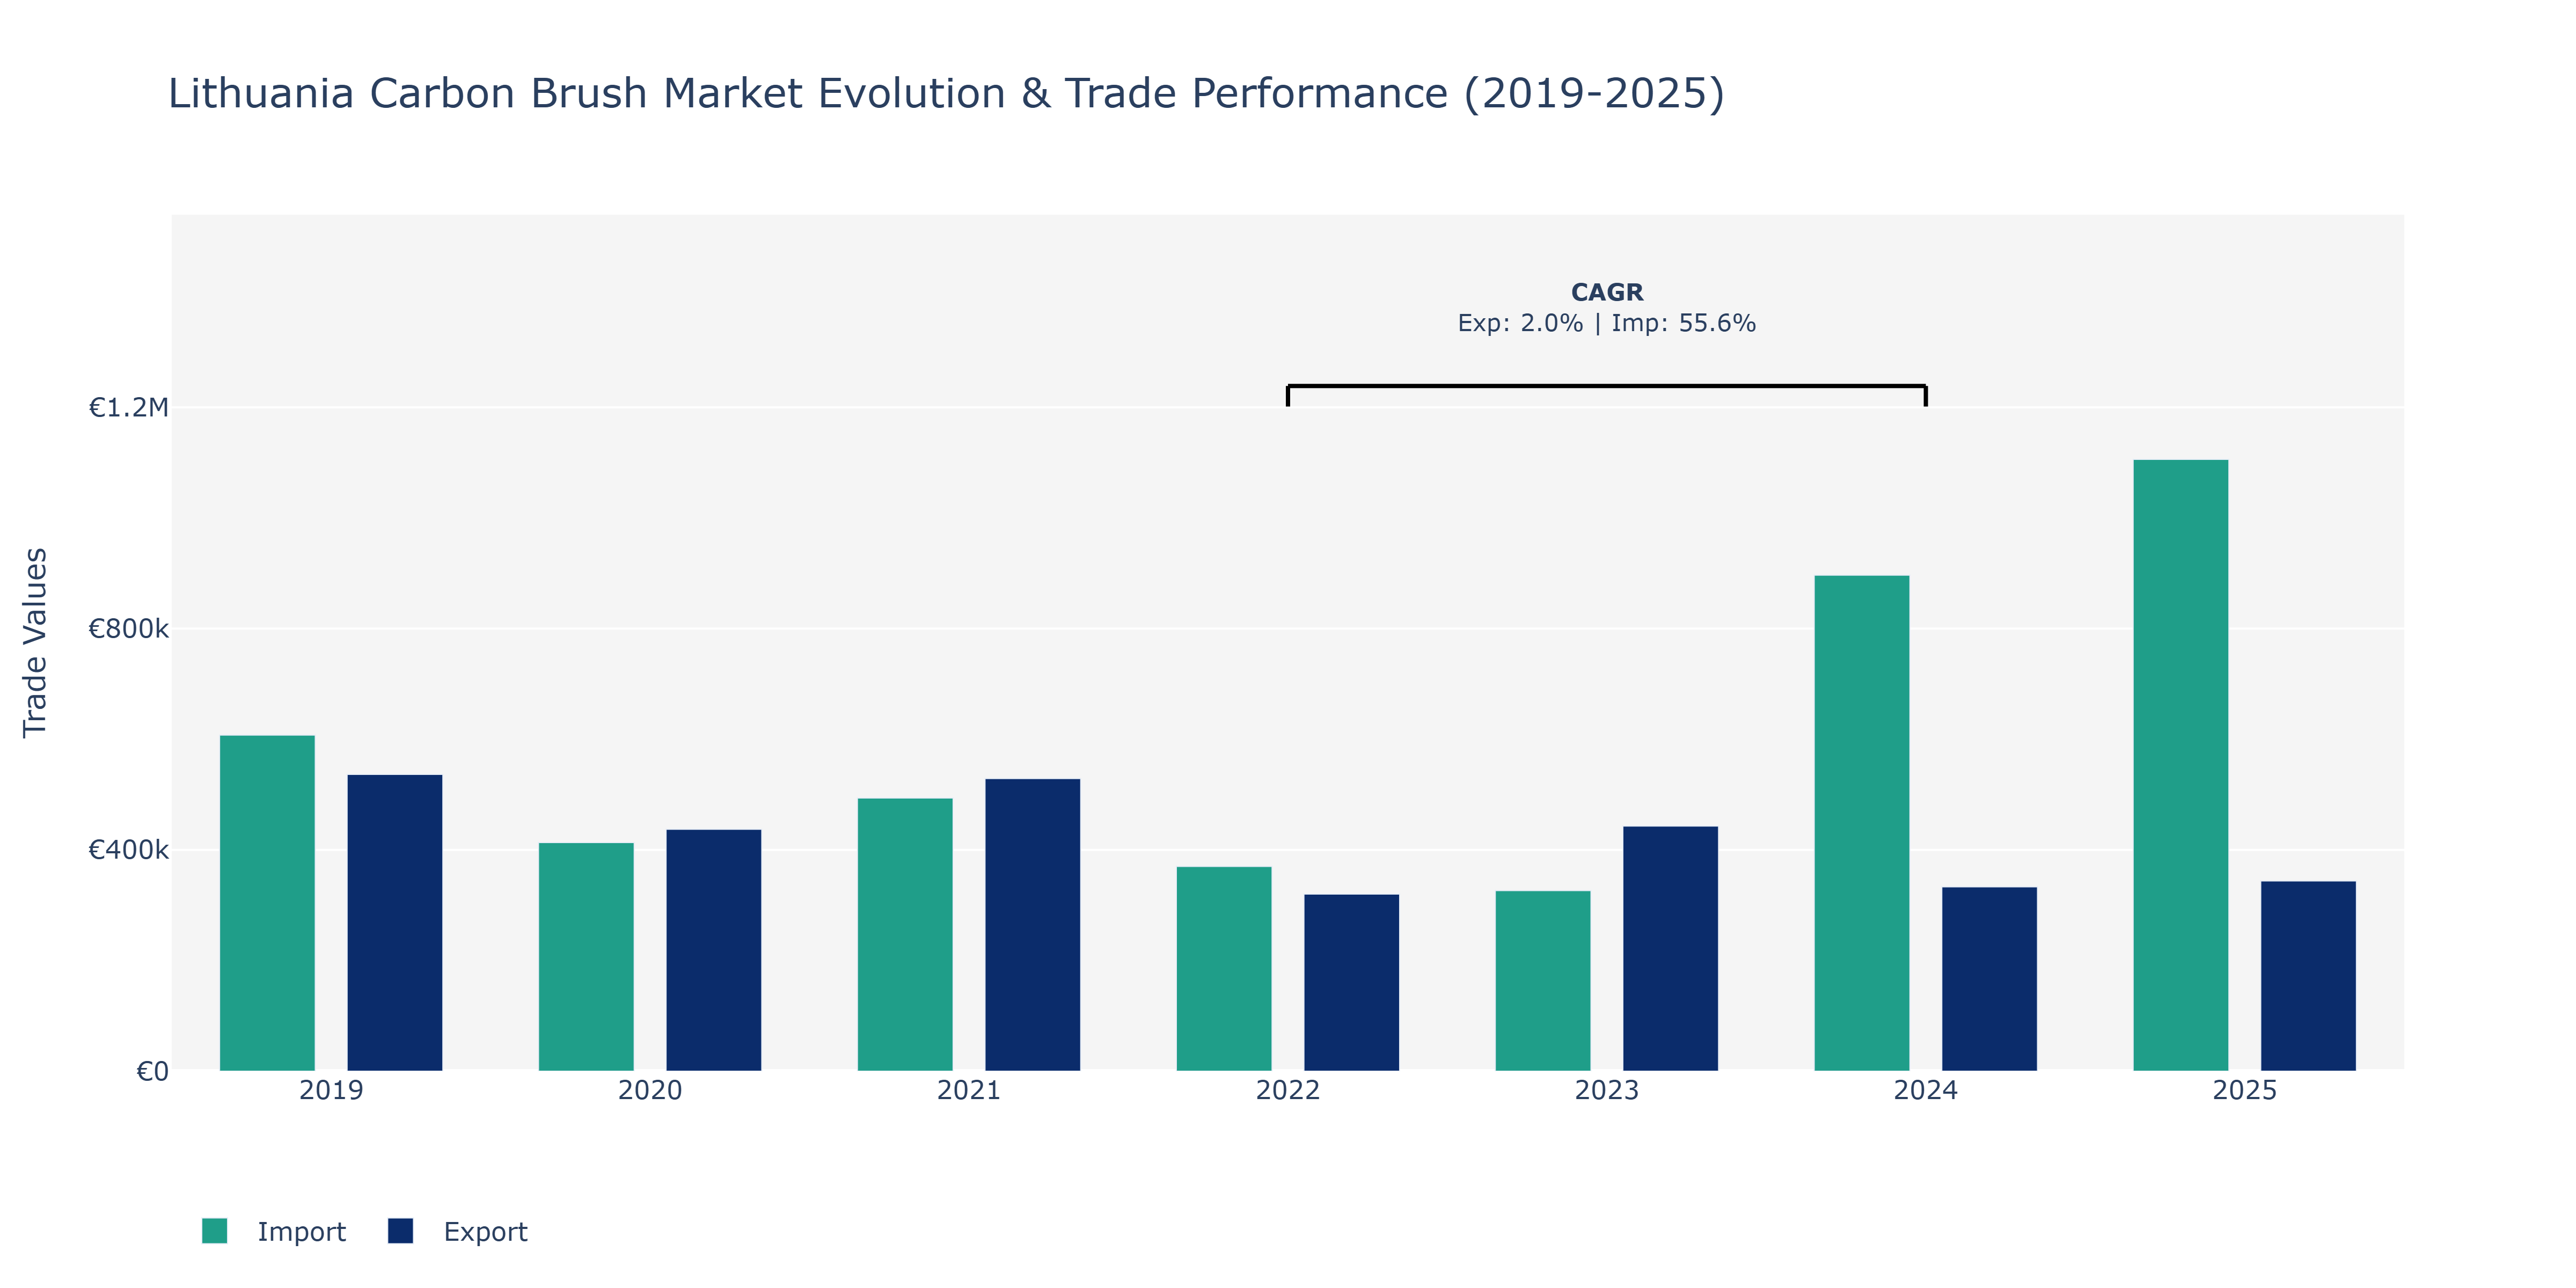
The Lithuania Carbon Brush Market witnessed fluctuations in both Exports and Imports over the years. Exports started at €536.49 thousand in 2019, experienced a decline in 2020 to €437.21 thousand, then surged in 2021 to €528.97 thousand before dropping to €320.20 thousand in 2022. This drop was followed by a recovery in 2023 to €442.98 thousand but fell again to €333.27 thousand in 2024. Conversely, Imports began at €607.49 thousand in 2019, decreased slightly in 2020 to €413.2 thousand, rose marginally in 2021 to €493.74 thousand, then hit a peak in 2025 at €1.11 million. The substantial increase in imports in 2025 could be attributed to growing demand for carbon brushes in various industries due to technological advancements driving the need for efficient electrical equipment and machinery in Lithuania. The fluctuating trends may also reflect changes in international trade policies and economic conditions affecting the carbon brush market.
Key Highlights of the Report:
- Lithuania Carbon Brush Market Outlook
- Market Size of Lithuania Carbon Brush Market, 2025
- Forecast of Lithuania Carbon Brush Market, 2032
- Historical Data and Forecast of Lithuania Carbon Brush Revenues & Volume for the Period 2022 - 2032F
- Lithuania Carbon Brush Market Trend Evolution
- Lithuania Carbon Brush Market Drivers and Challenges
- Lithuania Carbon Brush Price Trends
- Lithuania Carbon Brush Porter`s Five Forces
- Lithuania Carbon Brush Industry Life Cycle
- Historical Data and Forecast of Lithuania Carbon Brush Market Revenues & Volume By Type for the Period 2022 - 2032F
- Historical Data and Forecast of Lithuania Carbon Brush Market Revenues & Volume By Graphite for the Period 2022 - 2032F
- Historical Data and Forecast of Lithuania Carbon Brush Market Revenues & Volume By Carbon Fiber for the Period 2022 - 2032F
- Historical Data and Forecast of Lithuania Carbon Brush Market Revenues & Volume By Electro Graphite for the Period 2022 - 2032F
- Historical Data and Forecast of Lithuania Carbon Brush Market Revenues & Volume By Metal Graphite for the Period 2022 - 2032F
- Historical Data and Forecast of Lithuania Carbon Brush Market Revenues & Volume By Others for the Period 2022 - 2032F
- Historical Data and Forecast of Lithuania Carbon Brush Market Revenues & Volume By Industry for the Period 2022 - 2032F
- Historical Data and Forecast of Lithuania Carbon Brush Market Revenues & Volume By Industrial for the Period 2022 - 2032F
- Historical Data and Forecast of Lithuania Carbon Brush Market Revenues & Volume By Automotive for the Period 2022 - 2032F
- Historical Data and Forecast of Lithuania Carbon Brush Market Revenues & Volume By Household for the Period 2022 - 2032F
- Historical Data and Forecast of Lithuania Carbon Brush Market Revenues & Volume By Electrical for the Period 2022 - 2032F
- Historical Data and Forecast of Lithuania Carbon Brush Market Revenues & Volume By Others for the Period 2022 - 2032F
- Historical Data and Forecast of Lithuania Carbon Brush Market Revenues & Volume By Application for the Period 2022 - 2032F
- Historical Data and Forecast of Lithuania Carbon Brush Market Revenues & Volume By Motors for the Period 2022 - 2032F
- Historical Data and Forecast of Lithuania Carbon Brush Market Revenues & Volume By Generators/Alternators for the Period 2022 - 2032F
- Historical Data and Forecast of Lithuania Carbon Brush Market Revenues & Volume By Grounding Devices for the Period 2022 - 2032F
- Historical Data and Forecast of Lithuania Carbon Brush Market Revenues & Volume By Signal & Power Transmission for the Period 2022 - 2032F
- Historical Data and Forecast of Lithuania Carbon Brush Market Revenues & Volume By Others for the Period 2022 - 2032F
- Lithuania Carbon Brush Import Export Trade Statistics
- Market Opportunity Assessment By Type
- Market Opportunity Assessment By Industry
- Market Opportunity Assessment By Application
- Lithuania Carbon Brush Top Companies Market Share
- Lithuania Carbon Brush Competitive Benchmarking By Technical and Operational Parameters
- Lithuania Carbon Brush Company Profiles
- Lithuania Carbon Brush Key Strategic Recommendations
Frequently Asked Questions About the Market Study (FAQs):
6Wresearch actively monitors the Lithuania Carbon Brush Market and publishes its comprehensive annual report, highlighting emerging trends, growth drivers, revenue analysis, and forecast outlook. Our insights help businesses to make data-backed strategic decisions with ongoing market dynamics. Our analysts track relevent industries related to the Lithuania Carbon Brush Market, allowing our clients with actionable intelligence and reliable forecasts tailored to emerging regional needs.
Yes, we provide customisation as per your requirements. To learn more, feel free to contact us on sales@6wresearch.com
1 Executive Summary |
2 Introduction |
2.1 Key Highlights of the Report |
2.2 Report Description |
2.3 Market Scope & Segmentation |
2.4 Research Methodology |
2.5 Assumptions |
3 Lithuania Carbon Brush Market Overview |
3.1 Lithuania Country Macro Economic Indicators |
3.2 Lithuania Carbon Brush Market Revenues & Volume, 2022 & 2032F |
3.3 Lithuania Carbon Brush Market - Industry Life Cycle |
3.4 Lithuania Carbon Brush Market - Porter's Five Forces |
3.5 Lithuania Carbon Brush Market Revenues & Volume Share, By Type, 2022 & 2032F |
3.6 Lithuania Carbon Brush Market Revenues & Volume Share, By Industry, 2022 & 2032F |
3.7 Lithuania Carbon Brush Market Revenues & Volume Share, By Application, 2022 & 2032F |
4 Lithuania Carbon Brush Market Dynamics |
4.1 Impact Analysis |
4.2 Market Drivers |
4.2.1 Increasing demand for carbon brushes in industries such as automotive, aerospace, and electronics |
4.2.2 Growing focus on energy efficiency and sustainability, driving the adoption of carbon brushes |
4.2.3 Technological advancements leading to the development of high-performance carbon brushes |
4.3 Market Restraints |
4.3.1 Fluctuating raw material prices impacting the cost of production |
4.3.2 Competition from alternative technologies like graphite brushes affecting market growth |
4.3.3 Economic uncertainties affecting investment in industrial equipment and machinery |
5 Lithuania Carbon Brush Market Trends |
6 Lithuania Carbon Brush Market Segmentations |
6.1 Lithuania Carbon Brush Market, By Type |
6.1.1 Overview and Analysis |
6.1.2 Lithuania Carbon Brush Market Revenues & Volume, By Graphite, 2022 - 2032F |
6.1.3 Lithuania Carbon Brush Market Revenues & Volume, By Carbon Fiber, 2022 - 2032F |
6.1.4 Lithuania Carbon Brush Market Revenues & Volume, By Electro Graphite, 2022 - 2032F |
6.1.5 Lithuania Carbon Brush Market Revenues & Volume, By Metal Graphite, 2022 - 2032F |
6.1.6 Lithuania Carbon Brush Market Revenues & Volume, By Others, 2022 - 2032F |
6.2 Lithuania Carbon Brush Market, By Industry |
6.2.1 Overview and Analysis |
6.2.2 Lithuania Carbon Brush Market Revenues & Volume, By Industrial, 2022 - 2032F |
6.2.3 Lithuania Carbon Brush Market Revenues & Volume, By Automotive, 2022 - 2032F |
6.2.4 Lithuania Carbon Brush Market Revenues & Volume, By Household, 2022 - 2032F |
6.2.5 Lithuania Carbon Brush Market Revenues & Volume, By Electrical, 2022 - 2032F |
6.2.6 Lithuania Carbon Brush Market Revenues & Volume, By Others, 2022 - 2032F |
6.3 Lithuania Carbon Brush Market, By Application |
6.3.1 Overview and Analysis |
6.3.2 Lithuania Carbon Brush Market Revenues & Volume, By Motors, 2022 - 2032F |
6.3.3 Lithuania Carbon Brush Market Revenues & Volume, By Generators/Alternators, 2022 - 2032F |
6.3.4 Lithuania Carbon Brush Market Revenues & Volume, By Grounding Devices, 2022 - 2032F |
6.3.5 Lithuania Carbon Brush Market Revenues & Volume, By Signal & Power Transmission, 2022 - 2032F |
6.3.6 Lithuania Carbon Brush Market Revenues & Volume, By Others, 2022 - 2032F |
7 Lithuania Carbon Brush Market Import-Export Trade Statistics |
7.1 Lithuania Carbon Brush Market Export to Major Countries |
7.2 Lithuania Carbon Brush Market Imports from Major Countries |
8 Lithuania Carbon Brush Market Key Performance Indicators |
8.1 Average selling price of carbon brushes |
8.2 Number of patents filed for carbon brush technologies |
8.3 Adoption rate of carbon brushes in key industries |
8.4 Investment in research and development for carbon brush innovation |
8.5 Environmental regulations compliance rate for carbon brush manufacturers |
9 Lithuania Carbon Brush Market - Opportunity Assessment |
9.1 Lithuania Carbon Brush Market Opportunity Assessment, By Type, 2022 & 2032F |
9.2 Lithuania Carbon Brush Market Opportunity Assessment, By Industry, 2022 & 2032F |
9.3 Lithuania Carbon Brush Market Opportunity Assessment, By Application, 2022 & 2032F |
10 Lithuania Carbon Brush Market - Competitive Landscape |
10.1 Lithuania Carbon Brush Market Revenue Share, By Companies, 2025 |
10.2 Lithuania Carbon Brush Market Competitive Benchmarking, By Operating and Technical Parameters |
11 Company Profiles |
12 Recommendations | 13 Disclaimer |
Export potential assessment - trade Analytics for 2030
Export potential enables firms to identify high-growth global markets with greater confidence by combining advanced trade intelligence with a structured quantitative methodology. The framework analyzes emerging demand trends and country-level import patterns while integrating macroeconomic and trade datasets such as GDP and population forecasts, bilateral import–export flows, tariff structures, elasticity differentials between developed and developing economies, geographic distance, and import demand projections. Using weighted trade values from 2020–2024 as the base period to project country-to-country export potential for 2030, these inputs are operationalized through calculated drivers such as gravity model parameters, tariff impact factors, and projected GDP per-capita growth. Through an analysis of hidden potentials, demand hotspots, and market conditions that are most favorable to success, this method enables firms to focus on target countries, maximize returns, and global expansion with data, backed by accuracy.
By factoring in the projected importer demand gap that is currently unmet and could be potential opportunity, it identifies the potential for the Exporter (Country) among 190 countries, against the general trade analysis, which identifies the biggest importer or exporter.
To discover high-growth global markets and optimize your business strategy:
Click Here
Pricing
- Single User License$ 1,995
- Department License$ 2,400
- Site License$ 3,120
- Global License$ 3,795

Search
Thought Leadership and Analyst Meet


Our Clients
Latest Reports
- China Electric Appliance Rental Market (2026-2032) | Trends, Revenue, Growth, Challenges, Size, Value, Outlook, Pricing, Strategy, Insights, Restraints, segmentation, Companies, Investment Opportunities, Analysis, Demand, Drivers, Competition, Forecast, Share
- Chile Electric Appliance Rental Market (2026-2032) | Outlook, Competition, Drivers, Strategy, Revenue, Analysis, Value, Pricing, Restraints, Size, Demand, Share, Growth, Forecast, Challenges, Insights, Investment Opportunities, Companies, Trends, segmentation
- Cambodia Electric Appliance Rental Market (2026-2032) | Companies, Analysis, Restraints, Pricing, Insights, Challenges, Outlook, Strategy, Forecast, Trends, Competition, Value, Revenue, Investment Opportunities, segmentation, Drivers, Size, Demand, Growth, Share
- Brazil Electric Appliance Rental Market (2026-2032) | Revenue, Strategy, Forecast, Companies, segmentation, Competition, Size, Investment Opportunities, Pricing, Restraints, Outlook, Challenges, Analysis, Drivers, Value, Demand, Insights, Trends, Growth, Share
- Bangladesh Electric Appliance Rental Market (2026-2032) | Drivers, Forecast, Investment Opportunities, Strategy, Insights, Demand, Challenges, Outlook, Trends, Competition, Value, Revenue, Size, Pricing, Analysis, Companies, Restraints, segmentation, Share, Growth
- Bahrain Electric Appliance Rental Market (2026-2032) | Outlook, Size, Competition, Restraints, Drivers, Value, Trends, Investment Opportunities, Insights, Forecast, Revenue, Strategy, Growth, Share, Demand, Analysis, Challenges, Companies, segmentation, Pricing
- Azerbaijan Electric Appliance Rental Market (2026-2032) | Trends, Investment Opportunities, Restraints, Insights, Strategy, Competition, Value, Growth, Demand, Drivers, Analysis, Forecast, Size, Share, Outlook, segmentation, Pricing, Challenges, Revenue, Companies
- Australia Electric Appliance Rental Market (2026-2032) | Challenges, Restraints, Forecast, Demand, Size, Competition, Pricing, Investment Opportunities, Revenue, Trends, Drivers, Growth, Outlook, Analysis, Strategy, Value, segmentation, Insights, Companies, Share
- Argentina Electric Appliance Rental Market (2026-2032) | Growth, Trends, Insights, Outlook, Forecast, Size, Drivers, Analysis, Restraints, Challenges, Share, Revenue, Investment Opportunities, Strategy, Demand, Value, Companies, segmentation, Competition, Pricing
- Algeria Electric Appliance Rental Market (2026-2032) | Share, Size, Value, Strategy, Competition, Outlook, Challenges, Companies, Trends, Pricing, Insights, Forecast, Investment Opportunities, Revenue, Growth, Restraints, segmentation, Analysis, Demand, Drivers
Industry Events and Analyst Meet

HIMTEX 2026

India Refining Summit 2026

India EV Show 2026

EV tech India Expo 2026

Auto Tech Asia 2026
Whitepaper
- Middle East & Africa Commercial Security Market Click here to view more.
- Middle East & Africa Fire Safety Systems & Equipment Market Click here to view more.
- GCC Drone Market Click here to view more.
- Middle East Lighting Fixture Market Click here to view more.
- GCC Physical & Perimeter Security Market Click here to view more.
6WResearch In News
- Doha a strategic location for EV manufacturing hub: IPA Qatar
- Demand for luxury TVs surging in the GCC, says Samsung
- Empowering Growth: The Thriving Journey of Bangladesh’s Cable Industry
- Demand for luxury TVs surging in the GCC, says Samsung
- Video call with a traditional healer? Once unthinkable, it’s now common in South Africa
- Intelligent Buildings To Smooth GCC’s Path To Net Zero