Lithuania Catalysts Market (2026-2032) | Revenue, Share, Size, Analysis, Forecast, Outlook, Segmentation, Industry, Growth, Value, Trends & Companies
Market Forecast By Raw Material (Chemical compounds, Metals, Zeolites, Others), By Application (Heterogeneous Catalyst, Homogeneous Catalyst) And Competitive Landscape
| Product Code: ETC4812531 | Publication Date: Nov 2023 | Updated Date: Apr 2026 | Product Type: Market Research Report | |
| Publisher: 6Wresearch | Author: Shubham Padhi | No. of Pages: 60 | No. of Figures: 30 | No. of Tables: 5 |
Lithuania Catalysts Market Size (2020-2030)
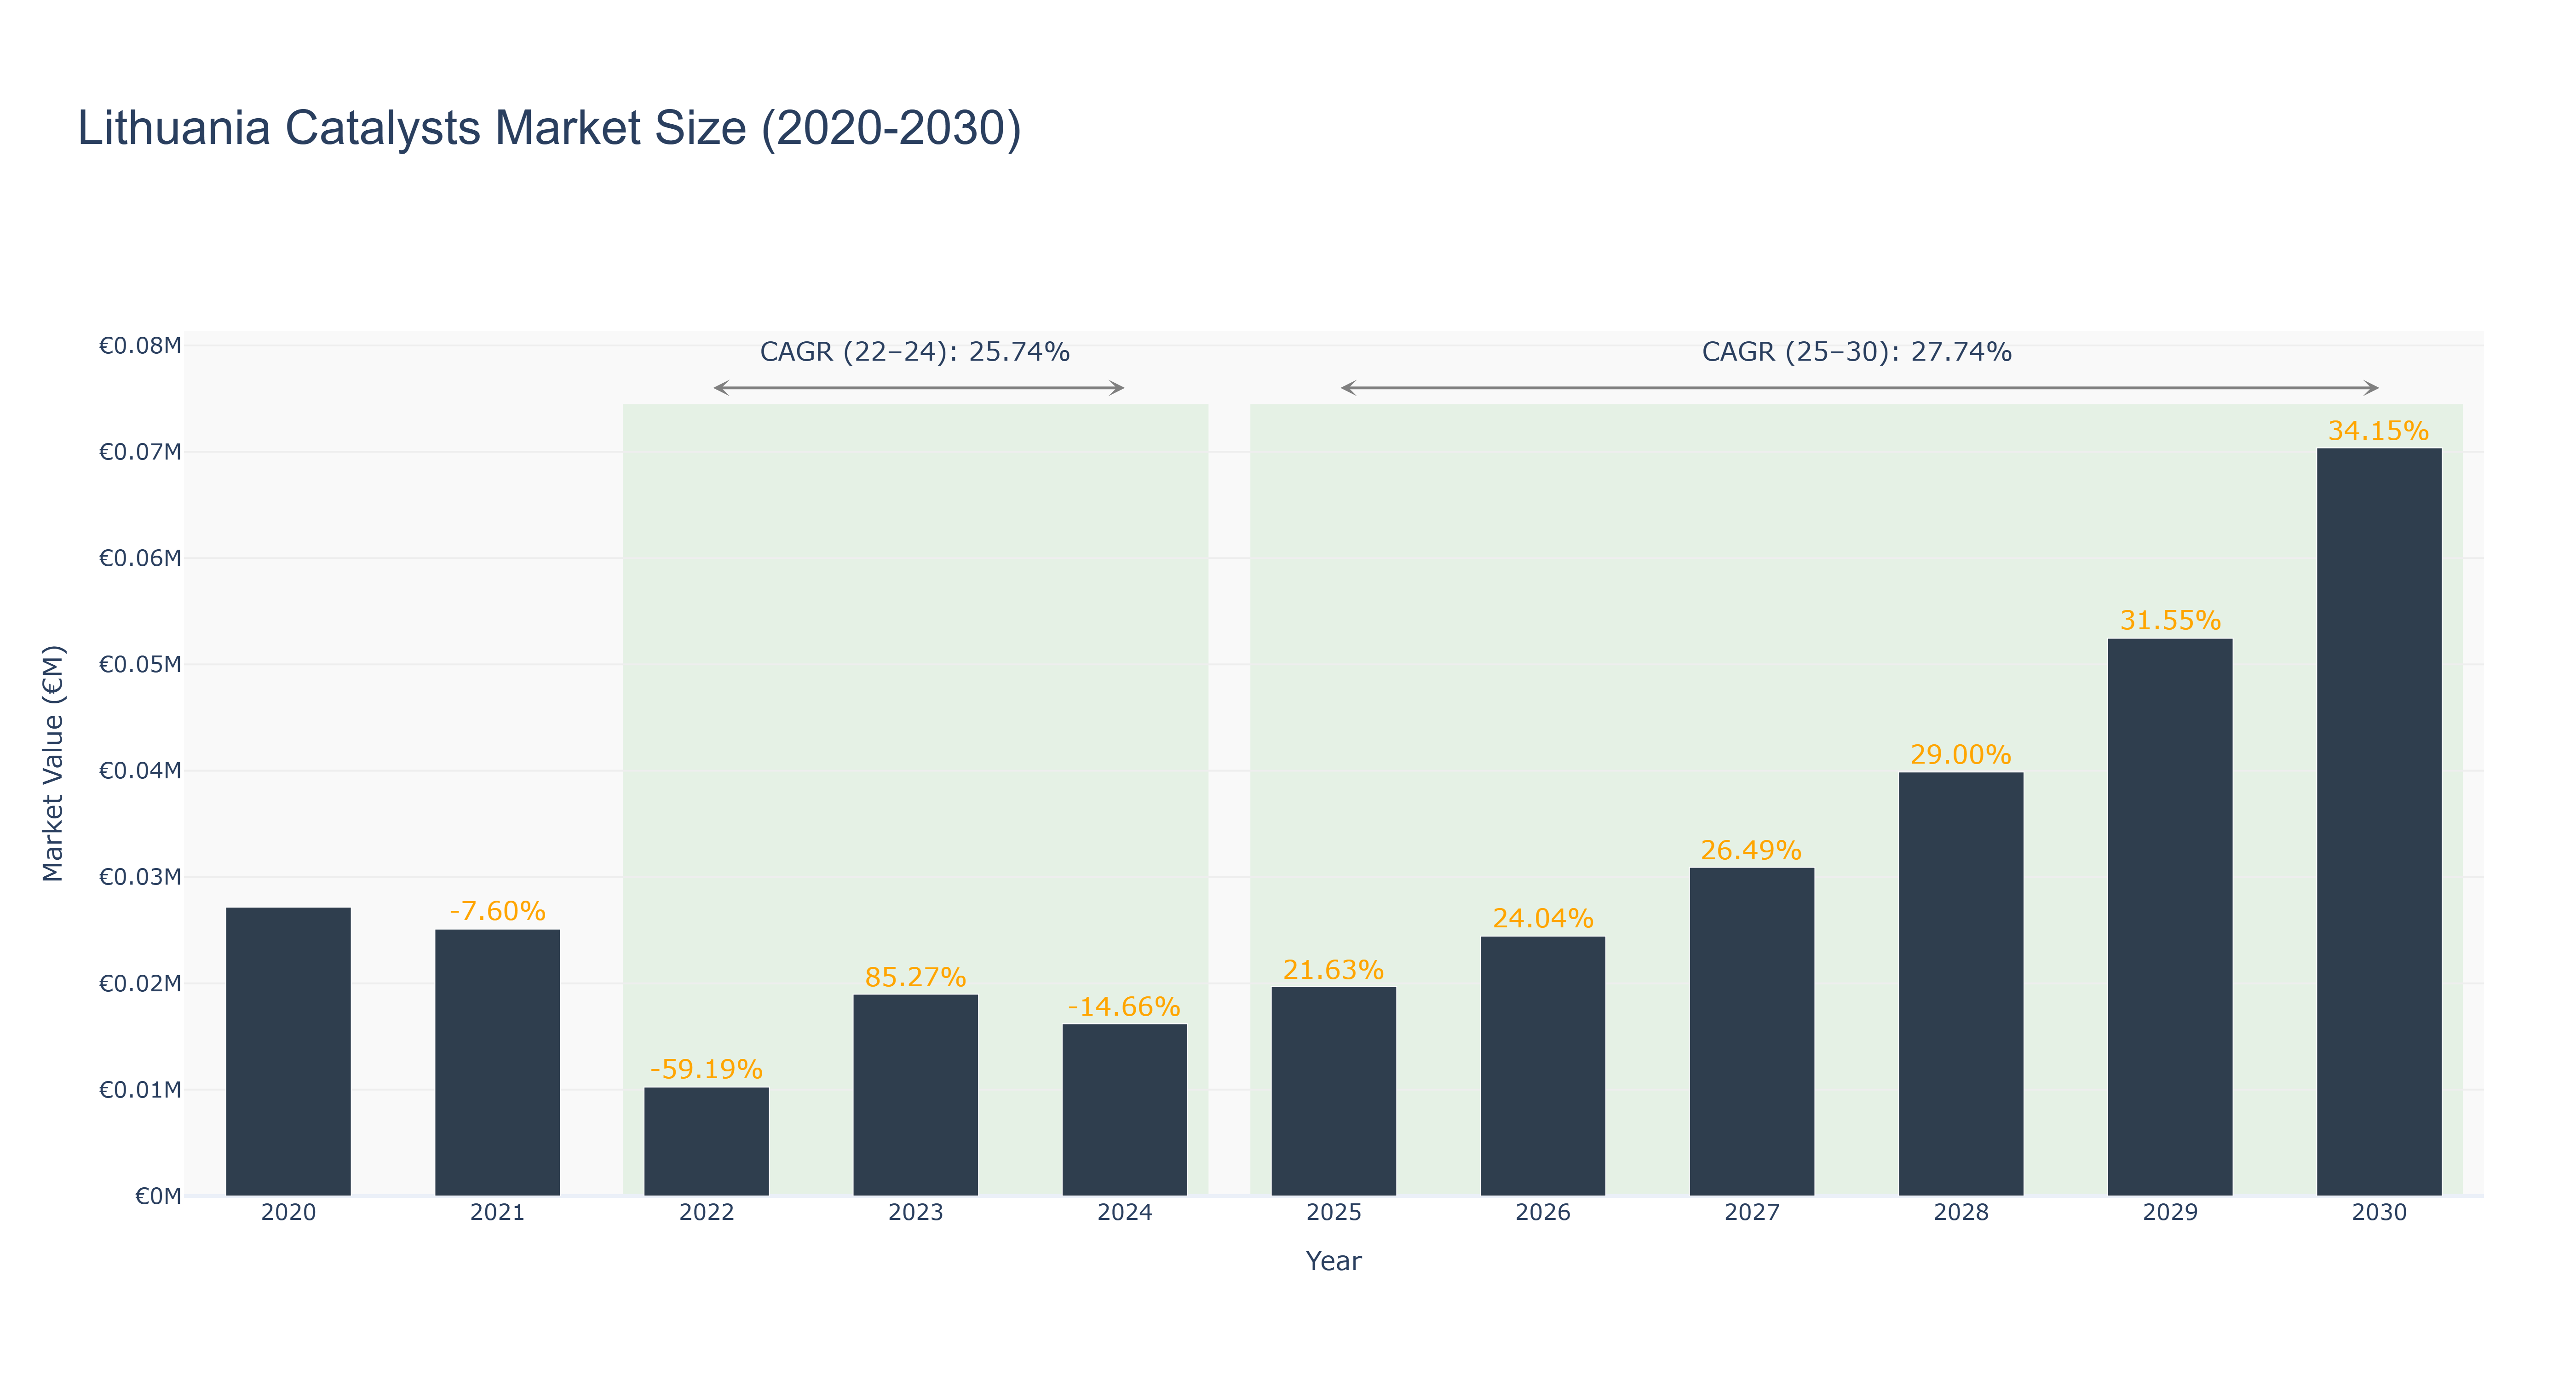
The Lithuania Catalysts Market experienced significant volatility between 2020 and 2024, peaking at €27.17 thousand in 2020, followed by a notable decline to €10.24 thousand in 2022, reflecting a drastic -59.19% growth rate. However, the market rebounded in 2023 to €18.98 thousand, driven by increased industrial activity and investments in sustainable technologies, leading to an impressive growth rate of 85.27%. The actual CAGR from 2022 to 2024 stands at 25.74%. Looking ahead, the forecasted period from 2025 to 2030 anticipates robust growth, with the market projected to reach €70.37 thousand by 2030 and a CAGR of 27.74%. This positive outlook is bolstered by ongoing developments in green chemistry and shifts toward more efficient catalytic processes, which are expected to drive demand and innovation within the sector, positioning Lithuania as a key player in the catalysts market.
Lithuania Catalysts Market: Production & Trade Performance (2019-2025)
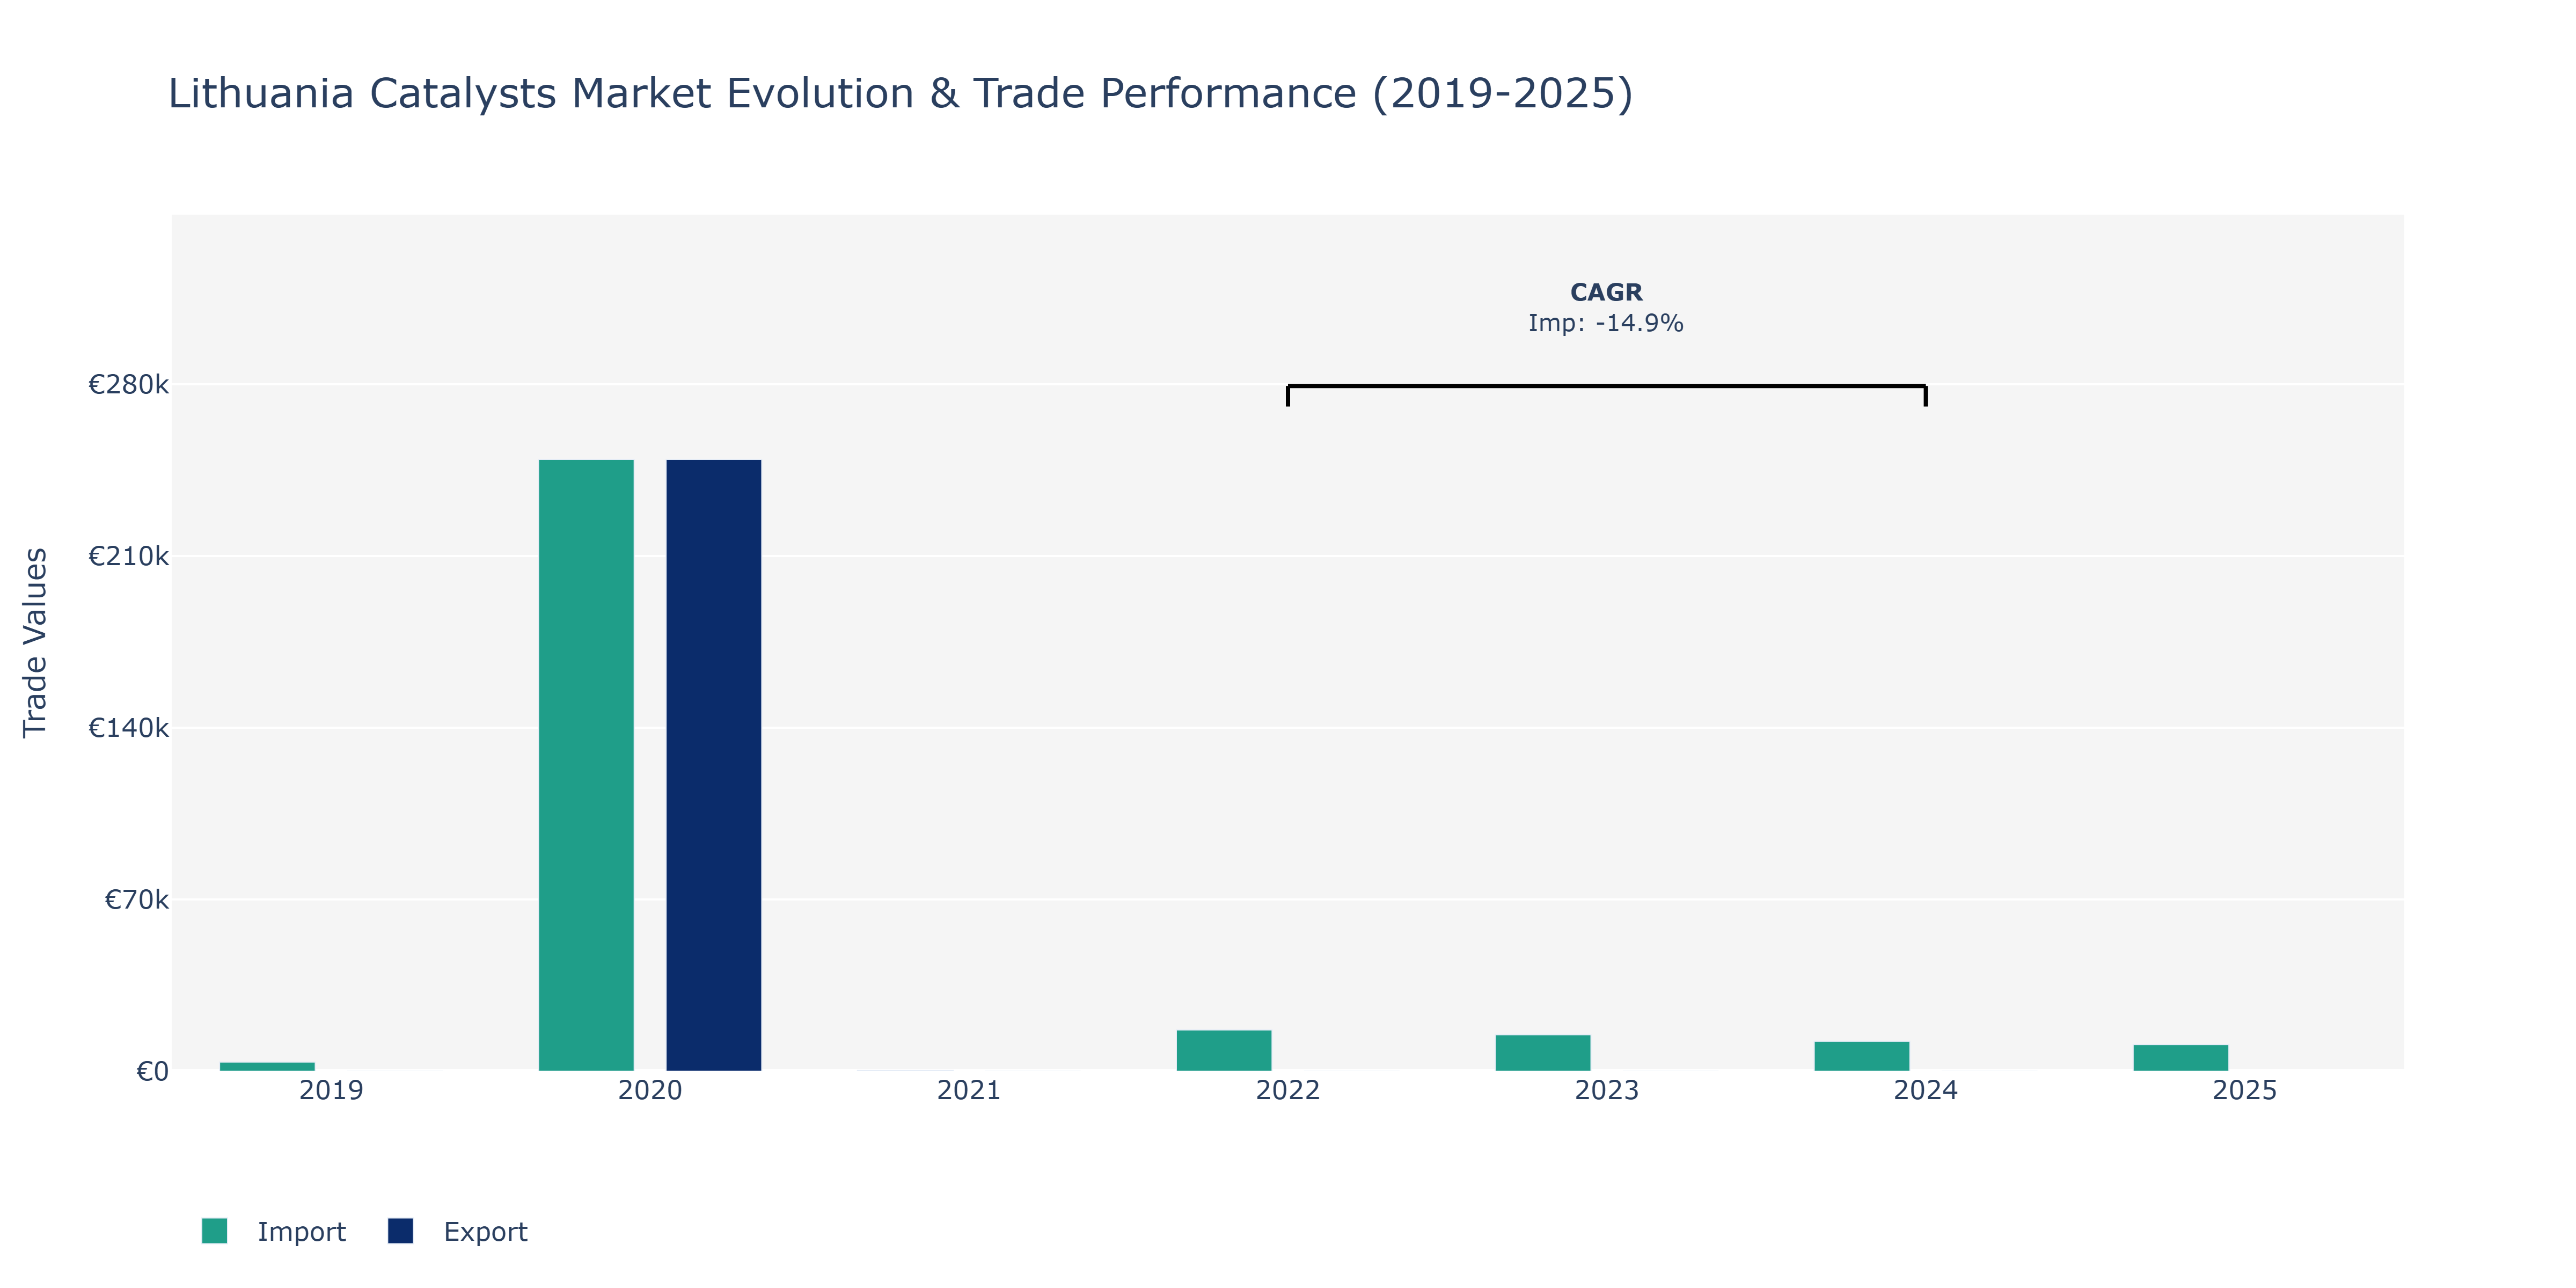
In the Lithuania Catalysts Market, imports exhibited notable fluctuations during the period under review. In 2019, imports stood at €3.72 thousand, marking the starting point for the data series. There was a substantial surge in exports in 2020, reaching €249.38 thousand, which coincided with a similar value for imports, indicating a significant trade activity level. However, in the following years, imports experienced a decreasing trend, with values dropping to €280 in 2021, followed by further declines to €121.56 thousand in 2024. The decrease in imports could be attributed to shifts in market demand, supply chain disruptions, or changes in government regulations impacting trade dynamics. Despite the fluctuations, the Lithuania Catalysts Market continues to showcase resilience, requiring market players to adapt strategies to navigate changing import landscapes effectively.
Key Highlights of the Report:
- Lithuania Catalysts Market Outlook
- Market Size of Lithuania Catalysts Market, 2025
- Forecast of Lithuania Catalysts Market, 2032
- Historical Data and Forecast of Lithuania Catalysts Revenues & Volume for the Period 2022 - 2032F
- Lithuania Catalysts Market Trend Evolution
- Lithuania Catalysts Market Drivers and Challenges
- Lithuania Catalysts Price Trends
- Lithuania Catalysts Porter`s Five Forces
- Lithuania Catalysts Industry Life Cycle
- Historical Data and Forecast of Lithuania Catalysts Market Revenues & Volume By Raw Material for the Period 2022 - 2032F
- Historical Data and Forecast of Lithuania Catalysts Market Revenues & Volume By Chemical compounds for the Period 2022 - 2032F
- Historical Data and Forecast of Lithuania Catalysts Market Revenues & Volume By Metals for the Period 2022 - 2032F
- Historical Data and Forecast of Lithuania Catalysts Market Revenues & Volume By Zeolites for the Period 2022 - 2032F
- Historical Data and Forecast of Lithuania Catalysts Market Revenues & Volume By Others for the Period 2022 - 2032F
- Historical Data and Forecast of Lithuania Catalysts Market Revenues & Volume By Application for the Period 2022 - 2032F
- Historical Data and Forecast of Lithuania Catalysts Market Revenues & Volume By Heterogeneous Catalyst for the Period 2022 - 2032F
- Historical Data and Forecast of Lithuania Catalysts Market Revenues & Volume By Homogeneous Catalystfor the Period 2022 - 2032F
- Lithuania Catalysts Import Export Trade Statistics
- Market Opportunity Assessment By Raw Material
- Market Opportunity Assessment By Application
- Lithuania Catalysts Top Companies Market Share
- Lithuania Catalysts Competitive Benchmarking By Technical and Operational Parameters
- Lithuania Catalysts Company Profiles
- Lithuania Catalysts Key Strategic Recommendations
Frequently Asked Questions About the Market Study (FAQs):
6Wresearch actively monitors the Lithuania Catalysts Market and publishes its comprehensive annual report, highlighting emerging trends, growth drivers, revenue analysis, and forecast outlook. Our insights help businesses to make data-backed strategic decisions with ongoing market dynamics. Our analysts track relevent industries related to the Lithuania Catalysts Market, allowing our clients with actionable intelligence and reliable forecasts tailored to emerging regional needs.
Yes, we provide customisation as per your requirements. To learn more, feel free to contact us on sales@6wresearch.com
1 Executive Summary |
2 Introduction |
2.1 Key Highlights of the Report |
2.2 Report Description |
2.3 Market Scope & Segmentation |
2.4 Research Methodology |
2.5 Assumptions |
3 Lithuania Catalysts Market Overview |
3.1 Lithuania Country Macro Economic Indicators |
3.2 Lithuania Catalysts Market Revenues & Volume, 2022 & 2032F |
3.3 Lithuania Catalysts Market - Industry Life Cycle |
3.4 Lithuania Catalysts Market - Porter's Five Forces |
3.5 Lithuania Catalysts Market Revenues & Volume Share, By Raw Material, 2022 & 2032F |
3.6 Lithuania Catalysts Market Revenues & Volume Share, By Application, 2022 & 2032F |
4 Lithuania Catalysts Market Dynamics |
4.1 Impact Analysis |
4.2 Market Drivers |
4.2.1 Increasing demand for environmentally friendly catalysts due to stringent environmental regulations in Lithuania |
4.2.2 Growth in the chemical and petrochemical industries in Lithuania, leading to higher demand for catalysts |
4.2.3 Rising investments in research and development activities to enhance catalyst efficiency and performance |
4.3 Market Restraints |
4.3.1 Volatility in raw material prices impacting the cost of catalyst production |
4.3.2 Intense competition from global catalyst manufacturers affecting market prices and margins |
4.3.3 Economic uncertainties and fluctuations in the industrial sector impacting the overall demand for catalysts |
5 Lithuania Catalysts Market Trends |
6 Lithuania Catalysts Market Segmentations |
6.1 Lithuania Catalysts Market, By Raw Material |
6.1.1 Overview and Analysis |
6.1.2 Lithuania Catalysts Market Revenues & Volume, By Chemical compounds, 2022 - 2032F |
6.1.3 Lithuania Catalysts Market Revenues & Volume, By Metals, 2022 - 2032F |
6.1.4 Lithuania Catalysts Market Revenues & Volume, By Zeolites, 2022 - 2032F |
6.1.5 Lithuania Catalysts Market Revenues & Volume, By Others, 2022 - 2032F |
6.2 Lithuania Catalysts Market, By Application |
6.2.1 Overview and Analysis |
6.2.2 Lithuania Catalysts Market Revenues & Volume, By Heterogeneous Catalyst, 2022 - 2032F |
6.2.3 Lithuania Catalysts Market Revenues & Volume, By Homogeneous Catalyst? , 2022 - 2032F |
7 Lithuania Catalysts Market Import-Export Trade Statistics |
7.1 Lithuania Catalysts Market Export to Major Countries |
7.2 Lithuania Catalysts Market Imports from Major Countries |
8 Lithuania Catalysts Market Key Performance Indicators |
8.1 Research and development investment in catalyst technology advancements |
8.2 Adoption rate of new environmentally friendly catalysts in the market |
8.3 Number of strategic partnerships and collaborations for catalyst development |
8.4 Percentage of catalysts meeting or exceeding environmental standards in Lithuania |
8.5 Efficiency improvement rate of catalysts in industrial applications |
9 Lithuania Catalysts Market - Opportunity Assessment |
9.1 Lithuania Catalysts Market Opportunity Assessment, By Raw Material, 2022 & 2032F |
9.2 Lithuania Catalysts Market Opportunity Assessment, By Application, 2022 & 2032F |
10 Lithuania Catalysts Market - Competitive Landscape |
10.1 Lithuania Catalysts Market Revenue Share, By Companies, 2025 |
10.2 Lithuania Catalysts Market Competitive Benchmarking, By Operating and Technical Parameters |
11 Company Profiles |
12 Recommendations | 13 Disclaimer |
Export potential assessment - trade Analytics for 2030
Export potential enables firms to identify high-growth global markets with greater confidence by combining advanced trade intelligence with a structured quantitative methodology. The framework analyzes emerging demand trends and country-level import patterns while integrating macroeconomic and trade datasets such as GDP and population forecasts, bilateral import–export flows, tariff structures, elasticity differentials between developed and developing economies, geographic distance, and import demand projections. Using weighted trade values from 2020–2024 as the base period to project country-to-country export potential for 2030, these inputs are operationalized through calculated drivers such as gravity model parameters, tariff impact factors, and projected GDP per-capita growth. Through an analysis of hidden potentials, demand hotspots, and market conditions that are most favorable to success, this method enables firms to focus on target countries, maximize returns, and global expansion with data, backed by accuracy.
By factoring in the projected importer demand gap that is currently unmet and could be potential opportunity, it identifies the potential for the Exporter (Country) among 190 countries, against the general trade analysis, which identifies the biggest importer or exporter.
To discover high-growth global markets and optimize your business strategy:
Click Here
Pricing
- Single User License$ 1,995
- Department License$ 2,400
- Site License$ 3,120
- Global License$ 3,795

Search
Thought Leadership and Analyst Meet


Our Clients
Latest Reports
- France Thermally Conductive Filler Dispersants Market (2026-2032) | Challenges, Restraints, Value, Share, Size, segmentation, Analysis, Trends, Investment Opportunities, Outlook, Pricing, Demand, Forecast, Revenue, Companies, Growth, Drivers, Strategy, Insights, Competition
- Egypt Thermally Conductive Filler Dispersants Market (2026-2032) | Competition, Forecast, Strategy, Value, Insights, Outlook, Investment Opportunities, Pricing, Demand, Share, segmentation, Drivers, Size, Companies, Restraints, Growth, Trends, Revenue, Challenges, Analysis
- Czech Republic Thermally Conductive Filler Dispersants Market (2026-2032) | Forecast, Pricing, Analysis, Drivers, Insights, Size, Demand, Growth, Challenges, segmentation, Competition, Outlook, Trends, Investment Opportunities, Companies, Strategy, Revenue, Share, Value, Restraints
- Colombia Thermally Conductive Filler Dispersants Market (2026-2032) | segmentation, Trends, Share, Drivers, Strategy, Companies, Demand, Insights, Size, Challenges, Value, Competition, Analysis, Growth, Revenue, Restraints, Forecast, Pricing, Outlook, Investment Opportunities
- China Thermally Conductive Filler Dispersants Market (2026-2032) | Restraints, Investment Opportunities, Pricing, Companies, Share, Size, Challenges, Trends, Outlook, Value, Analysis, Competition, Revenue, Drivers, Forecast, Demand, Insights, Growth, Strategy, segmentation
- Chile Thermally Conductive Filler Dispersants Market (2026-2032) | Investment Opportunities, Trends, Value, Restraints, Share, Companies, Forecast, segmentation, Pricing, Challenges, Demand, Size, Analysis, Drivers, Outlook, Growth, Competition, Strategy, Revenue, Insights
- Cambodia Thermally Conductive Filler Dispersants Market (2026-2032) | Analysis, Share, Outlook, Strategy, Pricing, Demand, Size, Growth, segmentation, Insights, Revenue, Forecast, Challenges, Competition, Companies, Investment Opportunities, Trends, Restraints, Value, Drivers
- Brazil Thermally Conductive Filler Dispersants Market (2026-2032) | Restraints, Forecast, Competition, Size, Revenue, Value, Investment Opportunities, Trends, Insights, Outlook, Growth, Analysis, Drivers, segmentation, Pricing, Challenges, Strategy, Share, Companies, Demand
- Bangladesh Thermally Conductive Filler Dispersants Market (2026-2032) | Restraints, Trends, Analysis, Competition, Insights, Forecast, Value, Investment Opportunities, Pricing, Share, Demand, Outlook, Revenue, segmentation, Companies, Drivers, Growth, Size, Challenges, Strategy
- Bahrain Thermally Conductive Filler Dispersants Market (2026-2032) | Trends, Outlook, Pricing, Demand, Value, Competition, Forecast, Growth, segmentation, Revenue, Companies, Analysis, Insights, Size, Drivers, Challenges, Strategy, Investment Opportunities, Share, Restraints
Industry Events and Analyst Meet

HIMTEX 2026

India Refining Summit 2026

India EV Show 2026

EV tech India Expo 2026

Auto Tech Asia 2026
Whitepaper
- Middle East & Africa Commercial Security Market Click here to view more.
- Middle East & Africa Fire Safety Systems & Equipment Market Click here to view more.
- GCC Drone Market Click here to view more.
- Middle East Lighting Fixture Market Click here to view more.
- GCC Physical & Perimeter Security Market Click here to view more.
6WResearch In News
- Doha a strategic location for EV manufacturing hub: IPA Qatar
- Demand for luxury TVs surging in the GCC, says Samsung
- Empowering Growth: The Thriving Journey of Bangladesh’s Cable Industry
- Demand for luxury TVs surging in the GCC, says Samsung
- Video call with a traditional healer? Once unthinkable, it’s now common in South Africa
- Intelligent Buildings To Smooth GCC’s Path To Net Zero