Lithuania Catalytic Converter Market (2026-2032) | Growth, Forecast, Outlook, Companies, Segmentation, Share, Revenue, Industry, Trends, Value, Analysis & Size
Market Forecast By Type (Three-way catalytic converter (TWCC), Four-way catalytic converter (FWCC), Diesel oxidation catalyst (DOC), Selective catalytic reduction (SCR), Lean NOx trap (LNT)), By Material (Palladium, Platinum, Rhodium, Others), By Vehicle Type (Passenger car, Light commercial vehicle, Truck, Bus), By Off-Highway Vehicle Type (Agricultural Tractors, Construction Equipment, Mining Equipment) And Competitive Landscape
| Product Code: ETC5890477 | Publication Date: Nov 2023 | Updated Date: Mar 2026 | Product Type: Market Research Report | |
| Publisher: 6Wresearch | Author: Ravi Bhandari | No. of Pages: 60 | No. of Figures: 30 | No. of Tables: 5 |
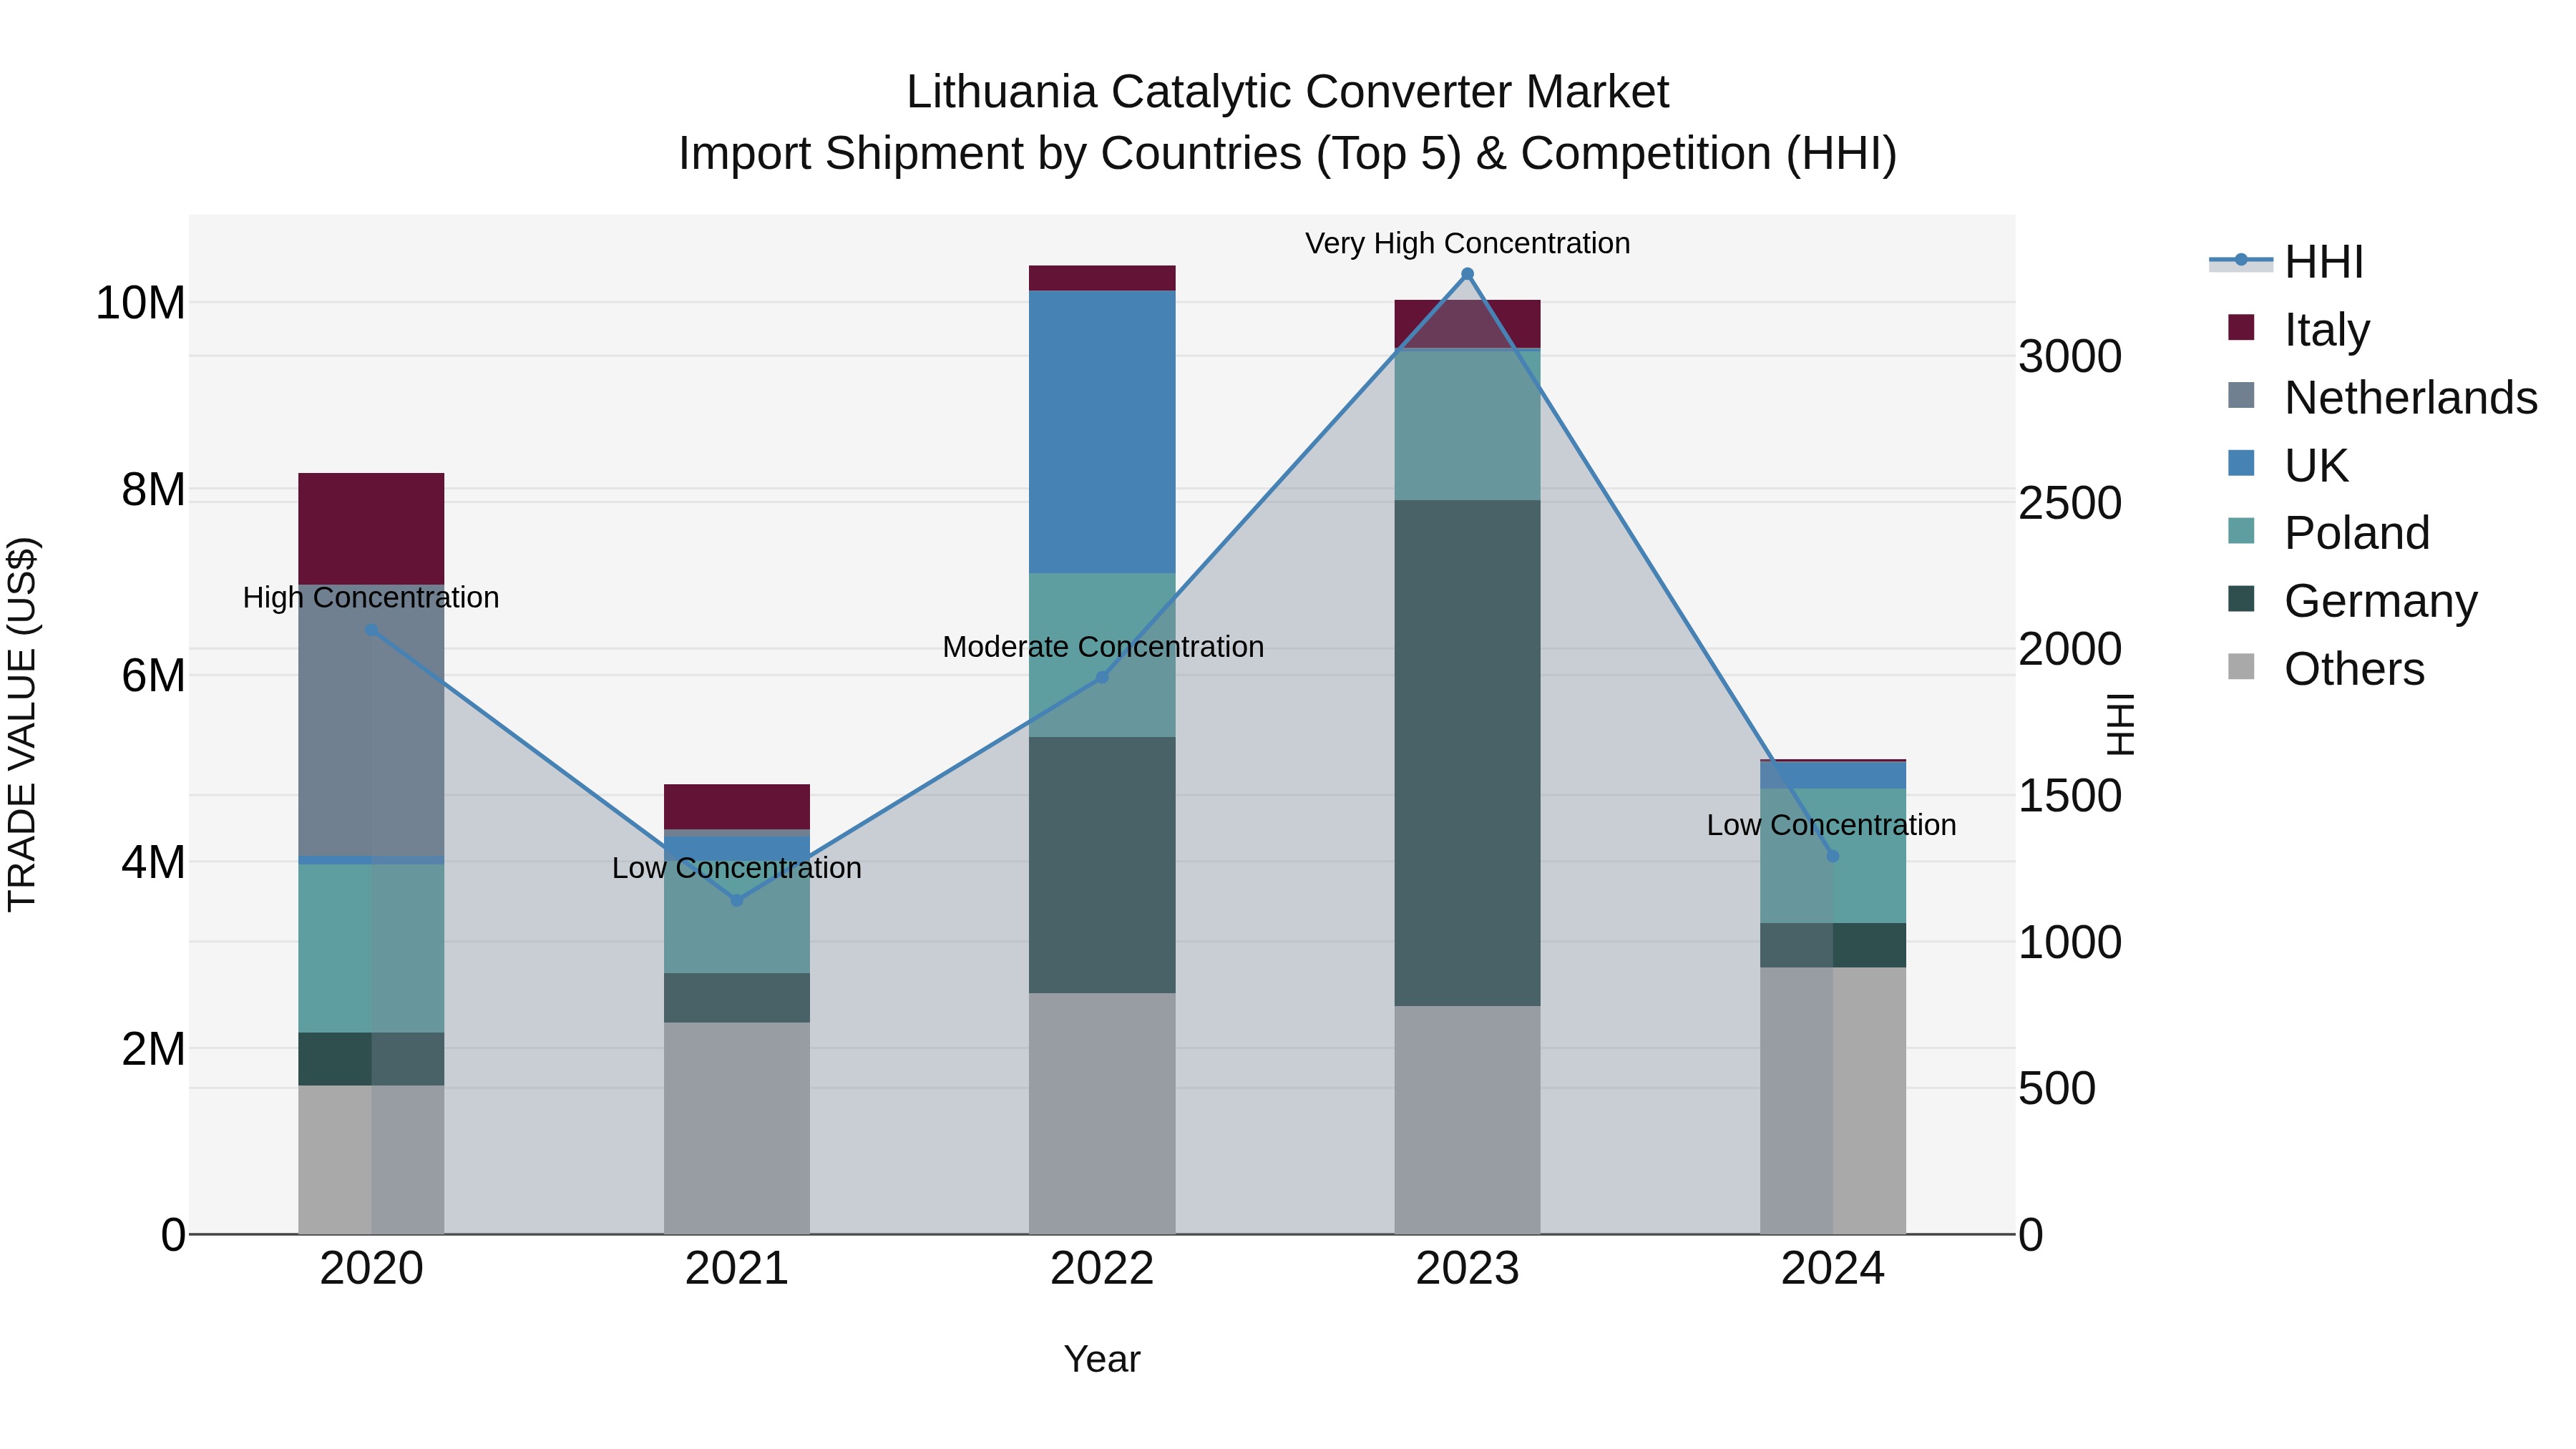
Lithuania Catalytic Converter Market Top 5 Importing Countries and Market Competition (HHI) Analysis
In 2024, Lithuania saw a shift in the concentration of catalytic converter imports, with a decrease in HHI indicating a more diversified market. The top exporting countries to Lithuania in 2024 were Poland, Latvia, Romania, Germany, and Sweden. Despite a declining CAGR of -11.12% from 2020 to 2024, the growth rate in 2024 plummeted by -49.12%. This suggests a challenging landscape for catalytic converter imports in Lithuania, potentially impacted by changing market dynamics and external factors. Market players may need to adapt their strategies to navigate these turbulent conditions effectively.
Key Highlights of the Report:
- Lithuania Catalytic Converter Market Outlook
- Market Size of Lithuania Catalytic Converter Market, 2025
- Forecast of Lithuania Catalytic Converter Market, 2032
- Historical Data and Forecast of Lithuania Catalytic Converter Revenues & Volume for the Period 2022 - 2032F
- Lithuania Catalytic Converter Market Trend Evolution
- Lithuania Catalytic Converter Market Drivers and Challenges
- Lithuania Catalytic Converter Price Trends
- Lithuania Catalytic Converter Porter`s Five Forces
- Lithuania Catalytic Converter Industry Life Cycle
- Historical Data and Forecast of Lithuania Catalytic Converter Market Revenues & Volume By Type for the Period 2022 - 2032F
- Historical Data and Forecast of Lithuania Catalytic Converter Market Revenues & Volume By Three-way catalytic converter (TWCC) for the Period 2022 - 2032F
- Historical Data and Forecast of Lithuania Catalytic Converter Market Revenues & Volume By Four-way catalytic converter (FWCC) for the Period 2022 - 2032F
- Historical Data and Forecast of Lithuania Catalytic Converter Market Revenues & Volume By Diesel oxidation catalyst (DOC) for the Period 2022 - 2032F
- Historical Data and Forecast of Lithuania Catalytic Converter Market Revenues & Volume By Selective catalytic reduction (SCR) for the Period 2022 - 2032F
- Historical Data and Forecast of Lithuania Catalytic Converter Market Revenues & Volume By Lean NOx trap (LNT) for the Period 2022 - 2032F
- Historical Data and Forecast of Lithuania Catalytic Converter Market Revenues & Volume By Material for the Period 2022 - 2032F
- Historical Data and Forecast of Lithuania Catalytic Converter Market Revenues & Volume By Palladium for the Period 2022 - 2032F
- Historical Data and Forecast of Lithuania Catalytic Converter Market Revenues & Volume By Platinum for the Period 2022 - 2032F
- Historical Data and Forecast of Lithuania Catalytic Converter Market Revenues & Volume By Rhodium for the Period 2022 - 2032F
- Historical Data and Forecast of Lithuania Catalytic Converter Market Revenues & Volume By Others for the Period 2022 - 2032F
- Historical Data and Forecast of Lithuania Catalytic Converter Market Revenues & Volume By Vehicle Type for the Period 2022 - 2032F
- Historical Data and Forecast of Lithuania Catalytic Converter Market Revenues & Volume By Passenger car for the Period 2022 - 2032F
- Historical Data and Forecast of Lithuania Catalytic Converter Market Revenues & Volume By Light commercial vehicle for the Period 2022 - 2032F
- Historical Data and Forecast of Lithuania Catalytic Converter Market Revenues & Volume By Truck for the Period 2022 - 2032F
- Historical Data and Forecast of Lithuania Catalytic Converter Market Revenues & Volume By Bus for the Period 2022 - 2032F
- Historical Data and Forecast of Lithuania Catalytic Converter Market Revenues & Volume By Off-Highway Vehicle Type for the Period 2022 - 2032F
- Historical Data and Forecast of Lithuania Catalytic Converter Market Revenues & Volume By Agricultural Tractors for the Period 2022 - 2032F
- Historical Data and Forecast of Lithuania Catalytic Converter Market Revenues & Volume By Construction Equipment for the Period 2022 - 2032F
- Historical Data and Forecast of Lithuania Catalytic Converter Market Revenues & Volume By Mining Equipment for the Period 2022 - 2032F
- Lithuania Catalytic Converter Import Export Trade Statistics
- Market Opportunity Assessment By Type
- Market Opportunity Assessment By Material
- Market Opportunity Assessment By Vehicle Type
- Market Opportunity Assessment By Off-Highway Vehicle Type
- Lithuania Catalytic Converter Top Companies Market Share
- Lithuania Catalytic Converter Competitive Benchmarking By Technical and Operational Parameters
- Lithuania Catalytic Converter Company Profiles
- Lithuania Catalytic Converter Key Strategic Recommendations
Frequently Asked Questions About the Market Study (FAQs):
6Wresearch actively monitors the Lithuania Catalytic Converter Market and publishes its comprehensive annual report, highlighting emerging trends, growth drivers, revenue analysis, and forecast outlook. Our insights help businesses to make data-backed strategic decisions with ongoing market dynamics. Our analysts track relevent industries related to the Lithuania Catalytic Converter Market, allowing our clients with actionable intelligence and reliable forecasts tailored to emerging regional needs.
Yes, we provide customisation as per your requirements. To learn more, feel free to contact us on sales@6wresearch.com
1 Executive Summary |
2 Introduction |
2.1 Key Highlights of the Report |
2.2 Report Description |
2.3 Market Scope & Segmentation |
2.4 Research Methodology |
2.5 Assumptions |
3 Lithuania Catalytic Converter Market Overview |
3.1 Lithuania Country Macro Economic Indicators |
3.2 Lithuania Catalytic Converter Market Revenues & Volume, 2022 & 2032F |
3.3 Lithuania Catalytic Converter Market - Industry Life Cycle |
3.4 Lithuania Catalytic Converter Market - Porter's Five Forces |
3.5 Lithuania Catalytic Converter Market Revenues & Volume Share, By Type, 2022 & 2032F |
3.6 Lithuania Catalytic Converter Market Revenues & Volume Share, By Material, 2022 & 2032F |
3.7 Lithuania Catalytic Converter Market Revenues & Volume Share, By Vehicle Type, 2022 & 2032F |
3.8 Lithuania Catalytic Converter Market Revenues & Volume Share, By Off-Highway Vehicle Type, 2022 & 2032F |
4 Lithuania Catalytic Converter Market Dynamics |
4.1 Impact Analysis |
4.2 Market Drivers |
4.2.1 Stringent environmental regulations in Lithuania promoting the adoption of catalytic converters |
4.2.2 Increasing awareness about air pollution and its impact on public health |
4.2.3 Growth in automotive industry leading to higher demand for catalytic converters |
4.3 Market Restraints |
4.3.1 High initial cost of catalytic converters impacting market penetration |
4.3.2 Technological advancements leading to the development of alternative solutions |
4.3.3 Volatility in raw material prices affecting manufacturing costs |
5 Lithuania Catalytic Converter Market Trends |
6 Lithuania Catalytic Converter Market Segmentations |
6.1 Lithuania Catalytic Converter Market, By Type |
6.1.1 Overview and Analysis |
6.1.2 Lithuania Catalytic Converter Market Revenues & Volume, By Three-way catalytic converter (TWCC), 2022 - 2032F |
6.1.3 Lithuania Catalytic Converter Market Revenues & Volume, By Four-way catalytic converter (FWCC), 2022 - 2032F |
6.1.4 Lithuania Catalytic Converter Market Revenues & Volume, By Diesel oxidation catalyst (DOC), 2022 - 2032F |
6.1.5 Lithuania Catalytic Converter Market Revenues & Volume, By Selective catalytic reduction (SCR), 2022 - 2032F |
6.1.6 Lithuania Catalytic Converter Market Revenues & Volume, By Lean NOx trap (LNT), 2022 - 2032F |
6.2 Lithuania Catalytic Converter Market, By Material |
6.2.1 Overview and Analysis |
6.2.2 Lithuania Catalytic Converter Market Revenues & Volume, By Palladium, 2022 - 2032F |
6.2.3 Lithuania Catalytic Converter Market Revenues & Volume, By Platinum, 2022 - 2032F |
6.2.4 Lithuania Catalytic Converter Market Revenues & Volume, By Rhodium, 2022 - 2032F |
6.2.5 Lithuania Catalytic Converter Market Revenues & Volume, By Others, 2022 - 2032F |
6.3 Lithuania Catalytic Converter Market, By Vehicle Type |
6.3.1 Overview and Analysis |
6.3.2 Lithuania Catalytic Converter Market Revenues & Volume, By Passenger car, 2022 - 2032F |
6.3.3 Lithuania Catalytic Converter Market Revenues & Volume, By Light commercial vehicle, 2022 - 2032F |
6.3.4 Lithuania Catalytic Converter Market Revenues & Volume, By Truck, 2022 - 2032F |
6.3.5 Lithuania Catalytic Converter Market Revenues & Volume, By Bus, 2022 - 2032F |
6.4 Lithuania Catalytic Converter Market, By Off-Highway Vehicle Type |
6.4.1 Overview and Analysis |
6.4.2 Lithuania Catalytic Converter Market Revenues & Volume, By Agricultural Tractors, 2022 - 2032F |
6.4.3 Lithuania Catalytic Converter Market Revenues & Volume, By Construction Equipment, 2022 - 2032F |
6.4.4 Lithuania Catalytic Converter Market Revenues & Volume, By Mining Equipment, 2022 - 2032F |
7 Lithuania Catalytic Converter Market Import-Export Trade Statistics |
7.1 Lithuania Catalytic Converter Market Export to Major Countries |
7.2 Lithuania Catalytic Converter Market Imports from Major Countries |
8 Lithuania Catalytic Converter Market Key Performance Indicators |
8.1 Average age of vehicles in Lithuania |
8.2 Number of vehicles equipped with catalytic converters per capita |
8.3 Compliance rate with emission standards by vehicles in Lithuania |
9 Lithuania Catalytic Converter Market - Opportunity Assessment |
9.1 Lithuania Catalytic Converter Market Opportunity Assessment, By Type, 2022 & 2032F |
9.2 Lithuania Catalytic Converter Market Opportunity Assessment, By Material, 2022 & 2032F |
9.3 Lithuania Catalytic Converter Market Opportunity Assessment, By Vehicle Type, 2022 & 2032F |
9.4 Lithuania Catalytic Converter Market Opportunity Assessment, By Off-Highway Vehicle Type, 2022 & 2032F |
10 Lithuania Catalytic Converter Market - Competitive Landscape |
10.1 Lithuania Catalytic Converter Market Revenue Share, By Companies, 2025 |
10.2 Lithuania Catalytic Converter Market Competitive Benchmarking, By Operating and Technical Parameters |
11 Company Profiles |
12 Recommendations | 13 Disclaimer |
Export potential assessment - trade Analytics for 2030
Export potential enables firms to identify high-growth global markets with greater confidence by combining advanced trade intelligence with a structured quantitative methodology. The framework analyzes emerging demand trends and country-level import patterns while integrating macroeconomic and trade datasets such as GDP and population forecasts, bilateral import–export flows, tariff structures, elasticity differentials between developed and developing economies, geographic distance, and import demand projections. Using weighted trade values from 2020–2024 as the base period to project country-to-country export potential for 2030, these inputs are operationalized through calculated drivers such as gravity model parameters, tariff impact factors, and projected GDP per-capita growth. Through an analysis of hidden potentials, demand hotspots, and market conditions that are most favorable to success, this method enables firms to focus on target countries, maximize returns, and global expansion with data, backed by accuracy.
By factoring in the projected importer demand gap that is currently unmet and could be potential opportunity, it identifies the potential for the Exporter (Country) among 190 countries, against the general trade analysis, which identifies the biggest importer or exporter.
To discover high-growth global markets and optimize your business strategy:
Click Here
Pricing
- Single User License$ 1,995
- Department License$ 2,400
- Site License$ 3,120
- Global License$ 3,795

Search
Thought Leadership and Analyst Meet


Our Clients
Latest Reports
- China Electric Appliance Rental Market (2026-2032) | Trends, Revenue, Growth, Challenges, Size, Value, Outlook, Pricing, Strategy, Insights, Restraints, segmentation, Companies, Investment Opportunities, Analysis, Demand, Drivers, Competition, Forecast, Share
- Chile Electric Appliance Rental Market (2026-2032) | Outlook, Competition, Drivers, Strategy, Revenue, Analysis, Value, Pricing, Restraints, Size, Demand, Share, Growth, Forecast, Challenges, Insights, Investment Opportunities, Companies, Trends, segmentation
- Cambodia Electric Appliance Rental Market (2026-2032) | Companies, Analysis, Restraints, Pricing, Insights, Challenges, Outlook, Strategy, Forecast, Trends, Competition, Value, Revenue, Investment Opportunities, segmentation, Drivers, Size, Demand, Growth, Share
- Brazil Electric Appliance Rental Market (2026-2032) | Revenue, Strategy, Forecast, Companies, segmentation, Competition, Size, Investment Opportunities, Pricing, Restraints, Outlook, Challenges, Analysis, Drivers, Value, Demand, Insights, Trends, Growth, Share
- Bangladesh Electric Appliance Rental Market (2026-2032) | Drivers, Forecast, Investment Opportunities, Strategy, Insights, Demand, Challenges, Outlook, Trends, Competition, Value, Revenue, Size, Pricing, Analysis, Companies, Restraints, segmentation, Share, Growth
- Bahrain Electric Appliance Rental Market (2026-2032) | Outlook, Size, Competition, Restraints, Drivers, Value, Trends, Investment Opportunities, Insights, Forecast, Revenue, Strategy, Growth, Share, Demand, Analysis, Challenges, Companies, segmentation, Pricing
- Azerbaijan Electric Appliance Rental Market (2026-2032) | Trends, Investment Opportunities, Restraints, Insights, Strategy, Competition, Value, Growth, Demand, Drivers, Analysis, Forecast, Size, Share, Outlook, segmentation, Pricing, Challenges, Revenue, Companies
- Australia Electric Appliance Rental Market (2026-2032) | Challenges, Restraints, Forecast, Demand, Size, Competition, Pricing, Investment Opportunities, Revenue, Trends, Drivers, Growth, Outlook, Analysis, Strategy, Value, segmentation, Insights, Companies, Share
- Argentina Electric Appliance Rental Market (2026-2032) | Growth, Trends, Insights, Outlook, Forecast, Size, Drivers, Analysis, Restraints, Challenges, Share, Revenue, Investment Opportunities, Strategy, Demand, Value, Companies, segmentation, Competition, Pricing
- Algeria Electric Appliance Rental Market (2026-2032) | Share, Size, Value, Strategy, Competition, Outlook, Challenges, Companies, Trends, Pricing, Insights, Forecast, Investment Opportunities, Revenue, Growth, Restraints, segmentation, Analysis, Demand, Drivers
Industry Events and Analyst Meet

HIMTEX 2026

India Refining Summit 2026

India EV Show 2026

EV tech India Expo 2026

Auto Tech Asia 2026
Whitepaper
- Middle East & Africa Commercial Security Market Click here to view more.
- Middle East & Africa Fire Safety Systems & Equipment Market Click here to view more.
- GCC Drone Market Click here to view more.
- Middle East Lighting Fixture Market Click here to view more.
- GCC Physical & Perimeter Security Market Click here to view more.
6WResearch In News
- Doha a strategic location for EV manufacturing hub: IPA Qatar
- Demand for luxury TVs surging in the GCC, says Samsung
- Empowering Growth: The Thriving Journey of Bangladesh’s Cable Industry
- Demand for luxury TVs surging in the GCC, says Samsung
- Video call with a traditional healer? Once unthinkable, it’s now common in South Africa
- Intelligent Buildings To Smooth GCC’s Path To Net Zero