Lithuania Ceramic Wash Basin Market (2026-2032) | Segmentation, Revenue, Growth, Trends, Size, Companies, Outlook, Forecast, Industry, Value, Share & Analysis
Market Forecast By Type (Full-pedestal Wash Basin, Table-top Wash Basin, Wall-mounted Wash Basin, Wall-hung Wash Basin), By End-use (Residential, Commercial), By Distribution Channel (Online Channel, Offline Channel) And Competitive Landscape
| Product Code: ETC4971998 | Publication Date: Nov 2023 | Updated Date: Apr 2026 | Product Type: Market Research Report | |
| Publisher: 6Wresearch | Author: Shubham Padhi | No. of Pages: 60 | No. of Figures: 30 | No. of Tables: 5 |
Lithuania Ceramic Wash Basin Market Size (2020-2030)
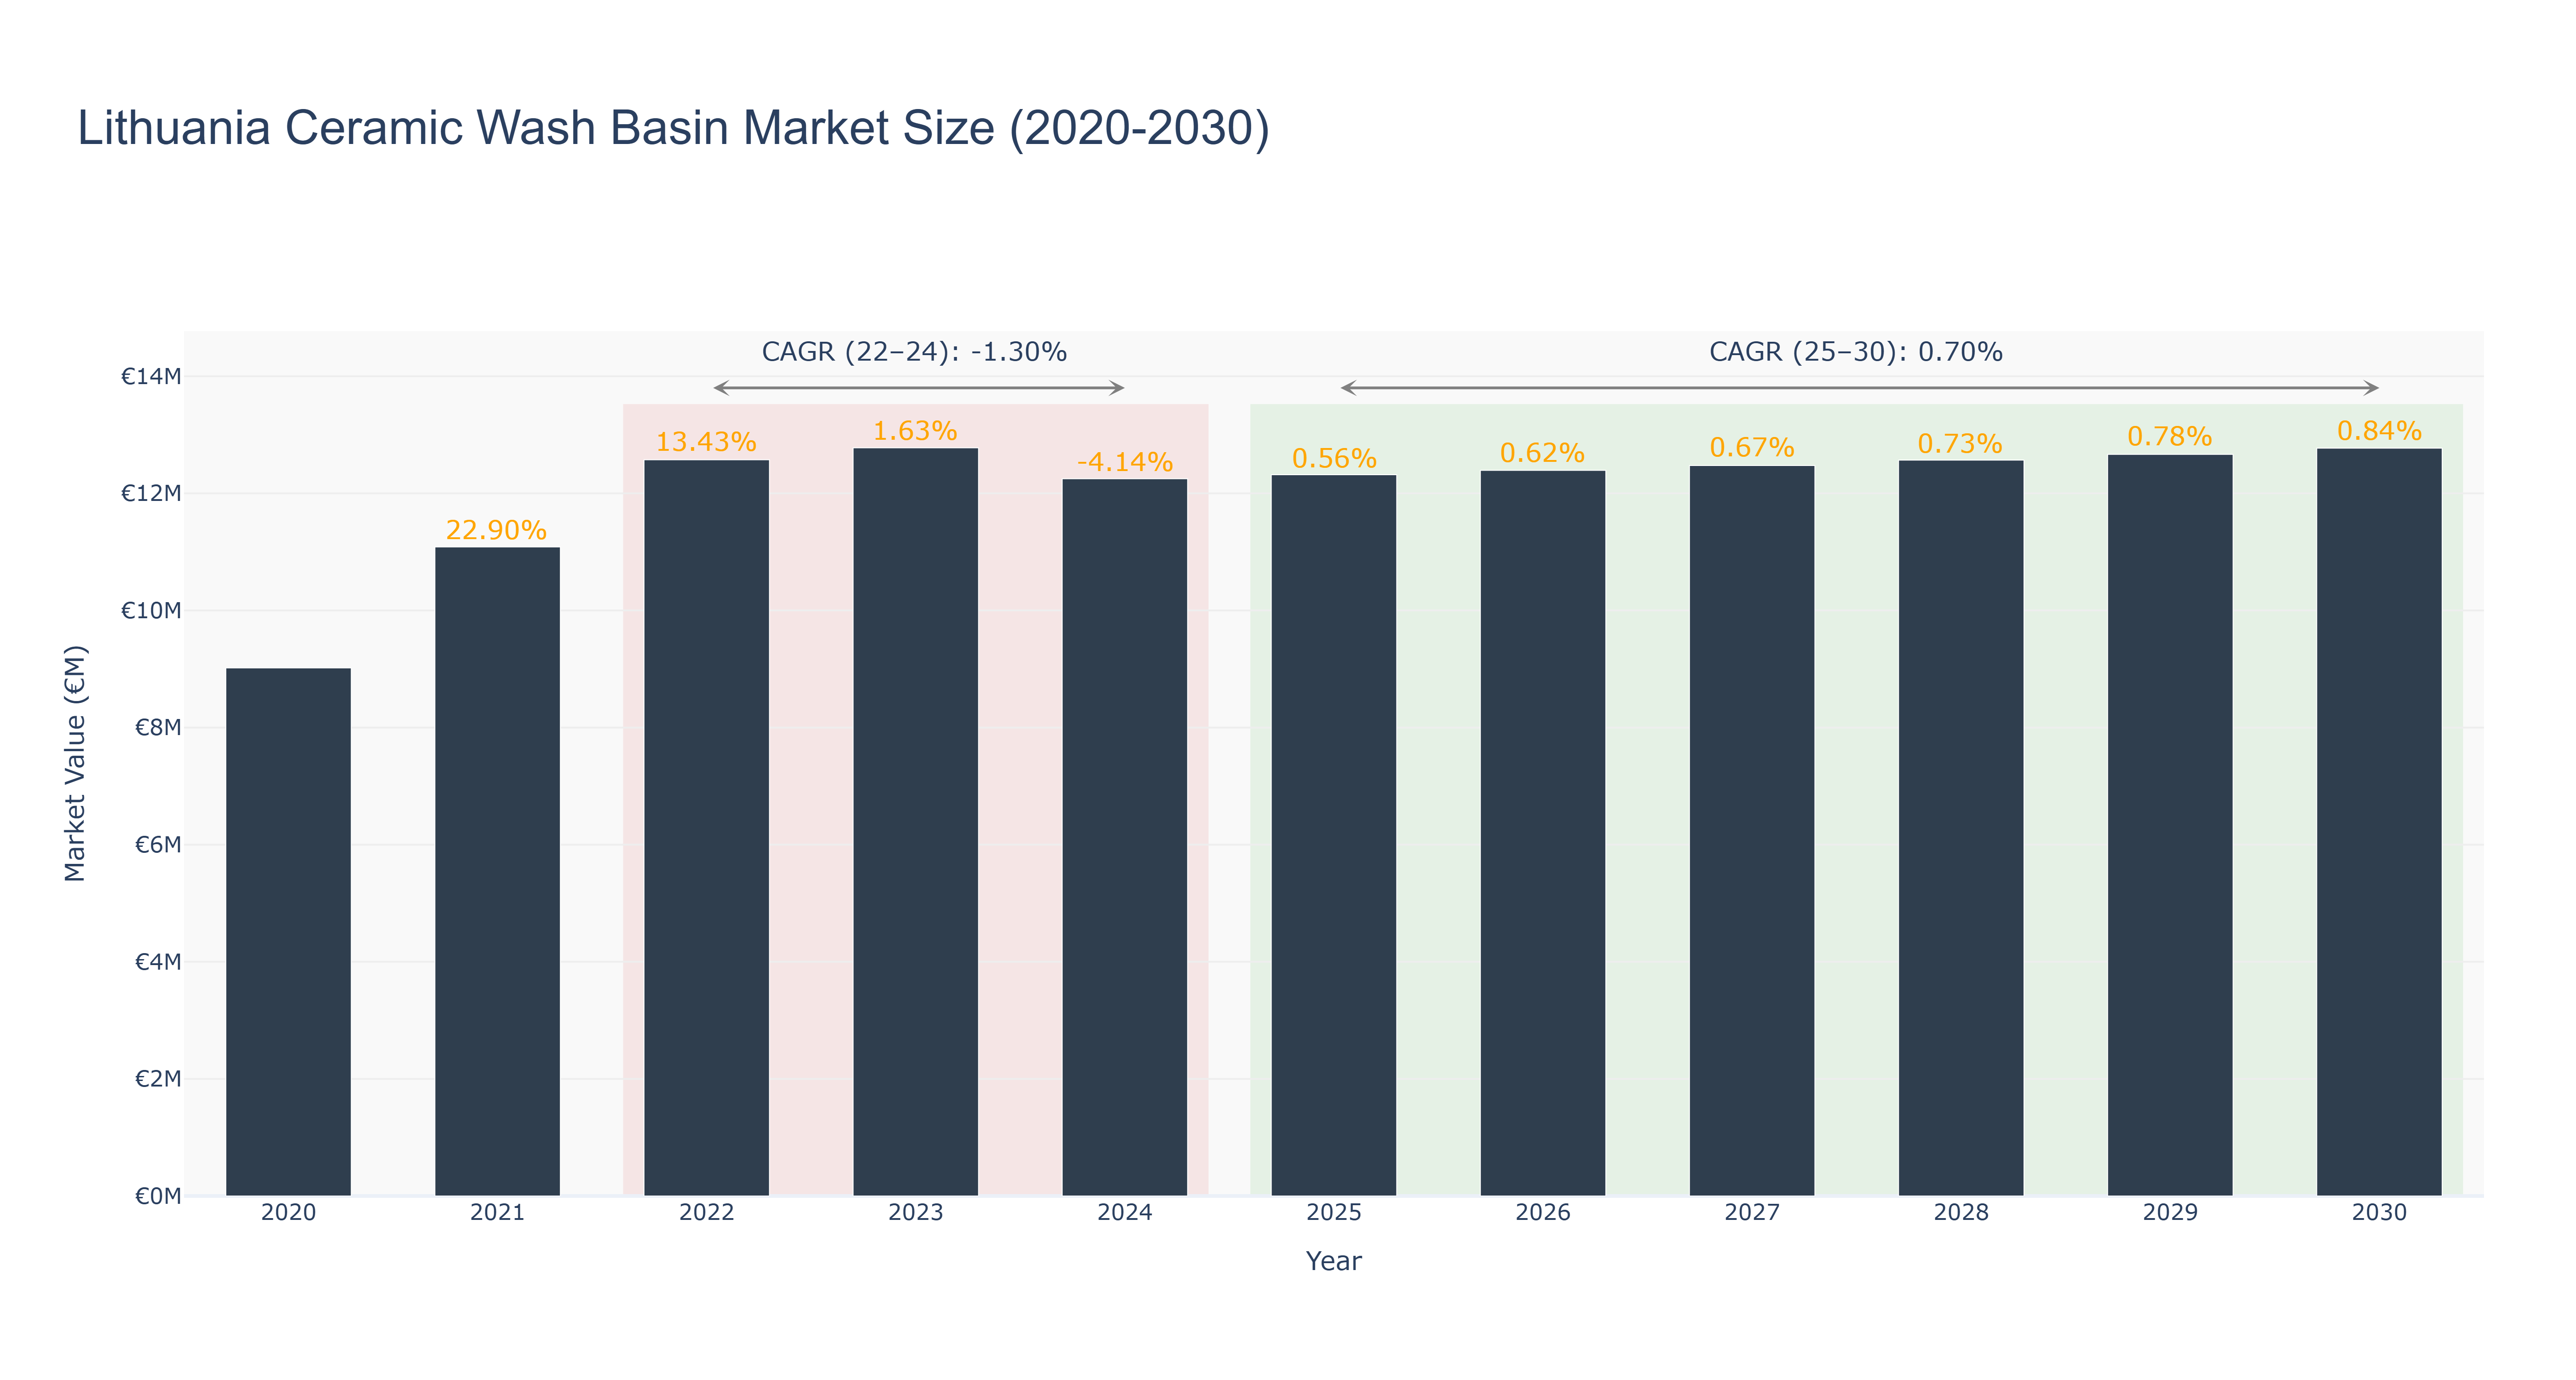
The Lithuania Ceramic Wash Basin Market experienced a peak market size of €12.78 million in 2023. From 2020 to 2024, the market size fluctuated, starting at €9.02 million in 2020, peaking in 2023, and then slightly declining to €12.25 million in 2024. Forecasted market size from 2025 to 2030 shows a steady upward trend, with the market expected to reach €12.77 million in 2030. The CAGR values for the market are -1.30% for the period 2022-24 and 0.70% for the period 2025-30. The decline in market size from 2023 to 2024 could be attributed to economic fluctuations, while the forecasted growth is likely driven by increasing consumer demand and product innovation. Recent developments in the market include plans for sustainable manufacturing practices and the introduction of smart technology in wash basin designs, indicating a promising future for the industry.
Lithuania Ceramic Wash Basin Market: Production & Trade Performance (2019-2025)
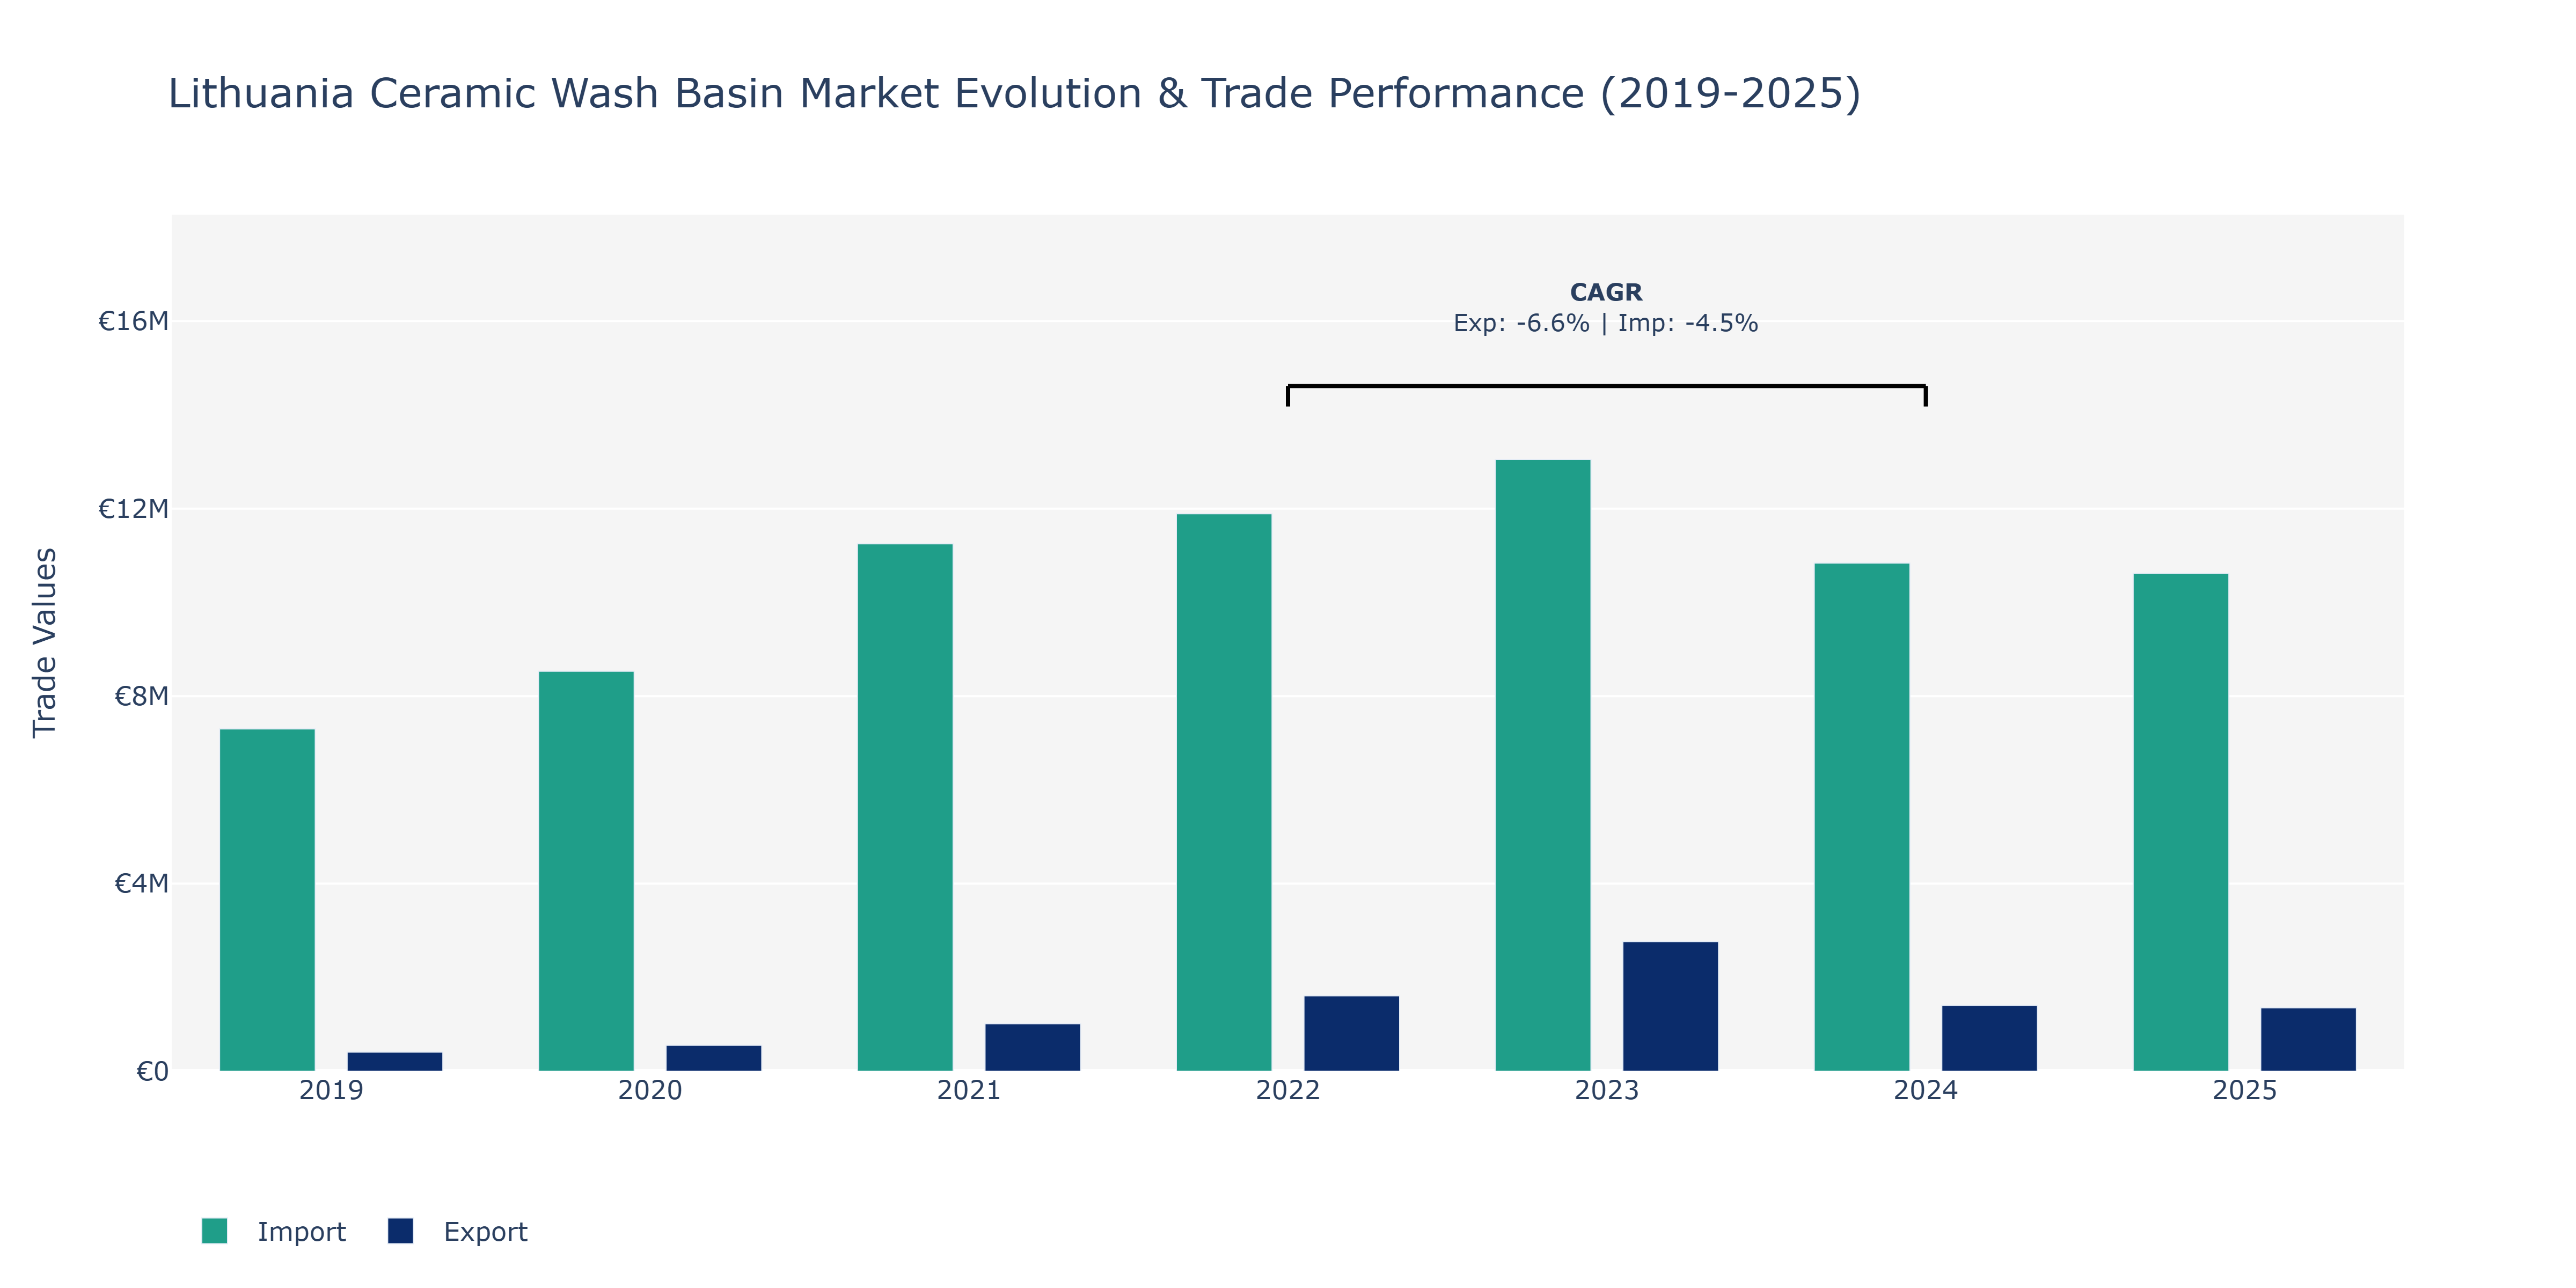
The Lithuania Ceramic Wash Basin Market witnessed notable fluctuations in both exports and imports from 2019 to 2025. Exports started at €405.72 thousand in 2019, experienced a significant surge in 2023 to reach €2.77 million before dropping to €1.4 million in 2024 and further declining to €1.35 million in 2025. Conversely, imports showed a consistent upward trend, starting at €7.3 million in 2019 and steadily increasing to €11.85 million in 2025. The peak point for exports was in 2023, driven by factors such as expanding global demand for ceramic wash basins and enhanced marketing strategies. On the other hand, the rise in imports can be attributed to the growing need for raw materials or finished products to meet domestic market demands and technological advancements in manufacturing processes. The decline in both exports and imports in 2024 might be linked to economic fluctuations or regulatory changes impacting trade flows. It is essential for market players to monitor these trends closely and adapt their strategies to navigate the evolving landscape effectively.
Key Highlights of the Report:
- Lithuania Ceramic Wash Basin Market Outlook
- Market Size of Lithuania Ceramic Wash Basin Market, 2025
- Forecast of Lithuania Ceramic Wash Basin Market, 2032
- Historical Data and Forecast of Lithuania Ceramic Wash Basin Revenues & Volume for the Period 2022 - 2032F
- Lithuania Ceramic Wash Basin Market Trend Evolution
- Lithuania Ceramic Wash Basin Market Drivers and Challenges
- Lithuania Ceramic Wash Basin Price Trends
- Lithuania Ceramic Wash Basin Porter`s Five Forces
- Lithuania Ceramic Wash Basin Industry Life Cycle
- Historical Data and Forecast of Lithuania Ceramic Wash Basin Market Revenues & Volume By Type for the Period 2022 - 2032F
- Historical Data and Forecast of Lithuania Ceramic Wash Basin Market Revenues & Volume By Full-pedestal Wash Basin for the Period 2022 - 2032F
- Historical Data and Forecast of Lithuania Ceramic Wash Basin Market Revenues & Volume By Table-top Wash Basin for the Period 2022 - 2032F
- Historical Data and Forecast of Lithuania Ceramic Wash Basin Market Revenues & Volume By Wall-mounted Wash Basin for the Period 2022 - 2032F
- Historical Data and Forecast of Lithuania Ceramic Wash Basin Market Revenues & Volume By Wall-hung Wash Basin for the Period 2022 - 2032F
- Historical Data and Forecast of Lithuania Ceramic Wash Basin Market Revenues & Volume By End-use for the Period 2022 - 2032F
- Historical Data and Forecast of Lithuania Ceramic Wash Basin Market Revenues & Volume By Residential for the Period 2022 - 2032F
- Historical Data and Forecast of Lithuania Ceramic Wash Basin Market Revenues & Volume By Commercial for the Period 2022 - 2032F
- Historical Data and Forecast of Lithuania Ceramic Wash Basin Market Revenues & Volume By Distribution Channel for the Period 2022 - 2032F
- Historical Data and Forecast of Lithuania Ceramic Wash Basin Market Revenues & Volume By Online Channel for the Period 2022 - 2032F
- Historical Data and Forecast of Lithuania Ceramic Wash Basin Market Revenues & Volume By Offline Channel for the Period 2022 - 2032F
- Lithuania Ceramic Wash Basin Import Export Trade Statistics
- Market Opportunity Assessment By Type
- Market Opportunity Assessment By End-use
- Market Opportunity Assessment By Distribution Channel
- Lithuania Ceramic Wash Basin Top Companies Market Share
- Lithuania Ceramic Wash Basin Competitive Benchmarking By Technical and Operational Parameters
- Lithuania Ceramic Wash Basin Company Profiles
- Lithuania Ceramic Wash Basin Key Strategic Recommendations
Frequently Asked Questions About the Market Study (FAQs):
6Wresearch actively monitors the Lithuania Ceramic Wash Basin Market and publishes its comprehensive annual report, highlighting emerging trends, growth drivers, revenue analysis, and forecast outlook. Our insights help businesses to make data-backed strategic decisions with ongoing market dynamics. Our analysts track relevent industries related to the Lithuania Ceramic Wash Basin Market, allowing our clients with actionable intelligence and reliable forecasts tailored to emerging regional needs.
Yes, we provide customisation as per your requirements. To learn more, feel free to contact us on sales@6wresearch.com
1 Executive Summary |
2 Introduction |
2.1 Key Highlights of the Report |
2.2 Report Description |
2.3 Market Scope & Segmentation |
2.4 Research Methodology |
2.5 Assumptions |
3 Lithuania Ceramic Wash Basin Market Overview |
3.1 Lithuania Country Macro Economic Indicators |
3.2 Lithuania Ceramic Wash Basin Market Revenues & Volume, 2022 & 2032F |
3.3 Lithuania Ceramic Wash Basin Market - Industry Life Cycle |
3.4 Lithuania Ceramic Wash Basin Market - Porter's Five Forces |
3.5 Lithuania Ceramic Wash Basin Market Revenues & Volume Share, By Type, 2022 & 2032F |
3.6 Lithuania Ceramic Wash Basin Market Revenues & Volume Share, By End-use, 2022 & 2032F |
3.7 Lithuania Ceramic Wash Basin Market Revenues & Volume Share, By Distribution Channel, 2022 & 2032F |
4 Lithuania Ceramic Wash Basin Market Dynamics |
4.1 Impact Analysis |
4.2 Market Drivers |
4.2.1 Growing construction activities in Lithuania leading to increased demand for ceramic wash basins |
4.2.2 Rising disposable income of consumers, driving the preference for premium ceramic wash basin products |
4.2.3 Increasing focus on interior design and aesthetics in residential and commercial spaces, boosting the demand for stylish ceramic wash basins |
4.3 Market Restraints |
4.3.1 Fluctuations in raw material prices impacting the production cost of ceramic wash basins |
4.3.2 Competition from alternative materials such as stainless steel or glass wash basins affecting market growth |
5 Lithuania Ceramic Wash Basin Market Trends |
6 Lithuania Ceramic Wash Basin Market Segmentations |
6.1 Lithuania Ceramic Wash Basin Market, By Type |
6.1.1 Overview and Analysis |
6.1.2 Lithuania Ceramic Wash Basin Market Revenues & Volume, By Full-pedestal Wash Basin, 2022 - 2032F |
6.1.3 Lithuania Ceramic Wash Basin Market Revenues & Volume, By Table-top Wash Basin, 2022 - 2032F |
6.1.4 Lithuania Ceramic Wash Basin Market Revenues & Volume, By Wall-mounted Wash Basin, 2022 - 2032F |
6.1.5 Lithuania Ceramic Wash Basin Market Revenues & Volume, By Wall-hung Wash Basin, 2022 - 2032F |
6.2 Lithuania Ceramic Wash Basin Market, By End-use |
6.2.1 Overview and Analysis |
6.2.2 Lithuania Ceramic Wash Basin Market Revenues & Volume, By Residential, 2022 - 2032F |
6.2.3 Lithuania Ceramic Wash Basin Market Revenues & Volume, By Commercial, 2022 - 2032F |
6.3 Lithuania Ceramic Wash Basin Market, By Distribution Channel |
6.3.1 Overview and Analysis |
6.3.2 Lithuania Ceramic Wash Basin Market Revenues & Volume, By Online Channel, 2022 - 2032F |
6.3.3 Lithuania Ceramic Wash Basin Market Revenues & Volume, By Offline Channel, 2022 - 2032F |
7 Lithuania Ceramic Wash Basin Market Import-Export Trade Statistics |
7.1 Lithuania Ceramic Wash Basin Market Export to Major Countries |
7.2 Lithuania Ceramic Wash Basin Market Imports from Major Countries |
8 Lithuania Ceramic Wash Basin Market Key Performance Indicators |
8.1 Average selling price (ASP) of ceramic wash basins |
8.2 Number of new construction projects in Lithuania |
8.3 Consumer sentiment towards home renovation and interior design trends |
9 Lithuania Ceramic Wash Basin Market - Opportunity Assessment |
9.1 Lithuania Ceramic Wash Basin Market Opportunity Assessment, By Type, 2022 & 2032F |
9.2 Lithuania Ceramic Wash Basin Market Opportunity Assessment, By End-use, 2022 & 2032F |
9.3 Lithuania Ceramic Wash Basin Market Opportunity Assessment, By Distribution Channel, 2022 & 2032F |
10 Lithuania Ceramic Wash Basin Market - Competitive Landscape |
10.1 Lithuania Ceramic Wash Basin Market Revenue Share, By Companies, 2025 |
10.2 Lithuania Ceramic Wash Basin Market Competitive Benchmarking, By Operating and Technical Parameters |
11 Company Profiles |
12 Recommendations | 13 Disclaimer |
Global Go To Market Strategy - 2030
Export potential enables firms to identify high-growth global markets with greater confidence by combining advanced trade intelligence with a structured quantitative methodology. The framework analyzes emerging demand trends and country-level import patterns while integrating macroeconomic and trade datasets such as GDP and population forecasts, bilateral import–export flows, tariff structures, elasticity differentials between developed and developing economies, geographic distance, and import demand projections. Using weighted trade values from 2020–2024 as the base period to project country-to-country export potential for 2030, these inputs are operationalized through calculated drivers such as gravity model parameters, tariff impact factors, and projected GDP per-capita growth. Through an analysis of hidden potentials, demand hotspots, and market conditions that are most favorable to success, this method enables firms to focus on target countries, maximize returns, and global expansion with data, backed by accuracy.
By factoring in the projected importer demand gap that is currently unmet and could be potential opportunity, it identifies the potential for the Exporter (Country) among 190 countries, against the general trade analysis, which identifies the biggest importer or exporter.
To discover high-growth global markets and optimize your business strategy:
Click Here
Pricing
- Single User License$ 1,995
- Department License$ 2,400
- Site License$ 3,120
- Global License$ 3,795

Leadership Perspectives from Industry Events
Search
Thought Leadership and Analyst Meet


Our Clients
6WResearch In News
- India Export Attractiveness Tracker 2026
- India Air Conditioner Market Set for Strong Rebound in 2026 After Weather-Led Correction and GST-Driven Recovery: 6Wresearch
- ADAS in India: How Automatic Emergency Braking, Blind Spot Detection & Driver Monitoring are Transforming Road Safety
- Doha a strategic location for EV manufacturing hub: IPA Qatar
- Demand for luxury TVs surging in the GCC, says Samsung
- Empowering Growth: The Thriving Journey of Bangladesh’s Cable Industry
Latest Reports
- Nicaragua RPG Gaming Market (2026-2032)
- New Zealand RPG Gaming Market (2026-2032)
- Netherlands RPG Gaming Market (2026-2032)
- Nauru RPG Gaming Market (2026-2032)
- Namibia RPG Gaming Market (2026-2032)
- Mozambique RPG Gaming Market (2026-2032)
- Montenegro RPG Gaming Market (2026-2032)
- Mongolia RPG Gaming Market (2026-2032)
- Monaco RPG Gaming Market (2026-2032)
- Micronesia RPG Gaming Market (2026-2032)
Industry Events and Analyst Meet

EV India Expo 2026

HIMTEX 2026

India Refining Summit 2026

India EV Show 2026

EV tech India Expo 2026
Whitepaper
- Middle East & Africa Commercial Security Market Click here to view more.
- Middle East & Africa Fire Safety Systems & Equipment Market Click here to view more.
- GCC Drone Market Click here to view more.
- Middle East Lighting Fixture Market Click here to view more.
- GCC Physical & Perimeter Security Market Click here to view more.