Lithuania Champagne Market (2026-2032) | Share, Size & Revenue, Trends, Companies, Value, Outlook, Forecast, Analysis, Competitive Landscape, Industry, Segmentation, Growth
Market Forecast By Product Outlook (Prestige Cuvee, Blanc De Noirs, Blanc De Blancs, Ros Champagne, Others), By Distribution Channel Outlook (Off-trade, On-trade) And Competitive Landscape
| Product Code: ETC8037144 | Publication Date: Sep 2024 | Updated Date: Apr 2026 | Product Type: Market Research Report | |
| Publisher: 6Wresearch | Author: Sumit Sagar | No. of Pages: 75 | No. of Figures: 35 | No. of Tables: 20 |
Lithuania Champagne Market Size (2020-2030)
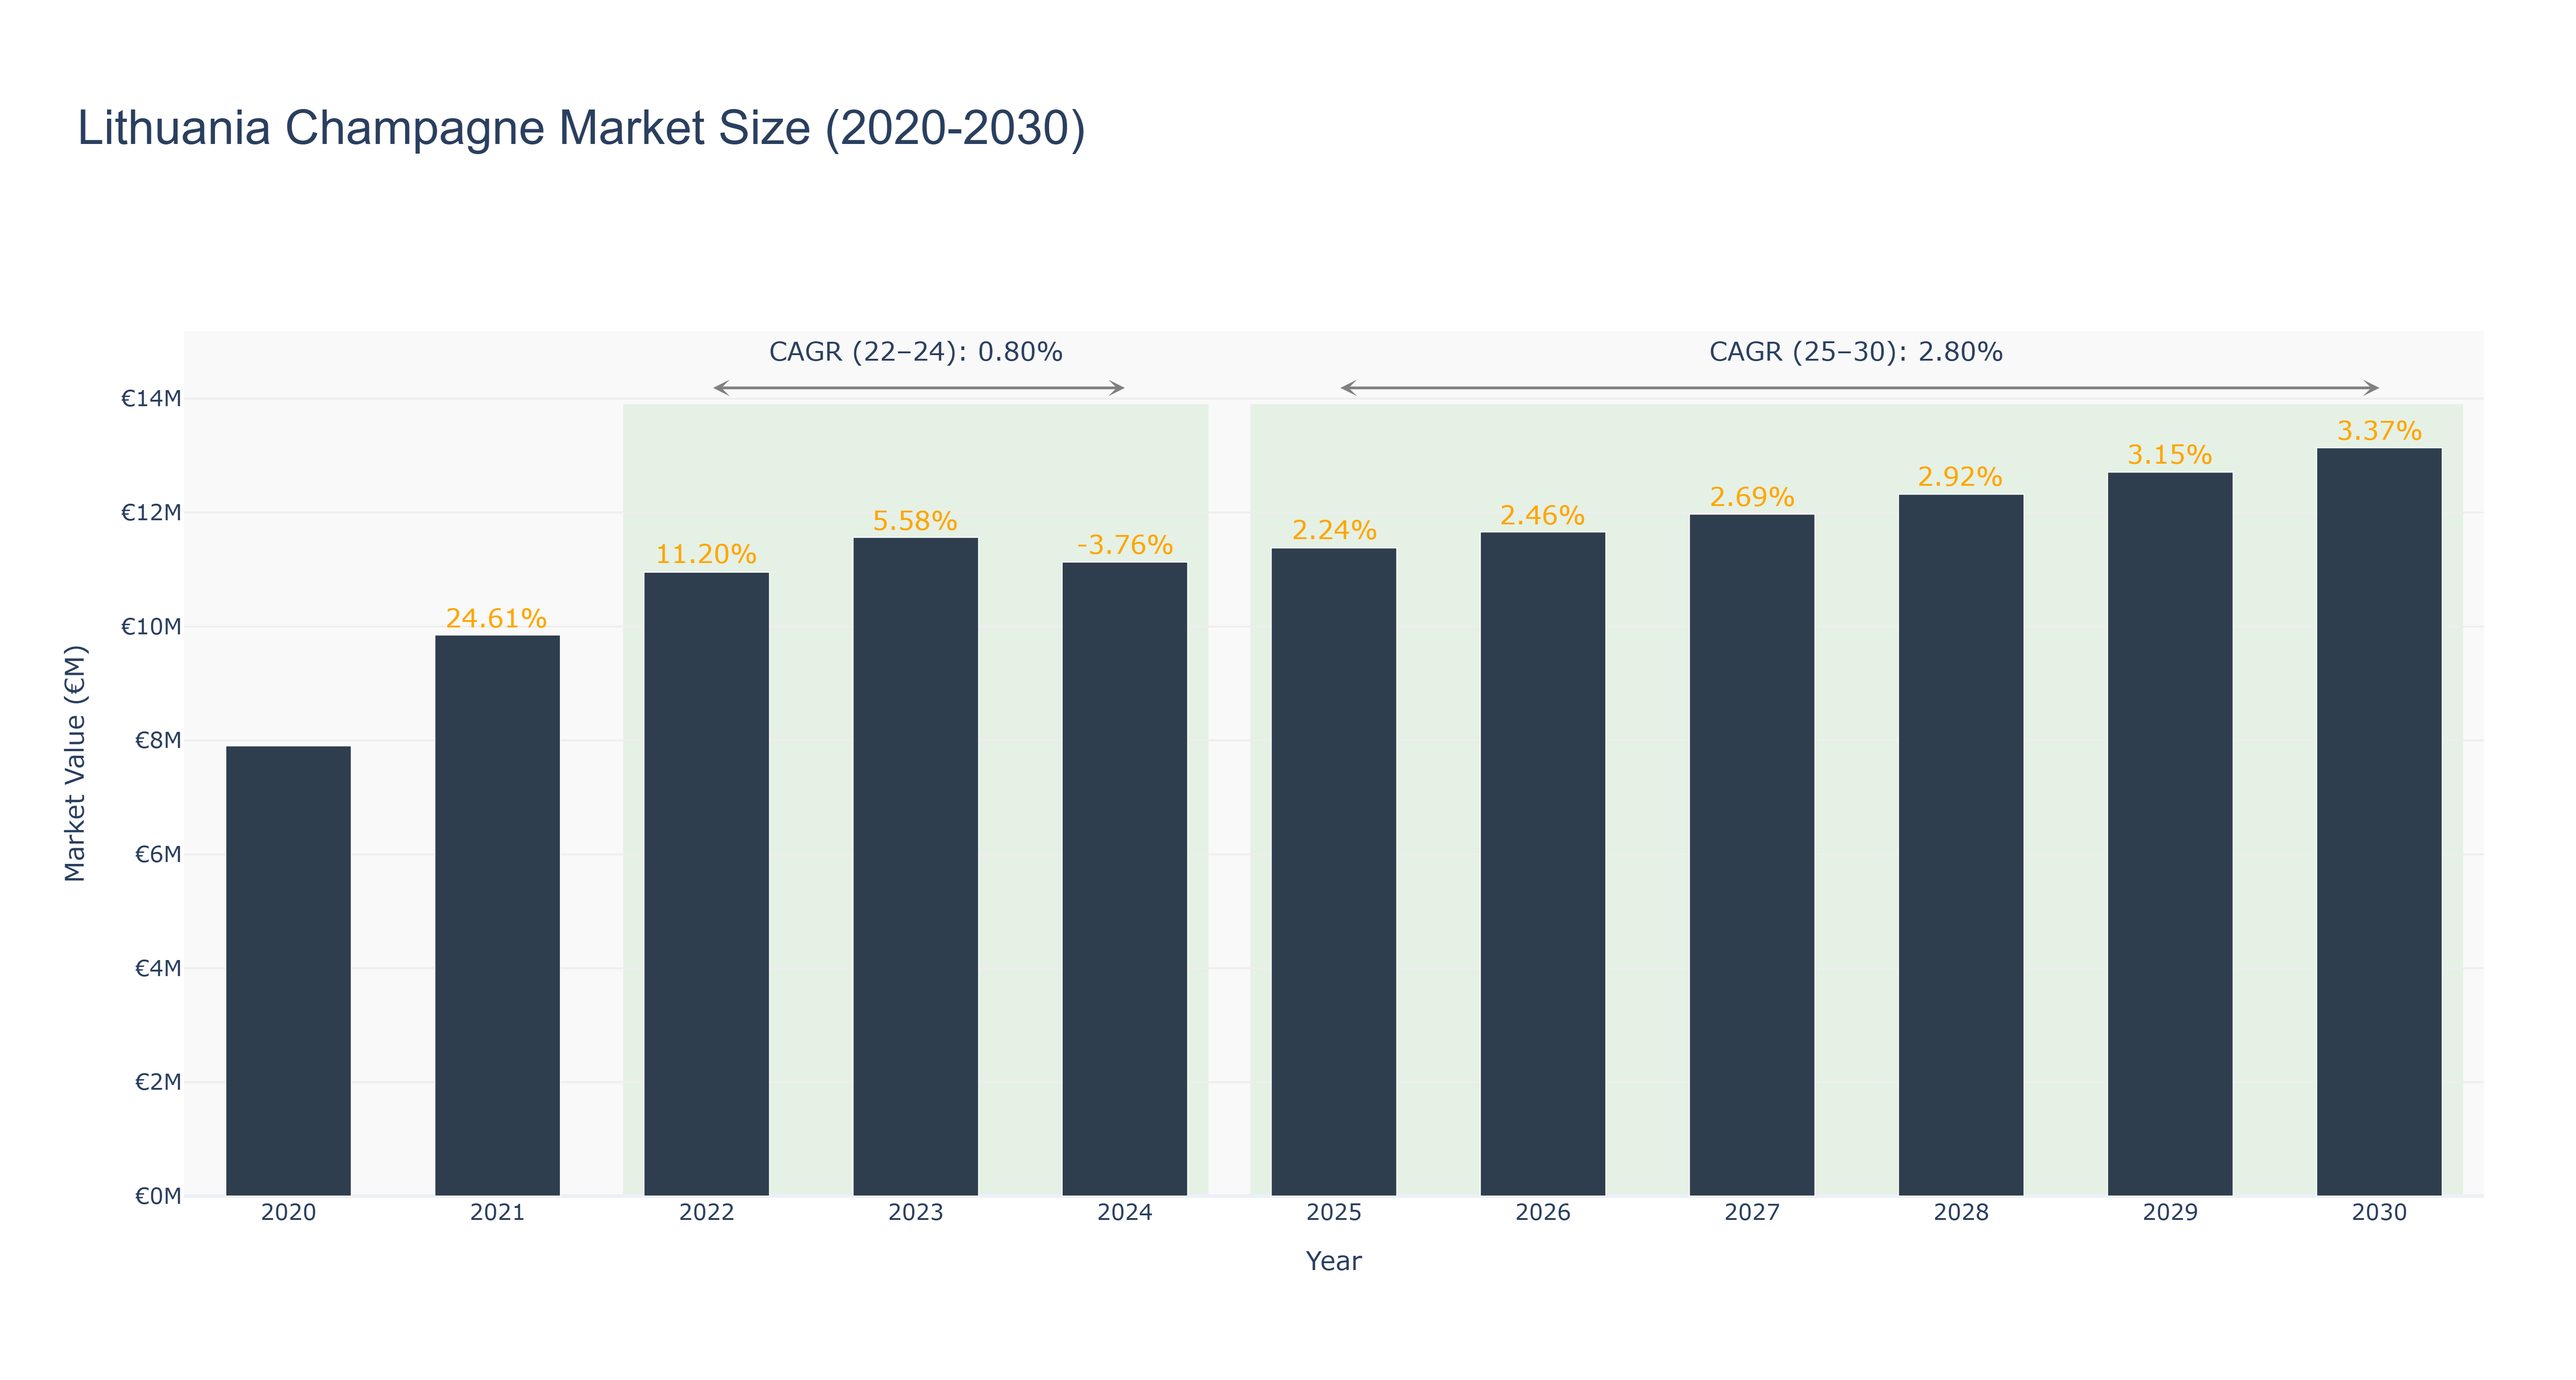
The Lithuania Champagne Market experienced significant fluctuations between 2020 and 2024, peaking at €11.56 million in 2023, before declining to €11.13 million in 2024, marking a contraction of -3.76%. The actual market growth during this period exhibited a CAGR of 0.80%, reflecting both a post-pandemic recovery phase and shifts in consumer preference towards alternative beverages. Looking ahead, the forecasted market from 2025 to 2030 projects a modest growth trajectory with a CAGR of 2.80%, culminating in an estimated market size of €13.14 million by 2030. This growth is anticipated to be driven by increasing disposable incomes, a rising trend of premiumization among consumers, and a growing appreciation for quality sparkling wines. As the market stabilizes, potential developments such as enhanced marketing strategies and collaborations with local distributors may further bolster growth in this sector.
Lithuania Champagne Market: Production & Trade Performance (2019-2025)
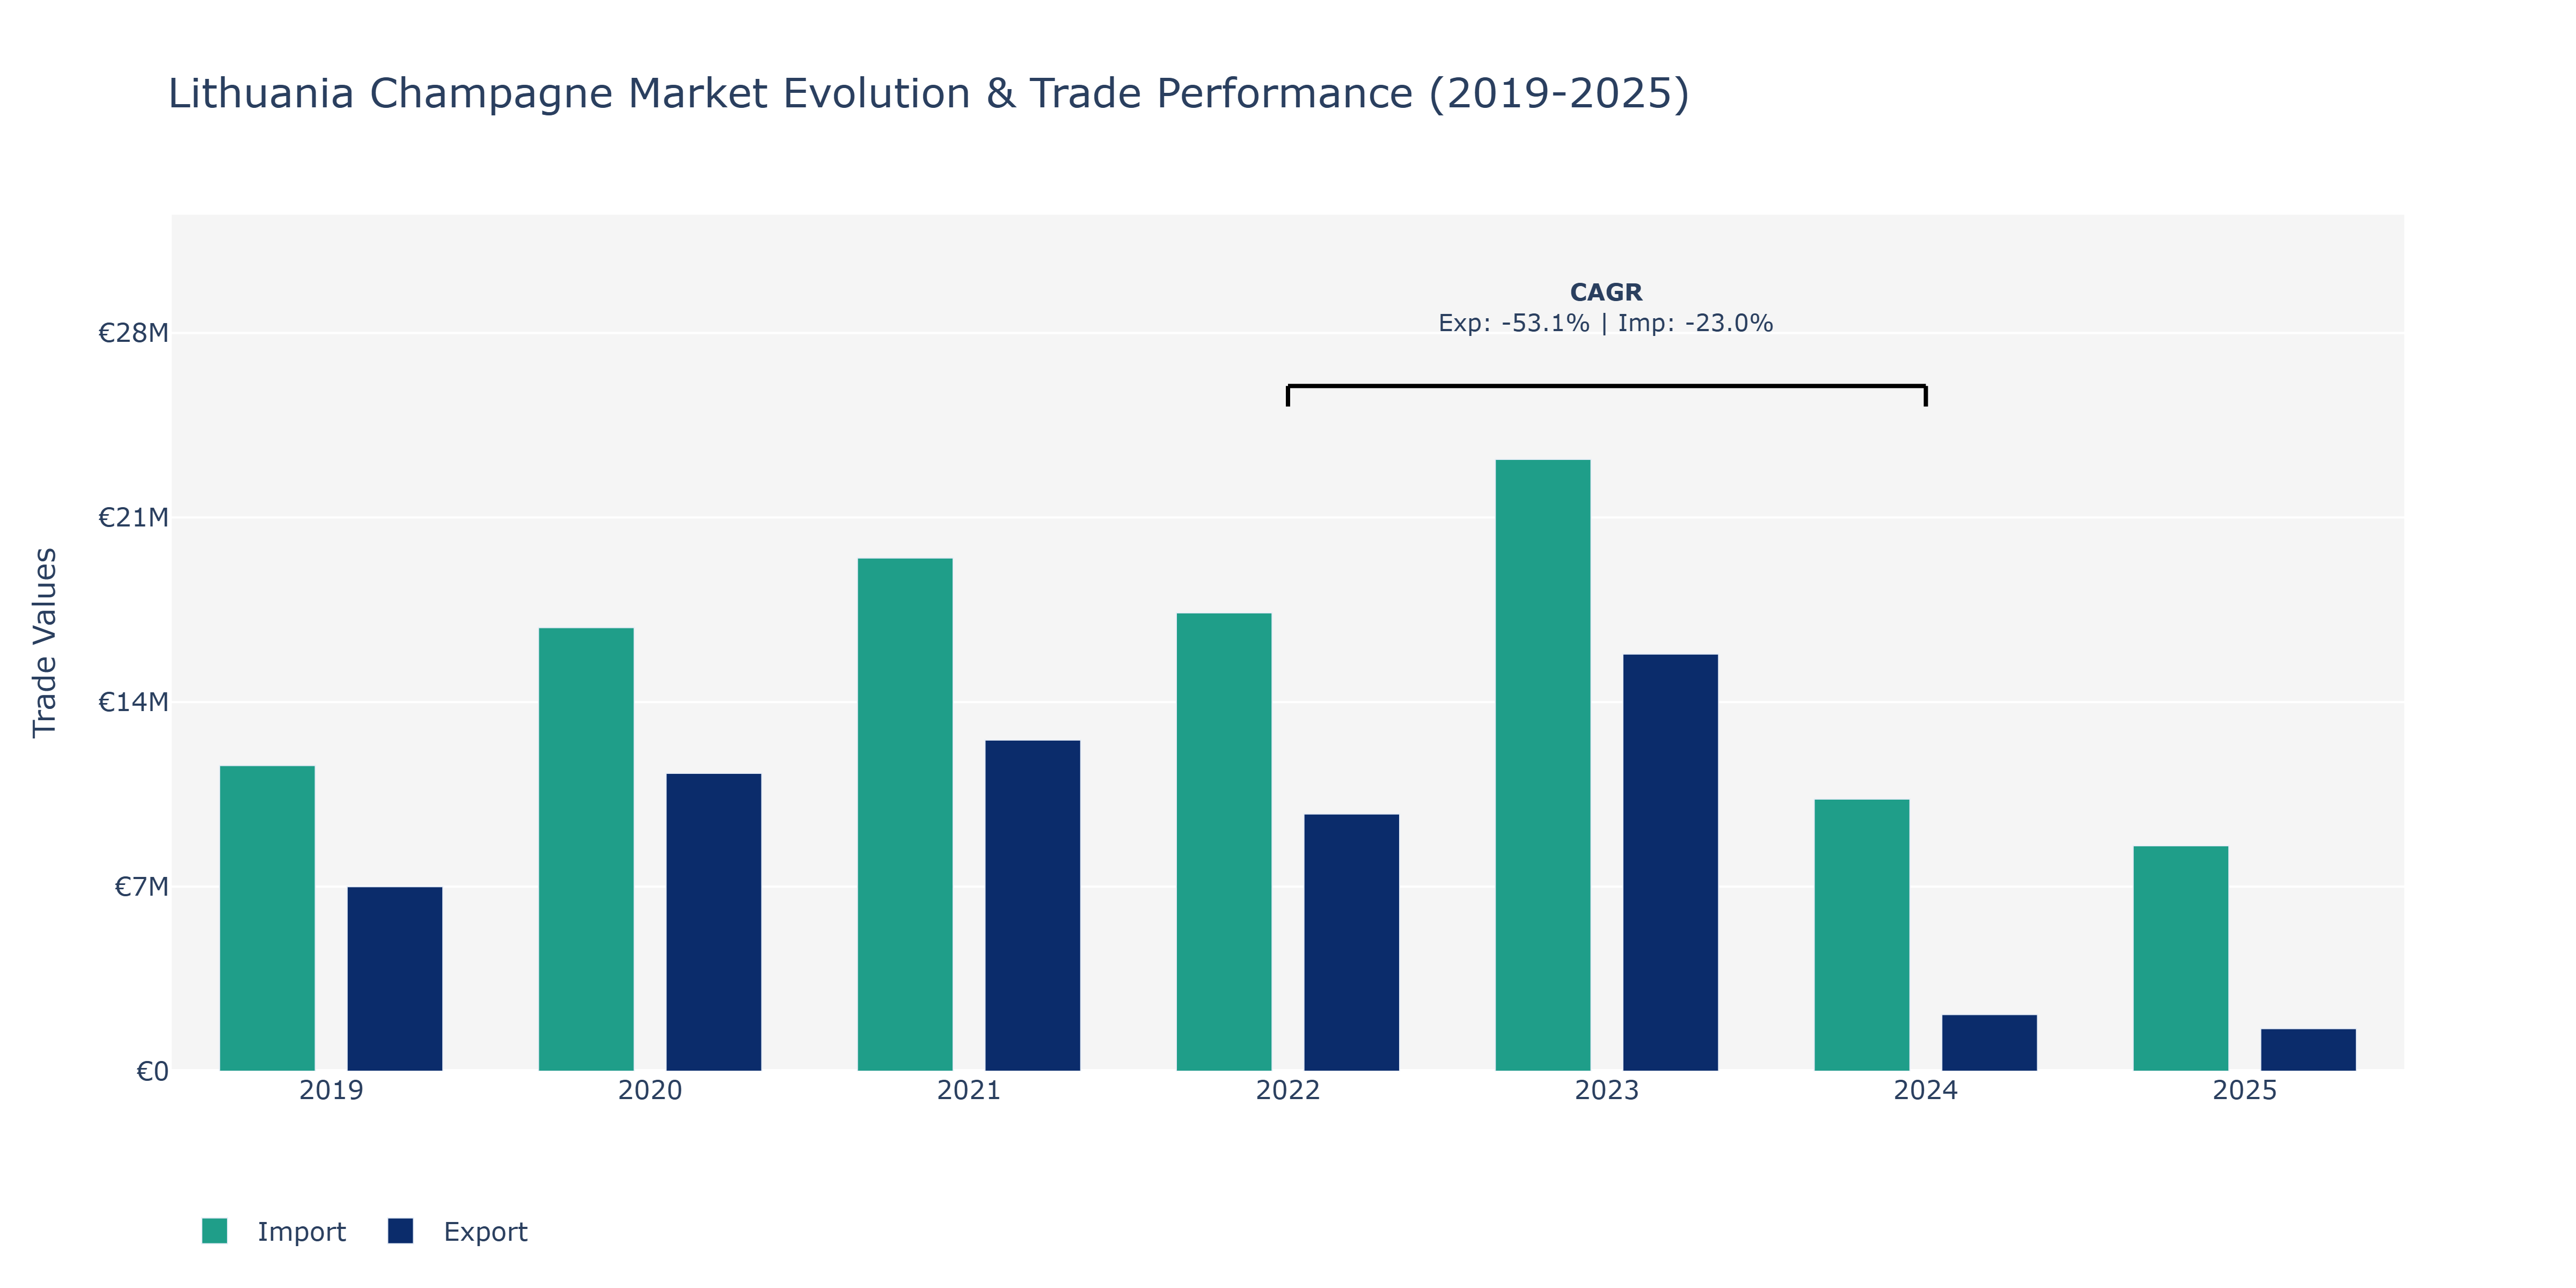
The Lithuania Champagne Market witnessed notable fluctuations in both exports and imports between 2019 and 2025. In 2019, exports stood at €7.0 million, showing a subsequent increase in 2020 to €11.3 million before a decline in 2022 to €9.76 million. However, a substantial recovery was observed in 2023, with exports reaching €15.82 million, only to drop significantly in 2024 to €2.15 million. Conversely, imports followed a similar trend, starting at €11.59 million in 2019, rising to €16.83 million in 2020, and peaking in 2023 at €23.21 million, then falling to €8.55 million in 2025. The market experienced these fluctuations due to various factors, including global economic conditions, changes in consumer preferences, and disruptions in the supply chain. For instance, the decline in exports in 2024 could be attributed to trade barriers or shifts in market demand. To sustain market growth, stakeholders should focus on enhancing export capabilities and adapting to changing market dynamics to mitigate the impact of future uncertainties.
Key Highlights of the Report:
- Lithuania Champagne Market Outlook
- Market Size of Lithuania Champagne Market, 2025
- Forecast of Lithuania Champagne Market, 2032
- Historical Data and Forecast of Lithuania Champagne Revenues & Volume for the Period 2022 - 2032
- Lithuania Champagne Market Trend Evolution
- Lithuania Champagne Market Drivers and Challenges
- Lithuania Champagne Price Trends
- Lithuania Champagne Porter's Five Forces
- Lithuania Champagne Industry Life Cycle
- Historical Data and Forecast of Lithuania Champagne Market Revenues & Volume By Product Outlook for the Period 2022 - 2032
- Historical Data and Forecast of Lithuania Champagne Market Revenues & Volume By Prestige Cuvee for the Period 2022 - 2032
- Historical Data and Forecast of Lithuania Champagne Market Revenues & Volume By Blanc De Noirs for the Period 2022 - 2032
- Historical Data and Forecast of Lithuania Champagne Market Revenues & Volume By Blanc De Blancs for the Period 2022 - 2032
- Historical Data and Forecast of Lithuania Champagne Market Revenues & Volume By Ros Champagne for the Period 2022 - 2032
- Historical Data and Forecast of Lithuania Champagne Market Revenues & Volume By Others for the Period 2022 - 2032
- Historical Data and Forecast of Lithuania Champagne Market Revenues & Volume By Distribution Channel Outlook for the Period 2022 - 2032
- Historical Data and Forecast of Lithuania Champagne Market Revenues & Volume By Off-trade for the Period 2022 - 2032
- Historical Data and Forecast of Lithuania Champagne Market Revenues & Volume By On-trade for the Period 2022 - 2032
- Lithuania Champagne Import Export Trade Statistics
- Market Opportunity Assessment By Product Outlook
- Market Opportunity Assessment By Distribution Channel Outlook
- Lithuania Champagne Top Companies Market Share
- Lithuania Champagne Competitive Benchmarking By Technical and Operational Parameters
- Lithuania Champagne Company Profiles
- Lithuania Champagne Key Strategic Recommendations
Frequently Asked Questions About the Market Study (FAQs):
6Wresearch actively monitors the Lithuania Champagne Market and publishes its comprehensive annual report, highlighting emerging trends, growth drivers, revenue analysis, and forecast outlook. Our insights help businesses to make data-backed strategic decisions with ongoing market dynamics. Our analysts track relevent industries related to the Lithuania Champagne Market, allowing our clients with actionable intelligence and reliable forecasts tailored to emerging regional needs.
Yes, we provide customisation as per your requirements. To learn more, feel free to contact us on sales@6wresearch.com
1 Executive Summary |
2 Introduction |
2.1 Key Highlights of the Report |
2.2 Report Description |
2.3 Market Scope & Segmentation |
2.4 Research Methodology |
2.5 Assumptions |
3 Lithuania Champagne Market Overview |
3.1 Lithuania Country Macro Economic Indicators |
3.2 Lithuania Champagne Market Revenues & Volume, 2022 & 2032F |
3.3 Lithuania Champagne Market - Industry Life Cycle |
3.4 Lithuania Champagne Market - Porter's Five Forces |
3.5 Lithuania Champagne Market Revenues & Volume Share, By Product Outlook, 2022 & 2032F |
3.6 Lithuania Champagne Market Revenues & Volume Share, By Distribution Channel Outlook, 2022 & 2032F |
4 Lithuania Champagne Market Dynamics |
4.1 Impact Analysis |
4.2 Market Drivers |
4.2.1 Increasing disposable income among Lithuanian consumers |
4.2.2 Growing demand for premium and luxury products in the region |
4.2.3 Rising popularity of champagne consumption for celebrations and special occasions |
4.3 Market Restraints |
4.3.1 High import taxes and duties on champagne in Lithuania |
4.3.2 Limited awareness and education about champagne culture and varieties in the market |
5 Lithuania Champagne Market Trends |
6 Lithuania Champagne Market, By Types |
6.1 Lithuania Champagne Market, By Product Outlook |
6.1.1 Overview and Analysis |
6.1.2 Lithuania Champagne Market Revenues & Volume, By Product Outlook, 2022 - 2032F |
6.1.3 Lithuania Champagne Market Revenues & Volume, By Prestige Cuvee, 2022 - 2032F |
6.1.4 Lithuania Champagne Market Revenues & Volume, By Blanc De Noirs, 2022 - 2032F |
6.1.5 Lithuania Champagne Market Revenues & Volume, By Blanc De Blancs, 2022 - 2032F |
6.1.6 Lithuania Champagne Market Revenues & Volume, By Ros Champagne, 2022 - 2032F |
6.1.7 Lithuania Champagne Market Revenues & Volume, By Others, 2022 - 2032F |
6.2 Lithuania Champagne Market, By Distribution Channel Outlook |
6.2.1 Overview and Analysis |
6.2.2 Lithuania Champagne Market Revenues & Volume, By Off-trade, 2022 - 2032F |
6.2.3 Lithuania Champagne Market Revenues & Volume, By On-trade, 2022 - 2032F |
7 Lithuania Champagne Market Import-Export Trade Statistics |
7.1 Lithuania Champagne Market Export to Major Countries |
7.2 Lithuania Champagne Market Imports from Major Countries |
8 Lithuania Champagne Market Key Performance Indicators |
8.1 Average spending per capita on champagne in Lithuania |
8.2 Number of champagne brands available in the market |
8.3 Growth rate of champagne consumption during festive seasons |
9 Lithuania Champagne Market - Opportunity Assessment |
9.1 Lithuania Champagne Market Opportunity Assessment, By Product Outlook, 2022 & 2032F |
9.2 Lithuania Champagne Market Opportunity Assessment, By Distribution Channel Outlook, 2022 & 2032F |
10 Lithuania Champagne Market - Competitive Landscape |
10.1 Lithuania Champagne Market Revenue Share, By Companies, 2025 |
10.2 Lithuania Champagne Market Competitive Benchmarking, By Operating and Technical Parameters |
11 Company Profiles |
12 Recommendations |
13 Disclaimer |
Global Go To Market Strategy - 2030
Export potential enables firms to identify high-growth global markets with greater confidence by combining advanced trade intelligence with a structured quantitative methodology. The framework analyzes emerging demand trends and country-level import patterns while integrating macroeconomic and trade datasets such as GDP and population forecasts, bilateral import–export flows, tariff structures, elasticity differentials between developed and developing economies, geographic distance, and import demand projections. Using weighted trade values from 2020–2024 as the base period to project country-to-country export potential for 2030, these inputs are operationalized through calculated drivers such as gravity model parameters, tariff impact factors, and projected GDP per-capita growth. Through an analysis of hidden potentials, demand hotspots, and market conditions that are most favorable to success, this method enables firms to focus on target countries, maximize returns, and global expansion with data, backed by accuracy.
By factoring in the projected importer demand gap that is currently unmet and could be potential opportunity, it identifies the potential for the Exporter (Country) among 190 countries, against the general trade analysis, which identifies the biggest importer or exporter.
To discover high-growth global markets and optimize your business strategy:
Click Here
Pricing
- Single User License$ 1,995
- Department License$ 2,400
- Site License$ 3,120
- Global License$ 3,795

Leadership Perspectives from Industry Events
Search
Thought Leadership and Analyst Meet


Our Clients
6WResearch In News
- Doha a strategic location for EV manufacturing hub: IPA Qatar
- Demand for luxury TVs surging in the GCC, says Samsung
- Empowering Growth: The Thriving Journey of Bangladesh’s Cable Industry
- Demand for luxury TVs surging in the GCC, says Samsung
- Video call with a traditional healer? Once unthinkable, it’s now common in South Africa
- Intelligent Buildings To Smooth GCC’s Path To Net Zero
Latest Reports
- Taiwan Airport Wireless Infrastructure Market (2026-2032)
- Vietnam Airport Wireless Infrastructure Market (2026-2032)
- Thailand Airport Wireless Infrastructure Market (2026-2032)
- South Korea Airport Wireless Infrastructure Market (2026-2032)
- Romania Airport Wireless Infrastructure Market (2026-2032)
- Qatar Airport Wireless Infrastructure Market (2026-2032)
- Philippines Airport Wireless Infrastructure Market (2026-2032)
- Japan Airport Wireless Infrastructure Market (2026-2032)
- Taiwan Airport Winter Services Market (2026-2032)
- Vietnam Airport Winter Services Market (2026-2032)
Industry Events and Analyst Meet

HIMTEX 2026

India Refining Summit 2026

India EV Show 2026

EV tech India Expo 2026

Auto Tech Asia 2026
Whitepaper
- Middle East & Africa Commercial Security Market Click here to view more.
- Middle East & Africa Fire Safety Systems & Equipment Market Click here to view more.
- GCC Drone Market Click here to view more.
- Middle East Lighting Fixture Market Click here to view more.
- GCC Physical & Perimeter Security Market Click here to view more.