Lithuania Coffee extracts Market (2026-2032) | Outlook, Companies, Forecast, Analysis, Value, Industry, Growth, Share, Revenue, Size, Segmentation & Trends
Market Forecast By Nature Type (Organic, Conventional), By Source Type (Green coffee beans, Roasted coffee beans), By Application (Food Industry, Beverage Industry, Pharmaceutical and skincare, Others), By Product Form (Liquid, Dried, Capsule), By End-users (Commercial, Individual), By Distribution Channel (Business to Business, Business to Consumer) And Competitive Landscape
| Product Code: ETC4711850 | Publication Date: Nov 2023 | Updated Date: Apr 2026 | Product Type: Market Research Report | |
| Publisher: 6Wresearch | Author: Shubham Padhi | No. of Pages: 60 | No. of Figures: 30 | No. of Tables: 5 |
Lithuania Coffee Extracts Market Size (2020-2030)
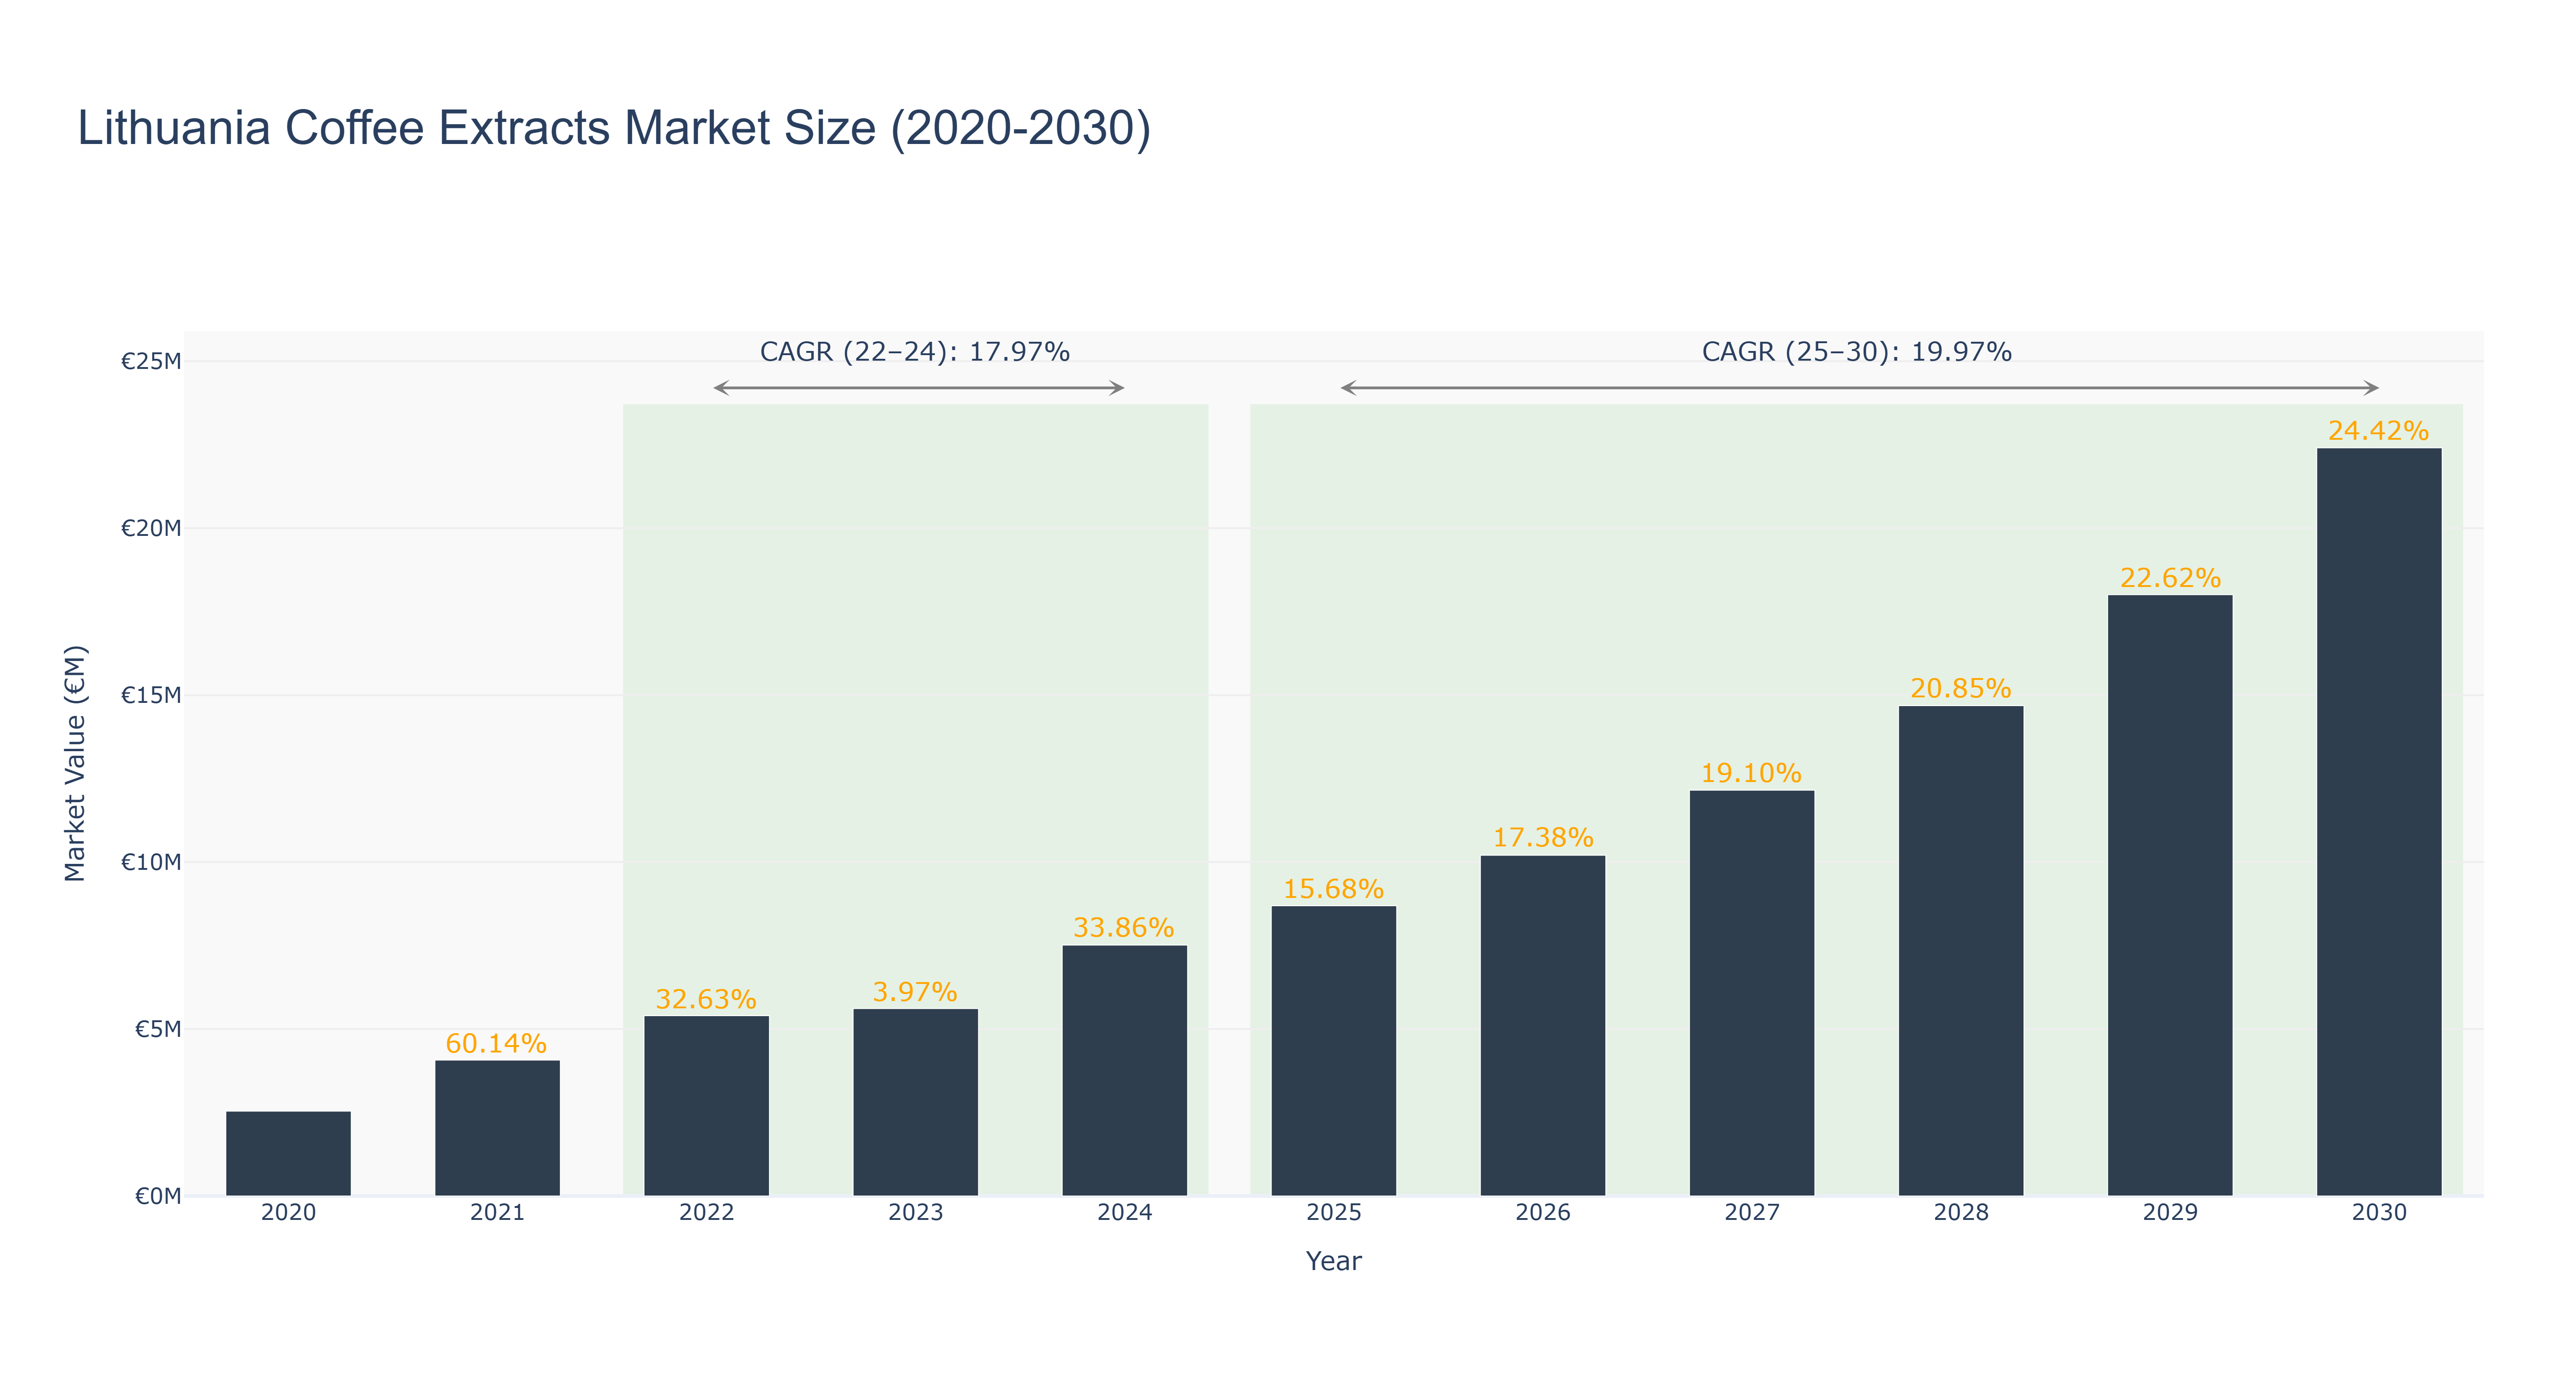
Lithuania Coffee Extracts Market has shown a steady growth trajectory over the years. The peak market size of €22.41 million is forecasted for 2030, with a notable increase in market size from €2.54 million in 2020 to €7.51 million in 2024. The CAGR values reflect this growth, with a CAGR of 17.97% from 2022 to 2024 and a projected CAGR of 19.97% from 2025 to 2030. The market's expansion can be attributed to increasing consumer demand for premium coffee products and a growing trend towards healthier beverage options. Recent developments in the market include partnerships with local coffee producers to enhance product quality and sustainability practices. Future initiatives may focus on leveraging digital marketing strategies to reach a wider audience and capitalize on the growing trend of at-home coffee consumption.
Lithuania Coffee Extracts Market: Production & Trade Performance (2019-2025)
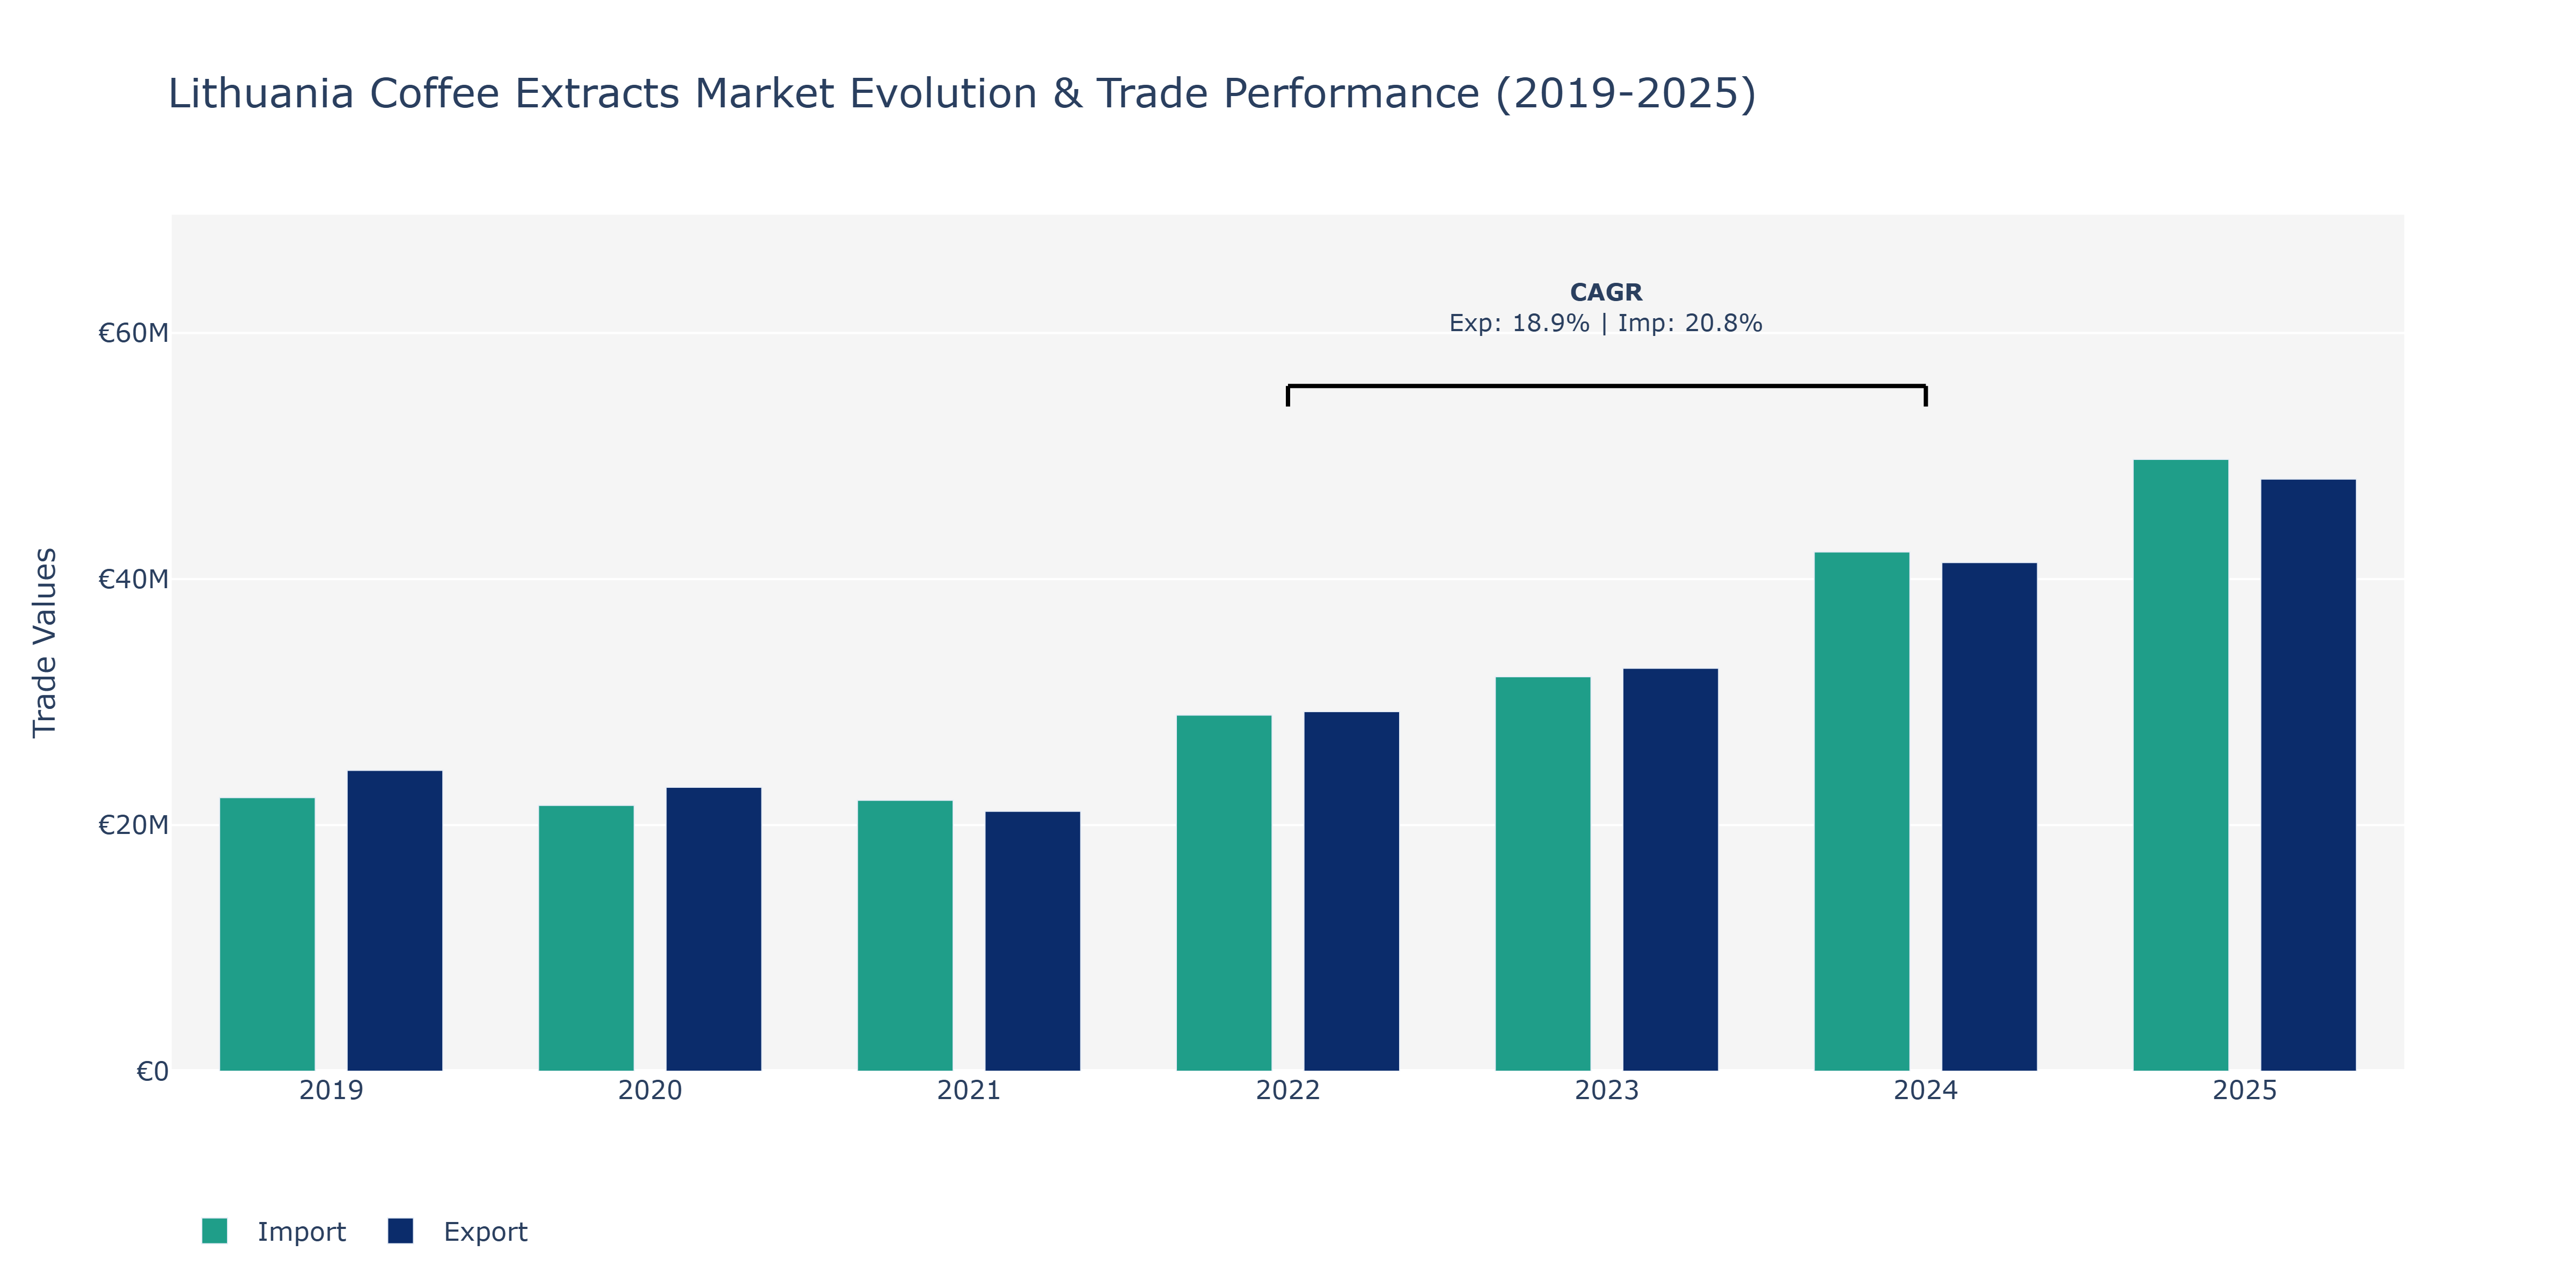
Between 2019 and 2025, Lithuania's Coffee Extracts Market witnessed varying trends in exports and imports. Export value started at approximately €24.45 million in 2019, dipping to around €21.13 million in 2021 before surging to nearly €48.13 million in 2025. On the other hand, imports stood at about €22.24 million in 2019, increased slightly in 2021 to roughly €22.02 million, and peaked at nearly €49.73 million in 2025. The years 2024 and 2025 marked significant peaks for both exports and imports. These shifts can be attributed to evolving consumer preferences towards coffee-based products, technological advancements in extraction processes, and strategic market expansions by key players. The increasing demand for specialty coffee products globally, coupled with Lithuania's focus on enhancing its export capabilities, likely contributed to the notable growth in both export and Import value during the latter years.
Key Highlights of the Report:
- Lithuania Coffee extracts Market Outlook
- Market Size of Lithuania Coffee extracts Market, 2025
- Forecast of Lithuania Coffee extracts Market, 2032
- Historical Data and Forecast of Lithuania Coffee extracts Revenues & Volume for the Period 2022 - 2032F
- Lithuania Coffee extracts Market Trend Evolution
- Lithuania Coffee extracts Market Drivers and Challenges
- Lithuania Coffee extracts Price Trends
- Lithuania Coffee extracts Porter`s Five Forces
- Lithuania Coffee extracts Industry Life Cycle
- Historical Data and Forecast of Lithuania Coffee extracts Market Revenues & Volume By Nature Type for the Period 2022 - 2032F
- Historical Data and Forecast of Lithuania Coffee extracts Market Revenues & Volume By Organic for the Period 2022 - 2032F
- Historical Data and Forecast of Lithuania Coffee extracts Market Revenues & Volume By Conventional for the Period 2022 - 2032F
- Historical Data and Forecast of Lithuania Coffee extracts Market Revenues & Volume By Source Type for the Period 2022 - 2032F
- Historical Data and Forecast of Lithuania Coffee extracts Market Revenues & Volume By Green coffee beans for the Period 2022 - 2032F
- Historical Data and Forecast of Lithuania Coffee extracts Market Revenues & Volume By Roasted coffee beans for the Period 2022 - 2032F
- Historical Data and Forecast of Lithuania Coffee extracts Market Revenues & Volume By Application for the Period 2022 - 2032F
- Historical Data and Forecast of Lithuania Coffee extracts Market Revenues & Volume By Food Industry for the Period 2022 - 2032F
- Historical Data and Forecast of Lithuania Coffee extracts Market Revenues & Volume By Beverage Industry for the Period 2022 - 2032F
- Historical Data and Forecast of Lithuania Coffee extracts Market Revenues & Volume By Pharmaceutical and skincare for the Period 2022 - 2032F
- Historical Data and Forecast of Lithuania Coffee extracts Market Revenues & Volume By Others for the Period 2022 - 2032F
- Historical Data and Forecast of Lithuania Coffee extracts Market Revenues & Volume By Product Form for the Period 2022 - 2032F
- Historical Data and Forecast of Lithuania Coffee extracts Market Revenues & Volume By Liquid for the Period 2022 - 2032F
- Historical Data and Forecast of Lithuania Coffee extracts Market Revenues & Volume By Dried for the Period 2022 - 2032F
- Historical Data and Forecast of Lithuania Coffee extracts Market Revenues & Volume By Capsule for the Period 2022 - 2032F
- Historical Data and Forecast of Lithuania Coffee extracts Market Revenues & Volume By End-users for the Period 2022 - 2032F
- Historical Data and Forecast of Lithuania Coffee extracts Market Revenues & Volume By Commercial for the Period 2022 - 2032F
- Historical Data and Forecast of Lithuania Coffee extracts Market Revenues & Volume By Individual for the Period 2022 - 2032F
- Historical Data and Forecast of Lithuania Coffee extracts Market Revenues & Volume By Distribution Channel for the Period 2022 - 2032F
- Historical Data and Forecast of Lithuania Coffee extracts Market Revenues & Volume By Business to Business for the Period 2022 - 2032F
- Historical Data and Forecast of Lithuania Coffee extracts Market Revenues & Volume By Business to Consumer for the Period 2022 - 2032F
- Lithuania Coffee extracts Import Export Trade Statistics
- Market Opportunity Assessment By Nature Type
- Market Opportunity Assessment By Source Type
- Market Opportunity Assessment By Application
- Market Opportunity Assessment By Product Form
- Market Opportunity Assessment By End-users
- Market Opportunity Assessment By Distribution Channel
- Lithuania Coffee extracts Top Companies Market Share
- Lithuania Coffee extracts Competitive Benchmarking By Technical and Operational Parameters
- Lithuania Coffee extracts Company Profiles
- Lithuania Coffee extracts Key Strategic Recommendations
Frequently Asked Questions About the Market Study (FAQs):
6Wresearch actively monitors the Lithuania Coffee extracts Market and publishes its comprehensive annual report, highlighting emerging trends, growth drivers, revenue analysis, and forecast outlook. Our insights help businesses to make data-backed strategic decisions with ongoing market dynamics. Our analysts track relevent industries related to the Lithuania Coffee extracts Market, allowing our clients with actionable intelligence and reliable forecasts tailored to emerging regional needs.
Yes, we provide customisation as per your requirements. To learn more, feel free to contact us on sales@6wresearch.com
1 Executive Summary |
2 Introduction |
2.1 Key Highlights of the Report |
2.2 Report Description |
2.3 Market Scope & Segmentation |
2.4 Research Methodology |
2.5 Assumptions |
3 Lithuania Coffee extracts Market Overview |
3.1 Lithuania Country Macro Economic Indicators |
3.2 Lithuania Coffee extracts Market Revenues & Volume, 2022 & 2032F |
3.3 Lithuania Coffee extracts Market - Industry Life Cycle |
3.4 Lithuania Coffee extracts Market - Porter's Five Forces |
3.5 Lithuania Coffee extracts Market Revenues & Volume Share, By Nature Type, 2022 & 2032F |
3.6 Lithuania Coffee extracts Market Revenues & Volume Share, By Source Type, 2022 & 2032F |
3.7 Lithuania Coffee extracts Market Revenues & Volume Share, By Application, 2022 & 2032F |
3.8 Lithuania Coffee extracts Market Revenues & Volume Share, By Product Form, 2022 & 2032F |
3.9 Lithuania Coffee extracts Market Revenues & Volume Share, By End-users, 2022 & 2032F |
3.10 Lithuania Coffee extracts Market Revenues & Volume Share, By Distribution Channel, 2022 & 2032F |
4 Lithuania Coffee extracts Market Dynamics |
4.1 Impact Analysis |
4.2 Market Drivers |
4.2.1 Increasing consumer preference for convenient and ready-to-drink coffee products |
4.2.2 Growing awareness about health benefits associated with coffee extracts |
4.2.3 Rise in demand for specialty and gourmet coffee products |
4.3 Market Restraints |
4.3.1 Fluctuating prices of coffee beans impacting the cost of coffee extracts |
4.3.2 Regulatory challenges and compliance requirements in the food and beverage industry |
5 Lithuania Coffee extracts Market Trends |
6 Lithuania Coffee extracts Market Segmentations |
6.1 Lithuania Coffee extracts Market, By Nature Type |
6.1.1 Overview and Analysis |
6.1.2 Lithuania Coffee extracts Market Revenues & Volume, By Organic, 2022 - 2032F |
6.1.3 Lithuania Coffee extracts Market Revenues & Volume, By Conventional, 2022 - 2032F |
6.2 Lithuania Coffee extracts Market, By Source Type |
6.2.1 Overview and Analysis |
6.2.2 Lithuania Coffee extracts Market Revenues & Volume, By Green coffee beans, 2022 - 2032F |
6.2.3 Lithuania Coffee extracts Market Revenues & Volume, By Roasted coffee beans, 2022 - 2032F |
6.3 Lithuania Coffee extracts Market, By Application |
6.3.1 Overview and Analysis |
6.3.2 Lithuania Coffee extracts Market Revenues & Volume, By Food Industry, 2022 - 2032F |
6.3.3 Lithuania Coffee extracts Market Revenues & Volume, By Beverage Industry, 2022 - 2032F |
6.3.4 Lithuania Coffee extracts Market Revenues & Volume, By Pharmaceutical and skincare, 2022 - 2032F |
6.3.5 Lithuania Coffee extracts Market Revenues & Volume, By Others, 2022 - 2032F |
6.4 Lithuania Coffee extracts Market, By Product Form |
6.4.1 Overview and Analysis |
6.4.2 Lithuania Coffee extracts Market Revenues & Volume, By Liquid, 2022 - 2032F |
6.4.3 Lithuania Coffee extracts Market Revenues & Volume, By Dried, 2022 - 2032F |
6.4.4 Lithuania Coffee extracts Market Revenues & Volume, By Capsule, 2022 - 2032F |
6.5 Lithuania Coffee extracts Market, By End-users |
6.5.1 Overview and Analysis |
6.5.2 Lithuania Coffee extracts Market Revenues & Volume, By Commercial, 2022 - 2032F |
6.5.3 Lithuania Coffee extracts Market Revenues & Volume, By Individual, 2022 - 2032F |
6.6 Lithuania Coffee extracts Market, By Distribution Channel |
6.6.1 Overview and Analysis |
6.6.2 Lithuania Coffee extracts Market Revenues & Volume, By Business to Business, 2022 - 2032F |
6.6.3 Lithuania Coffee extracts Market Revenues & Volume, By Business to Consumer, 2022 - 2032F |
7 Lithuania Coffee extracts Market Import-Export Trade Statistics |
7.1 Lithuania Coffee extracts Market Export to Major Countries |
7.2 Lithuania Coffee extracts Market Imports from Major Countries |
8 Lithuania Coffee extracts Market Key Performance Indicators |
8.1 Consumer engagement on social media platforms related to coffee extract products |
8.2 Number of new product launches in the coffee extract market |
8.3 Percentage increase in cafes and coffee shops offering coffee extract-based beverages |
8.4 Growth in online sales of coffee extract products |
9 Lithuania Coffee extracts Market - Opportunity Assessment |
9.1 Lithuania Coffee extracts Market Opportunity Assessment, By Nature Type, 2022 & 2032F |
9.2 Lithuania Coffee extracts Market Opportunity Assessment, By Source Type, 2022 & 2032F |
9.3 Lithuania Coffee extracts Market Opportunity Assessment, By Application, 2022 & 2032F |
9.4 Lithuania Coffee extracts Market Opportunity Assessment, By Product Form, 2022 & 2032F |
9.5 Lithuania Coffee extracts Market Opportunity Assessment, By End-users, 2022 & 2032F |
9.6 Lithuania Coffee extracts Market Opportunity Assessment, By Distribution Channel, 2022 & 2032F |
10 Lithuania Coffee extracts Market - Competitive Landscape |
10.1 Lithuania Coffee extracts Market Revenue Share, By Companies, 2025 |
10.2 Lithuania Coffee extracts Market Competitive Benchmarking, By Operating and Technical Parameters |
11 Company Profiles |
12 Recommendations | 13 Disclaimer |
Global Go To Market Strategy - 2030
Export potential enables firms to identify high-growth global markets with greater confidence by combining advanced trade intelligence with a structured quantitative methodology. The framework analyzes emerging demand trends and country-level import patterns while integrating macroeconomic and trade datasets such as GDP and population forecasts, bilateral import–export flows, tariff structures, elasticity differentials between developed and developing economies, geographic distance, and import demand projections. Using weighted trade values from 2020–2024 as the base period to project country-to-country export potential for 2030, these inputs are operationalized through calculated drivers such as gravity model parameters, tariff impact factors, and projected GDP per-capita growth. Through an analysis of hidden potentials, demand hotspots, and market conditions that are most favorable to success, this method enables firms to focus on target countries, maximize returns, and global expansion with data, backed by accuracy.
By factoring in the projected importer demand gap that is currently unmet and could be potential opportunity, it identifies the potential for the Exporter (Country) among 190 countries, against the general trade analysis, which identifies the biggest importer or exporter.
To discover high-growth global markets and optimize your business strategy:
Click Here
Pricing
- Single User License$ 1,995
- Department License$ 2,400
- Site License$ 3,120
- Global License$ 3,795

Leadership Perspectives from Industry Events
Search
Thought Leadership and Analyst Meet


Our Clients
6WResearch In News
- India Export Attractiveness Tracker 2026
- India Air Conditioner Market Set for Strong Rebound in 2026 After Weather-Led Correction and GST-Driven Recovery: 6Wresearch
- ADAS in India: How Automatic Emergency Braking, Blind Spot Detection & Driver Monitoring are Transforming Road Safety
- Doha a strategic location for EV manufacturing hub: IPA Qatar
- Demand for luxury TVs surging in the GCC, says Samsung
- Empowering Growth: The Thriving Journey of Bangladesh’s Cable Industry
Latest Reports
- Qatar Access and Home Network Market (2026-2032)
- Nicaragua RPG Gaming Market (2026-2032)
- New Zealand RPG Gaming Market (2026-2032)
- Netherlands RPG Gaming Market (2026-2032)
- Nauru RPG Gaming Market (2026-2032)
- Namibia RPG Gaming Market (2026-2032)
- Mozambique RPG Gaming Market (2026-2032)
- Montenegro RPG Gaming Market (2026-2032)
- Mongolia RPG Gaming Market (2026-2032)
- Monaco RPG Gaming Market (2026-2032)
Industry Events and Analyst Meet

EV India Expo 2026

HIMTEX 2026

India Refining Summit 2026

India EV Show 2026

EV tech India Expo 2026
Whitepaper
- Middle East & Africa Commercial Security Market Click here to view more.
- Middle East & Africa Fire Safety Systems & Equipment Market Click here to view more.
- GCC Drone Market Click here to view more.
- Middle East Lighting Fixture Market Click here to view more.
- GCC Physical & Perimeter Security Market Click here to view more.