Lithuania Copier Paper Market (2026-2032) | Segmentation, Growth, Trends, Industry, Revenue, Size, Value, Share, Companies, Forecast, Outlook & Analysis
Market Forecast By Type (Up to 50 GSM, 50-80 GSM, 80-110 GSM, 110-130 GSM), By Application (Commercial, Individual) And Competitive Landscape
| Product Code: ETC4821043 | Publication Date: Nov 2023 | Updated Date: Apr 2026 | Product Type: Market Research Report | |
| Publisher: 6Wresearch | Author: Shubham Padhi | No. of Pages: 60 | No. of Figures: 30 | No. of Tables: 5 |
Lithuania Copier Paper Market Size (2020-2030)
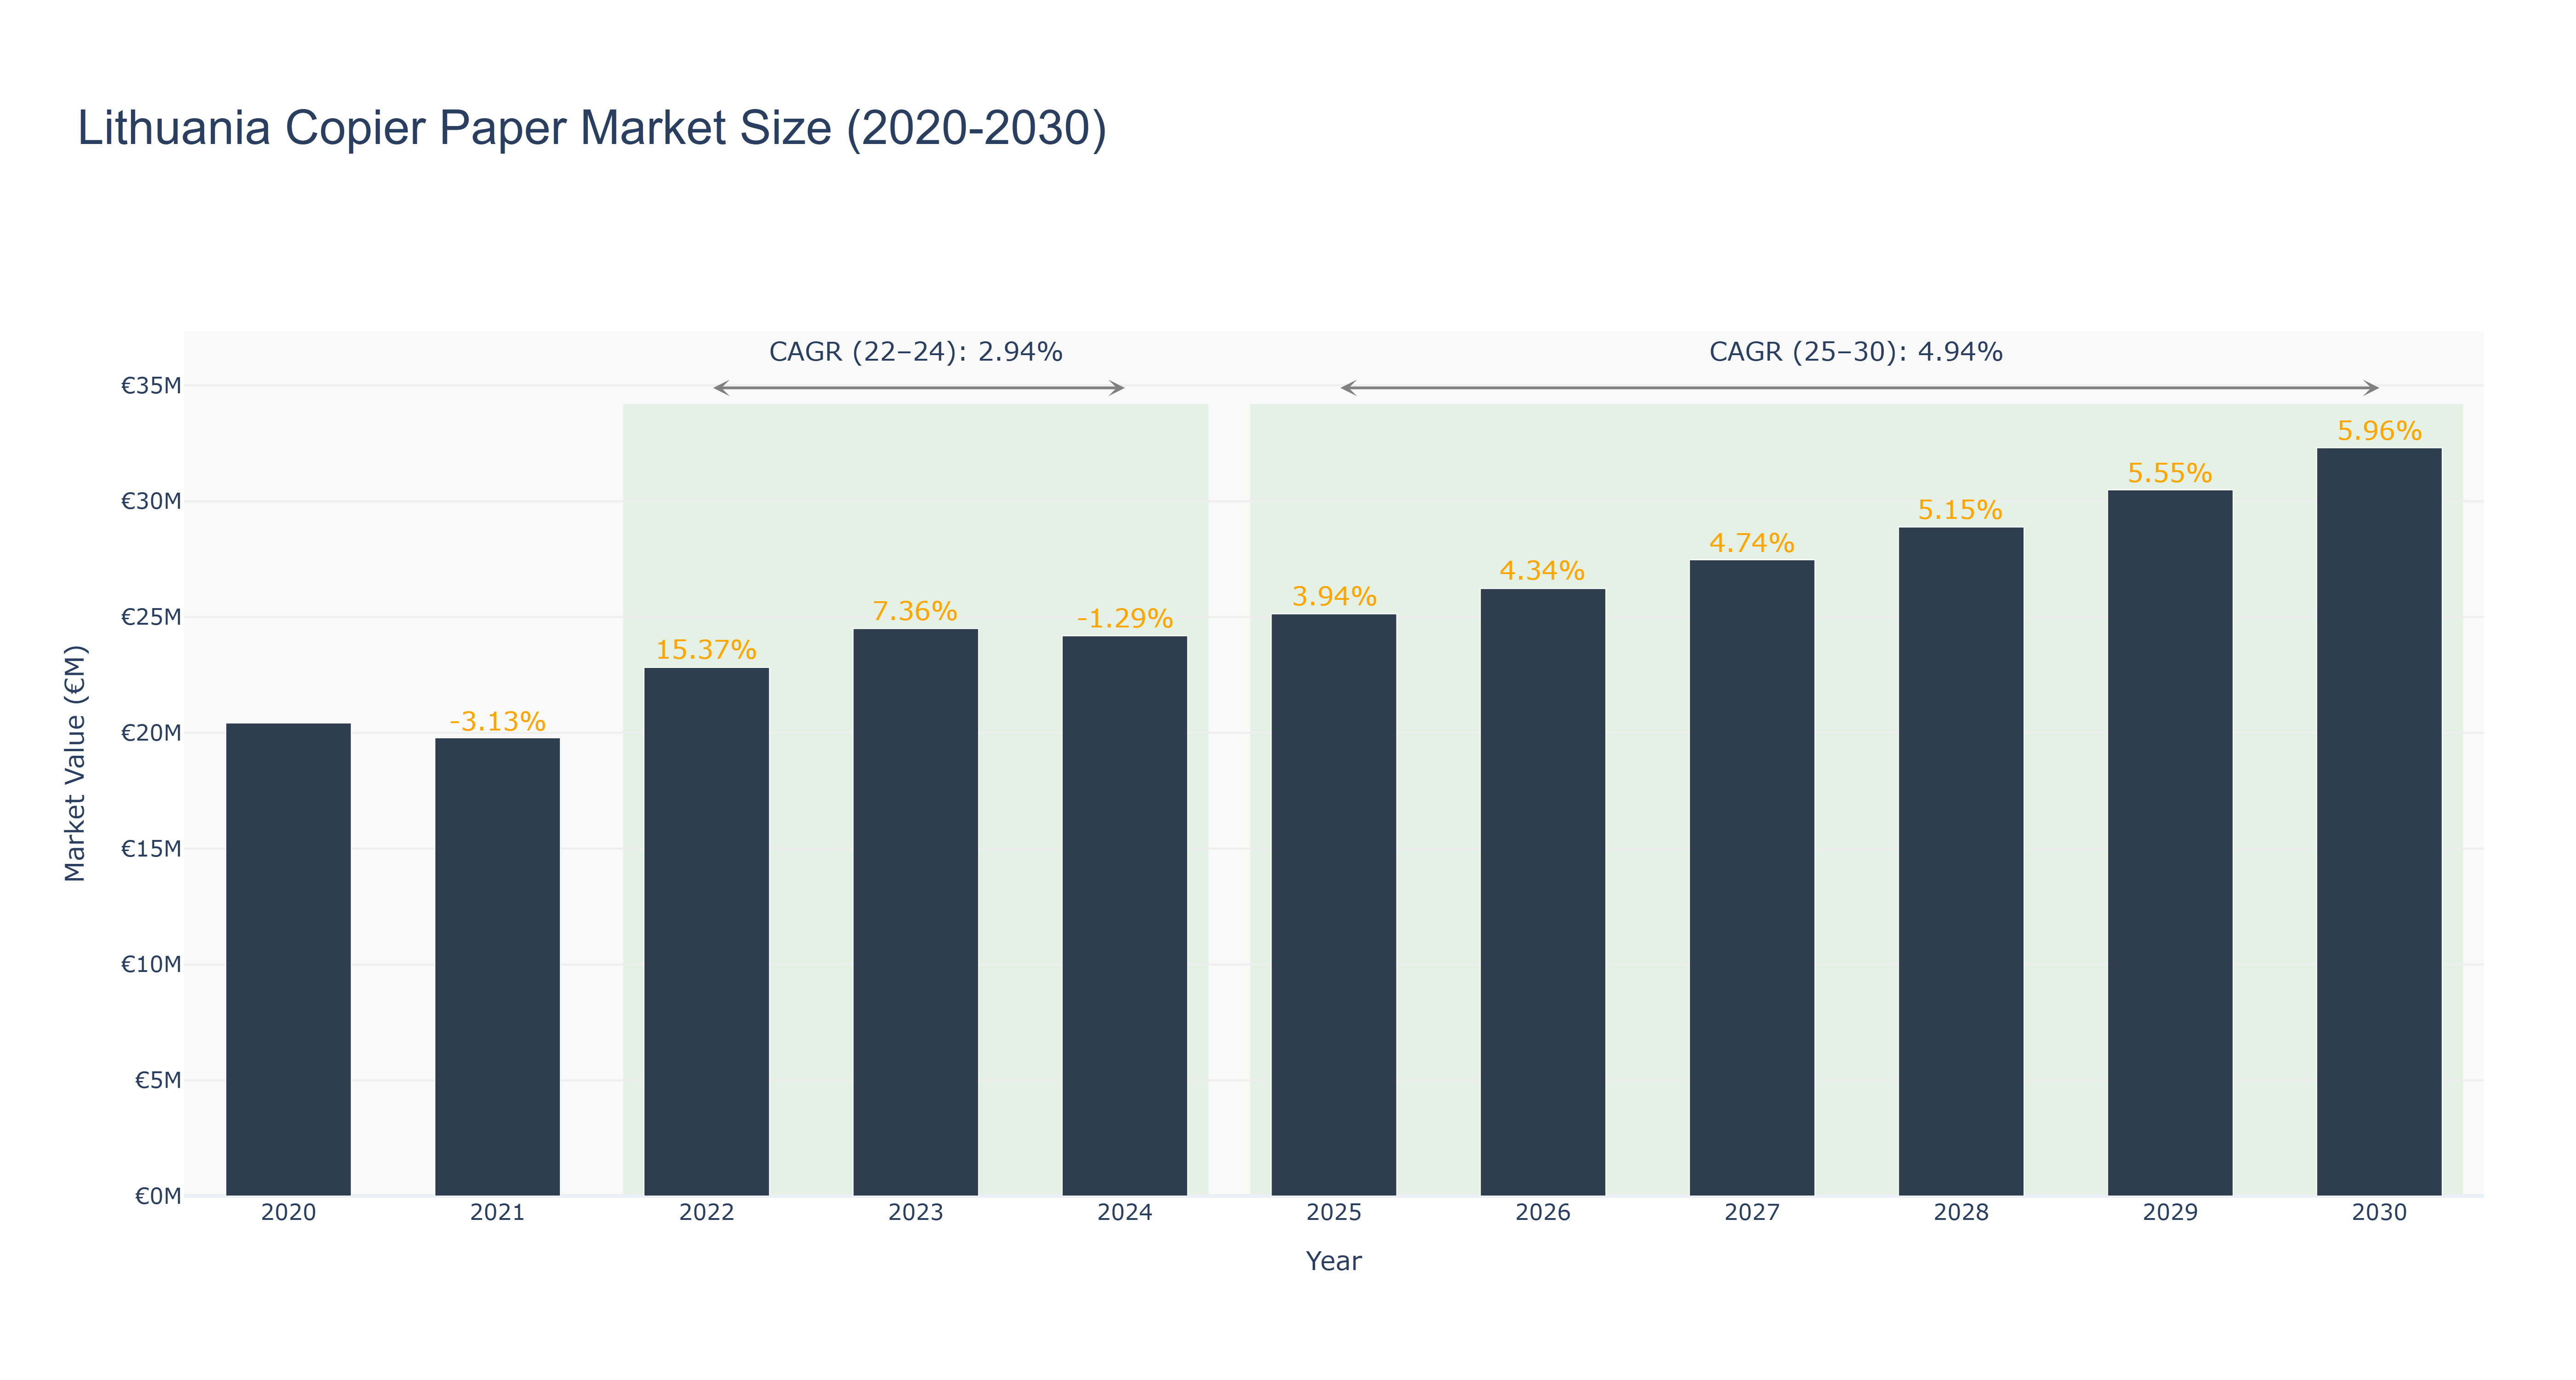
The Lithuania Copier Paper Market experienced a peak market size of €32.30 million in 2030, with steady growth over the years. The actual market size declined slightly from €22.82 million in 2022 to €24.18 million in 2024, possibly due to economic fluctuations impacting demand. However, the market rebounded and is forecasted to grow to €35.92 million by 2030, with a CAGR of 4.94% from 2025 to 2030. The market's growth can be attributed to increasing digitalization, driving demand for office supplies. Recent developments in Lithuania include initiatives to promote sustainable paper production, aligning with global environmental trends. Future projects aim to enhance the market's competitiveness through technological advancements and eco-friendly practices, positioning Lithuania as a key player in the copier paper industry.
Lithuania Copier Paper Market: Production & Trade Performance (2019-2025)
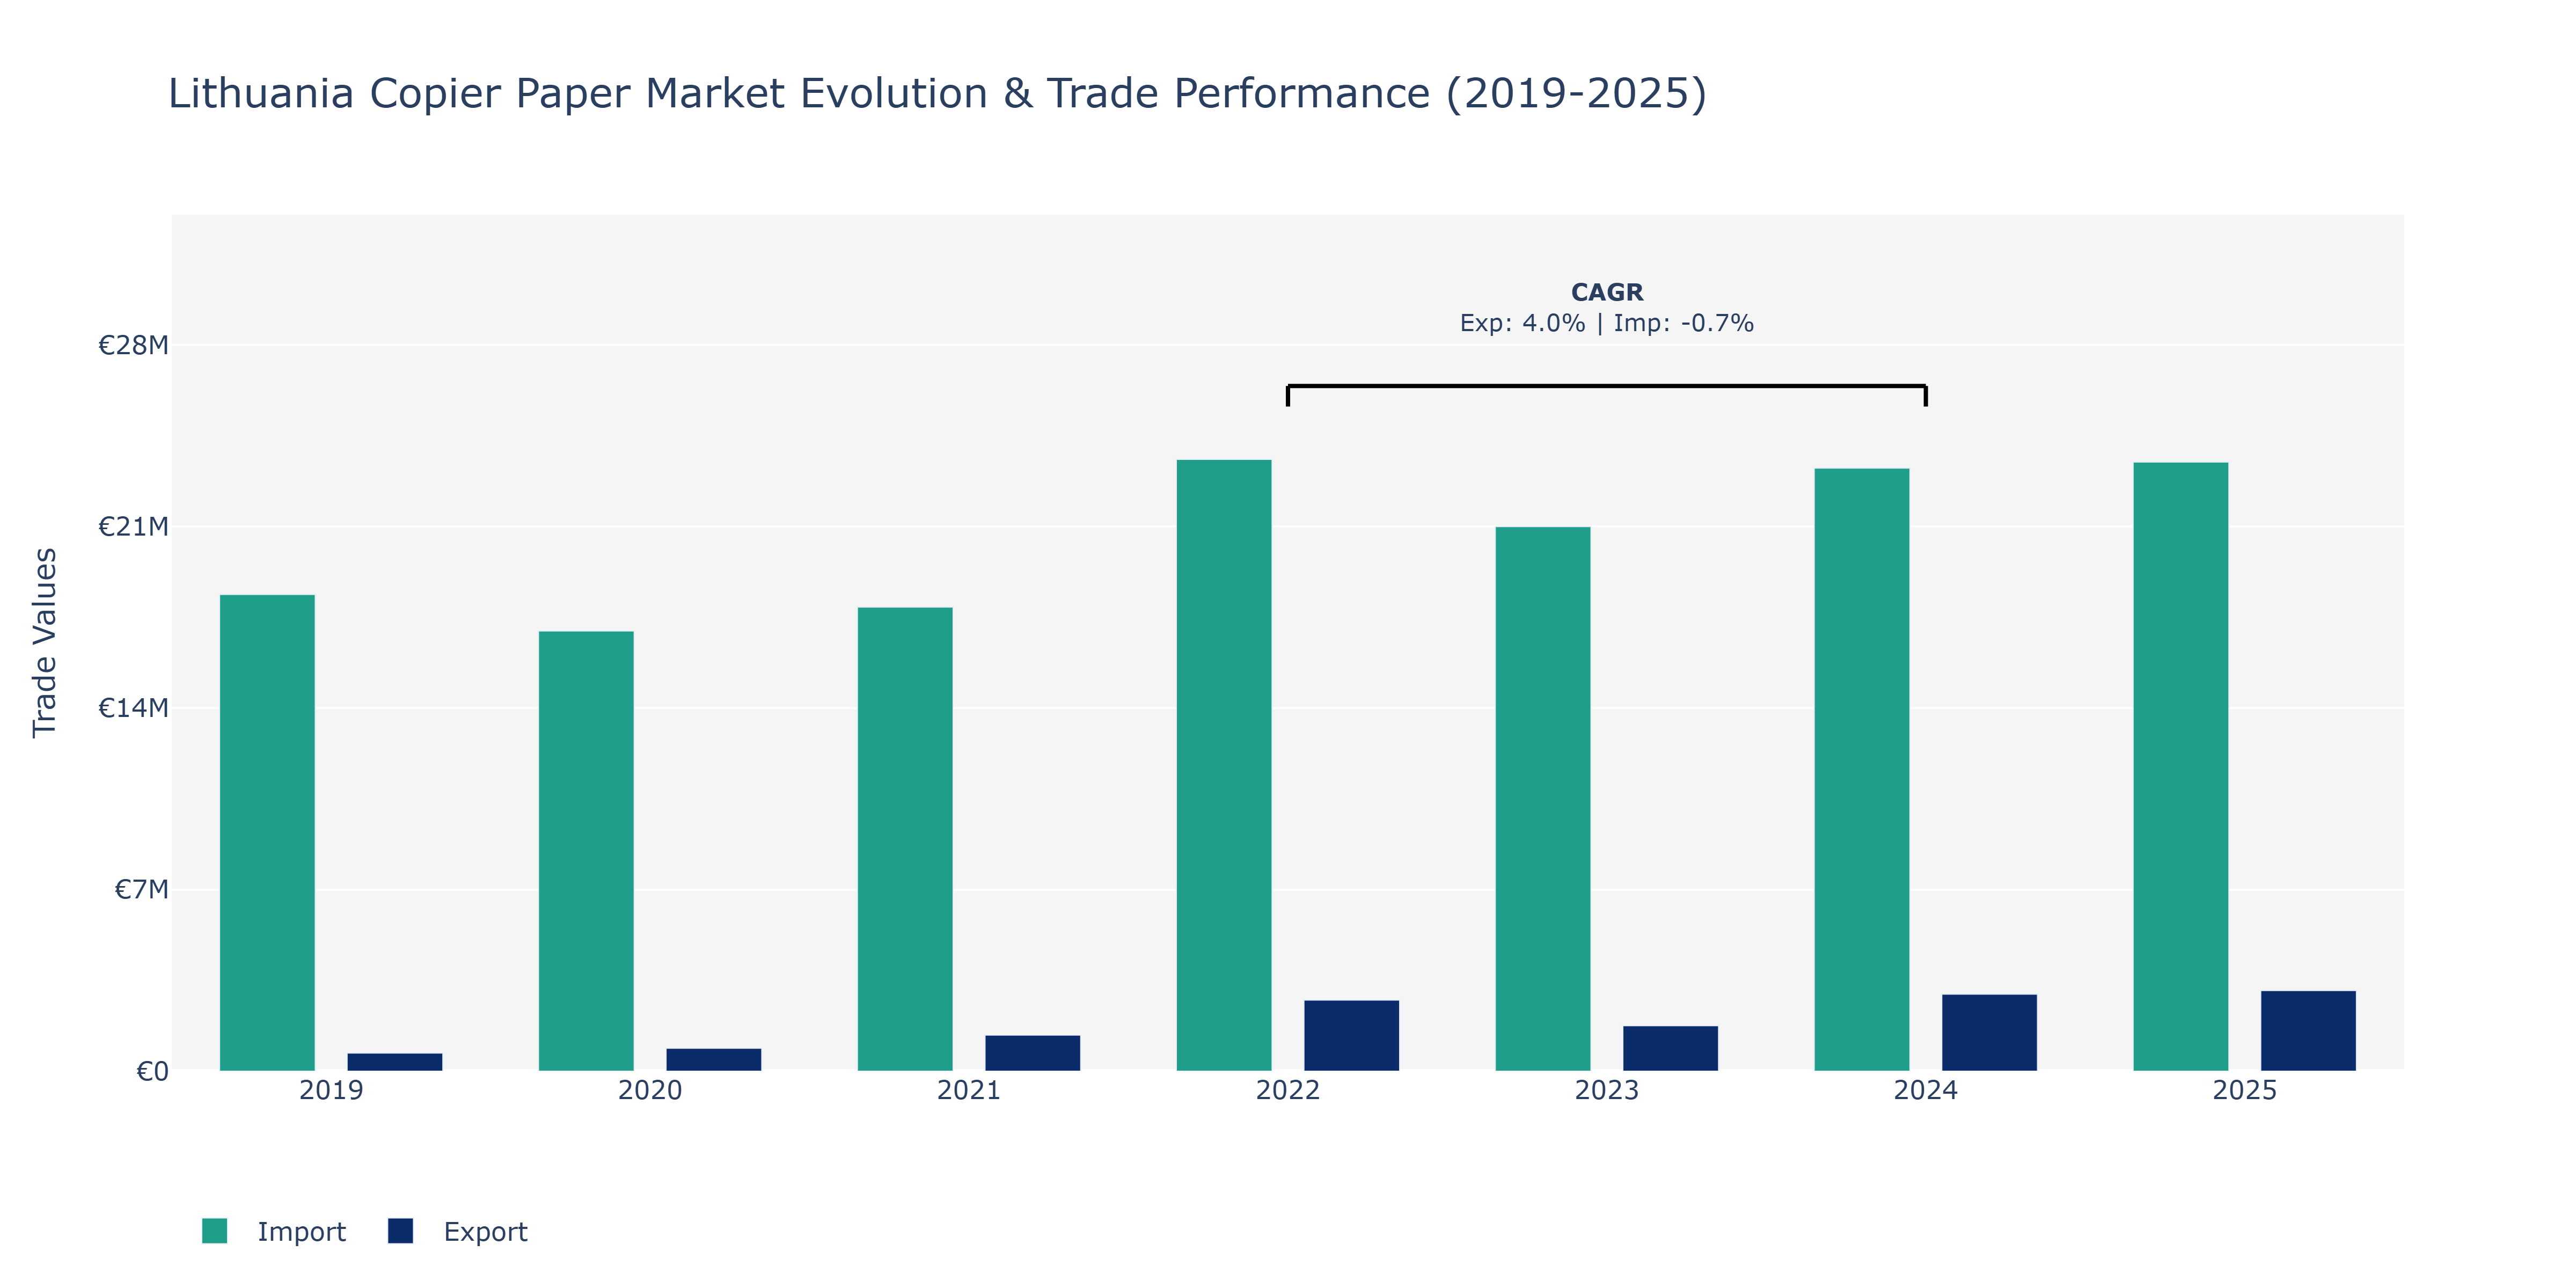
Between 2019 and 2025, Lithuania's Copier Paper Market witnessed varying trends in exports and imports. Exports showed a consistent growth trajectory, escalating from €696.6 thousand in 2019 to €3.11 million in 2025. This substantial increase can be attributed to the rising demand for Lithuanian copier paper products in international markets due to their superior quality and competitive pricing. In contrast, imports fluctuated over the same period, reaching €23.49 million in 2024 before slightly decreasing to €23.49 million in 2025. The dip in imports in 2025 could be linked to the country's strategic efforts to promote domestic production and reduce reliance on foreign suppliers, following global supply chain disruptions. Despite the minor decline, Lithuania maintains a strong position in the copier paper market, supported by its efficient production processes and export competitiveness.
Key Highlights of the Report:
- Lithuania Copier Paper Market Outlook
- Market Size of Lithuania Copier Paper Market, 2025
- Forecast of Lithuania Copier Paper Market, 2032
- Historical Data and Forecast of Lithuania Copier Paper Revenues & Volume for the Period 2022 - 2032F
- Lithuania Copier Paper Market Trend Evolution
- Lithuania Copier Paper Market Drivers and Challenges
- Lithuania Copier Paper Price Trends
- Lithuania Copier Paper Porter`s Five Forces
- Lithuania Copier Paper Industry Life Cycle
- Historical Data and Forecast of Lithuania Copier Paper Market Revenues & Volume By Type for the Period 2022 - 2032F
- Historical Data and Forecast of Lithuania Copier Paper Market Revenues & Volume By Up to 50 GSM for the Period 2022 - 2032F
- Historical Data and Forecast of Lithuania Copier Paper Market Revenues & Volume By 50-80 GSM for the Period 2022 - 2032F
- Historical Data and Forecast of Lithuania Copier Paper Market Revenues & Volume By 80-110 GSM for the Period 2022 - 2032F
- Historical Data and Forecast of Lithuania Copier Paper Market Revenues & Volume By 110-130 GSM for the Period 2022 - 2032F
- Historical Data and Forecast of Lithuania Copier Paper Market Revenues & Volume By Application for the Period 2022 - 2032F
- Historical Data and Forecast of Lithuania Copier Paper Market Revenues & Volume By Commercial for the Period 2022 - 2032F
- Historical Data and Forecast of Lithuania Copier Paper Market Revenues & Volume By Individual for the Period 2022 - 2032F
- Lithuania Copier Paper Import Export Trade Statistics
- Market Opportunity Assessment By Type
- Market Opportunity Assessment By Application
- Lithuania Copier Paper Top Companies Market Share
- Lithuania Copier Paper Competitive Benchmarking By Technical and Operational Parameters
- Lithuania Copier Paper Company Profiles
- Lithuania Copier Paper Key Strategic Recommendations
Frequently Asked Questions About the Market Study (FAQs):
6Wresearch actively monitors the Lithuania Copier Paper Market and publishes its comprehensive annual report, highlighting emerging trends, growth drivers, revenue analysis, and forecast outlook. Our insights help businesses to make data-backed strategic decisions with ongoing market dynamics. Our analysts track relevent industries related to the Lithuania Copier Paper Market, allowing our clients with actionable intelligence and reliable forecasts tailored to emerging regional needs.
Yes, we provide customisation as per your requirements. To learn more, feel free to contact us on sales@6wresearch.com
1 Executive Summary |
2 Introduction |
2.1 Key Highlights of the Report |
2.2 Report Description |
2.3 Market Scope & Segmentation |
2.4 Research Methodology |
2.5 Assumptions |
3 Lithuania Copier Paper Market Overview |
3.1 Lithuania Country Macro Economic Indicators |
3.2 Lithuania Copier Paper Market Revenues & Volume, 2022 & 2032F |
3.3 Lithuania Copier Paper Market - Industry Life Cycle |
3.4 Lithuania Copier Paper Market - Porter's Five Forces |
3.5 Lithuania Copier Paper Market Revenues & Volume Share, By Type, 2022 & 2032F |
3.6 Lithuania Copier Paper Market Revenues & Volume Share, By Application, 2022 & 2032F |
4 Lithuania Copier Paper Market Dynamics |
4.1 Impact Analysis |
4.2 Market Drivers |
4.2.1 Increasing demand for sustainable and eco-friendly paper products |
4.2.2 Growing emphasis on digital printing leading to higher paper consumption |
4.2.3 Government initiatives promoting paper recycling and reducing paper waste |
4.3 Market Restraints |
4.3.1 Rising raw material costs impacting the production and pricing of copier paper |
4.3.2 Competition from digital alternatives impacting the demand for copier paper |
4.3.3 Fluctuating exchange rates affecting import/export of copier paper |
5 Lithuania Copier Paper Market Trends |
6 Lithuania Copier Paper Market Segmentations |
6.1 Lithuania Copier Paper Market, By Type |
6.1.1 Overview and Analysis |
6.1.2 Lithuania Copier Paper Market Revenues & Volume, By Up to 50 GSM, 2022 - 2032F |
6.1.3 Lithuania Copier Paper Market Revenues & Volume, By 50-80 GSM, 2022 - 2032F |
6.1.4 Lithuania Copier Paper Market Revenues & Volume, By 80-110 GSM, 2022 - 2032F |
6.1.5 Lithuania Copier Paper Market Revenues & Volume, By 110-130 GSM, 2022 - 2032F |
6.2 Lithuania Copier Paper Market, By Application |
6.2.1 Overview and Analysis |
6.2.2 Lithuania Copier Paper Market Revenues & Volume, By Commercial, 2022 - 2032F |
6.2.3 Lithuania Copier Paper Market Revenues & Volume, By Individual, 2022 - 2032F |
7 Lithuania Copier Paper Market Import-Export Trade Statistics |
7.1 Lithuania Copier Paper Market Export to Major Countries |
7.2 Lithuania Copier Paper Market Imports from Major Countries |
8 Lithuania Copier Paper Market Key Performance Indicators |
8.1 Percentage of recycled content in copier paper products |
8.2 Average price per ton of copier paper |
8.3 Number of paper recycling facilities in Lithuania |
9 Lithuania Copier Paper Market - Opportunity Assessment |
9.1 Lithuania Copier Paper Market Opportunity Assessment, By Type, 2022 & 2032F |
9.2 Lithuania Copier Paper Market Opportunity Assessment, By Application, 2022 & 2032F |
10 Lithuania Copier Paper Market - Competitive Landscape |
10.1 Lithuania Copier Paper Market Revenue Share, By Companies, 2025 |
10.2 Lithuania Copier Paper Market Competitive Benchmarking, By Operating and Technical Parameters |
11 Company Profiles |
12 Recommendations | 13 Disclaimer |
Export potential assessment - trade Analytics for 2030
Export potential enables firms to identify high-growth global markets with greater confidence by combining advanced trade intelligence with a structured quantitative methodology. The framework analyzes emerging demand trends and country-level import patterns while integrating macroeconomic and trade datasets such as GDP and population forecasts, bilateral import–export flows, tariff structures, elasticity differentials between developed and developing economies, geographic distance, and import demand projections. Using weighted trade values from 2020–2024 as the base period to project country-to-country export potential for 2030, these inputs are operationalized through calculated drivers such as gravity model parameters, tariff impact factors, and projected GDP per-capita growth. Through an analysis of hidden potentials, demand hotspots, and market conditions that are most favorable to success, this method enables firms to focus on target countries, maximize returns, and global expansion with data, backed by accuracy.
By factoring in the projected importer demand gap that is currently unmet and could be potential opportunity, it identifies the potential for the Exporter (Country) among 190 countries, against the general trade analysis, which identifies the biggest importer or exporter.
To discover high-growth global markets and optimize your business strategy:
Click Here
Pricing
- Single User License$ 1,995
- Department License$ 2,400
- Site License$ 3,120
- Global License$ 3,795

Search
Thought Leadership and Analyst Meet


Our Clients
Latest Reports
- Canada Cloud CFD Market (2026-2032) | Size & Revenue, Industry, Growth, Competitive Landscape, Forecast, Segmentation, Value, Outlook, Trends, Share, Analysis, Companies
- Taiwan Food Delivery Platform Market (2026-2032) | Companies, Outlook, Analysis, Trends, Value, Revenue, Segmentation, Share, Forecast, Competitive Landscape, Growth, Size & Forecast
- United Kingdom (UK) Long-term Care Insurance Market (2026-2032) | Growth, Share, Consumer Insights, Drivers, Opportunities, Competition, Pricing Analysis, Segments, Restraints, Companies, Competitive, Value, Outlook, Size, Demand, Analysis, Challenges, Strategic Insights, Investment Trends, Revenue, Trends, Supply, Forecast
- United Kingdom (UK) Long Term Care Market (2026-2032) | Companies, Outlook, Analysis, Trends, Value, Revenue, Segmentation, Share, Forecast, Competitive Landscape, Growth, Size & Forecast
- Iraq Insulation and Waterproofing Market (2026-2032) | Outlook, Drivers, Growth, Size, Share, Industry, Revenue, Trends, Demand, Competitive, Strategic Insights, Opportunities, Segments, Companies, Challenges, Strategy, Consumer Insights, Analysis, Investment Trends, Value, Segmentation, Forecast, Restraints
- India Switchgear Market Outlook (2026-2032) | Size, Share, Trends, Growth, Revenue, Forecast, Analysis, Value, Outlook
- Pakistan Contraceptive Implants Market (2025-2031) | Demand, Growth, Size, Share, Industry, Pricing Analysis, Competitive, Strategic Insights, Strategy, Consumer Insights, Analysis, Investment Trends, Opportunities, Revenue, Segments, Value, Segmentation, Supply, Forecast, Restraints, Outlook, Competition, Drivers, Trends, Companies, Challenges
- Sri Lanka Packaging Market (2026-2032) | Outlook, Competition, Drivers, Trends, Demand, Pricing Analysis, Competitive, Strategic Insights, Companies, Challenges, Strategy, Consumer Insights, Analysis, Investment Trends, Opportunities, Growth, Size, Share, Industry, Revenue, Segments, Value, Segmentation, Supply, Forecast, Restraints
- India Kids Watches Market (2026-2032) | Strategy, Consumer Insights, Analysis, Investment Trends, Opportunities, Growth, Size, Share, Industry, Revenue, Segments, Value, Segmentation, Supply, Forecast, Restraints, Outlook, Competition, Drivers, Trends, Demand, Pricing Analysis, Competitive, Strategic Insights, Companies, Challenges
- Saudi Arabia Core Assurance Service Market (2025-2031) | Strategy, Consumer Insights, Analysis, Investment Trends, Opportunities, Growth, Size, Share, Industry, Revenue, Segments, Value, Segmentation, Supply, Forecast, Restraints, Outlook, Competition, Drivers, Trends, Demand, Pricing Analysis, Competitive, Strategic Insights, Companies, Challenges
Industry Events and Analyst Meet

India EV Show 2026

EV tech India Expo 2026

Auto Tech Asia 2026

Battery Tech India 2026

Smart Production Solutions Guangzhou 2026
Whitepaper
- Middle East & Africa Commercial Security Market Click here to view more.
- Middle East & Africa Fire Safety Systems & Equipment Market Click here to view more.
- GCC Drone Market Click here to view more.
- Middle East Lighting Fixture Market Click here to view more.
- GCC Physical & Perimeter Security Market Click here to view more.
6WResearch In News
- Doha a strategic location for EV manufacturing hub: IPA Qatar
- Demand for luxury TVs surging in the GCC, says Samsung
- Empowering Growth: The Thriving Journey of Bangladesh’s Cable Industry
- Demand for luxury TVs surging in the GCC, says Samsung
- Video call with a traditional healer? Once unthinkable, it’s now common in South Africa
- Intelligent Buildings To Smooth GCC’s Path To Net Zero