Lithuania Copper Rod Market (2026-2032) | Opportunities, Strategic Insights, Competition, Pricing Analysis, Value, Drivers, Supply, Investment Trends, Outlook, Companies, Trends, Forecast, Industry, Challenges, Demand, Share, Restraints, Consumer Insights, Growth, Strategy, Competitive, Segmentation, Revenue, Size, Segments, Analysis
Market Forecast By Rod Type (Round Rod, Square Rod, Hexagonal Rod, Others), By Processing Method (Extrusion, Rolling, Casting, Others), By End-Use (Electrical, Industrial, Construction, Others), By Material Composition (Pure Copper, Copper Alloys, Recycled Copper, Others), By Distribution Channel (Wholesale, Retail, Direct Sales, Others) And Competitive Landscape
| Product Code: ETC11761146 | Publication Date: Apr 2025 | Updated Date: Apr 2026 | Product Type: Market Research Report | |
| Publisher: 6Wresearch | No. of Pages: 65 | No. of Figures: 34 | No. of Tables: 19 | |
Lithuania Copper Rod Market Size (2020-2030)
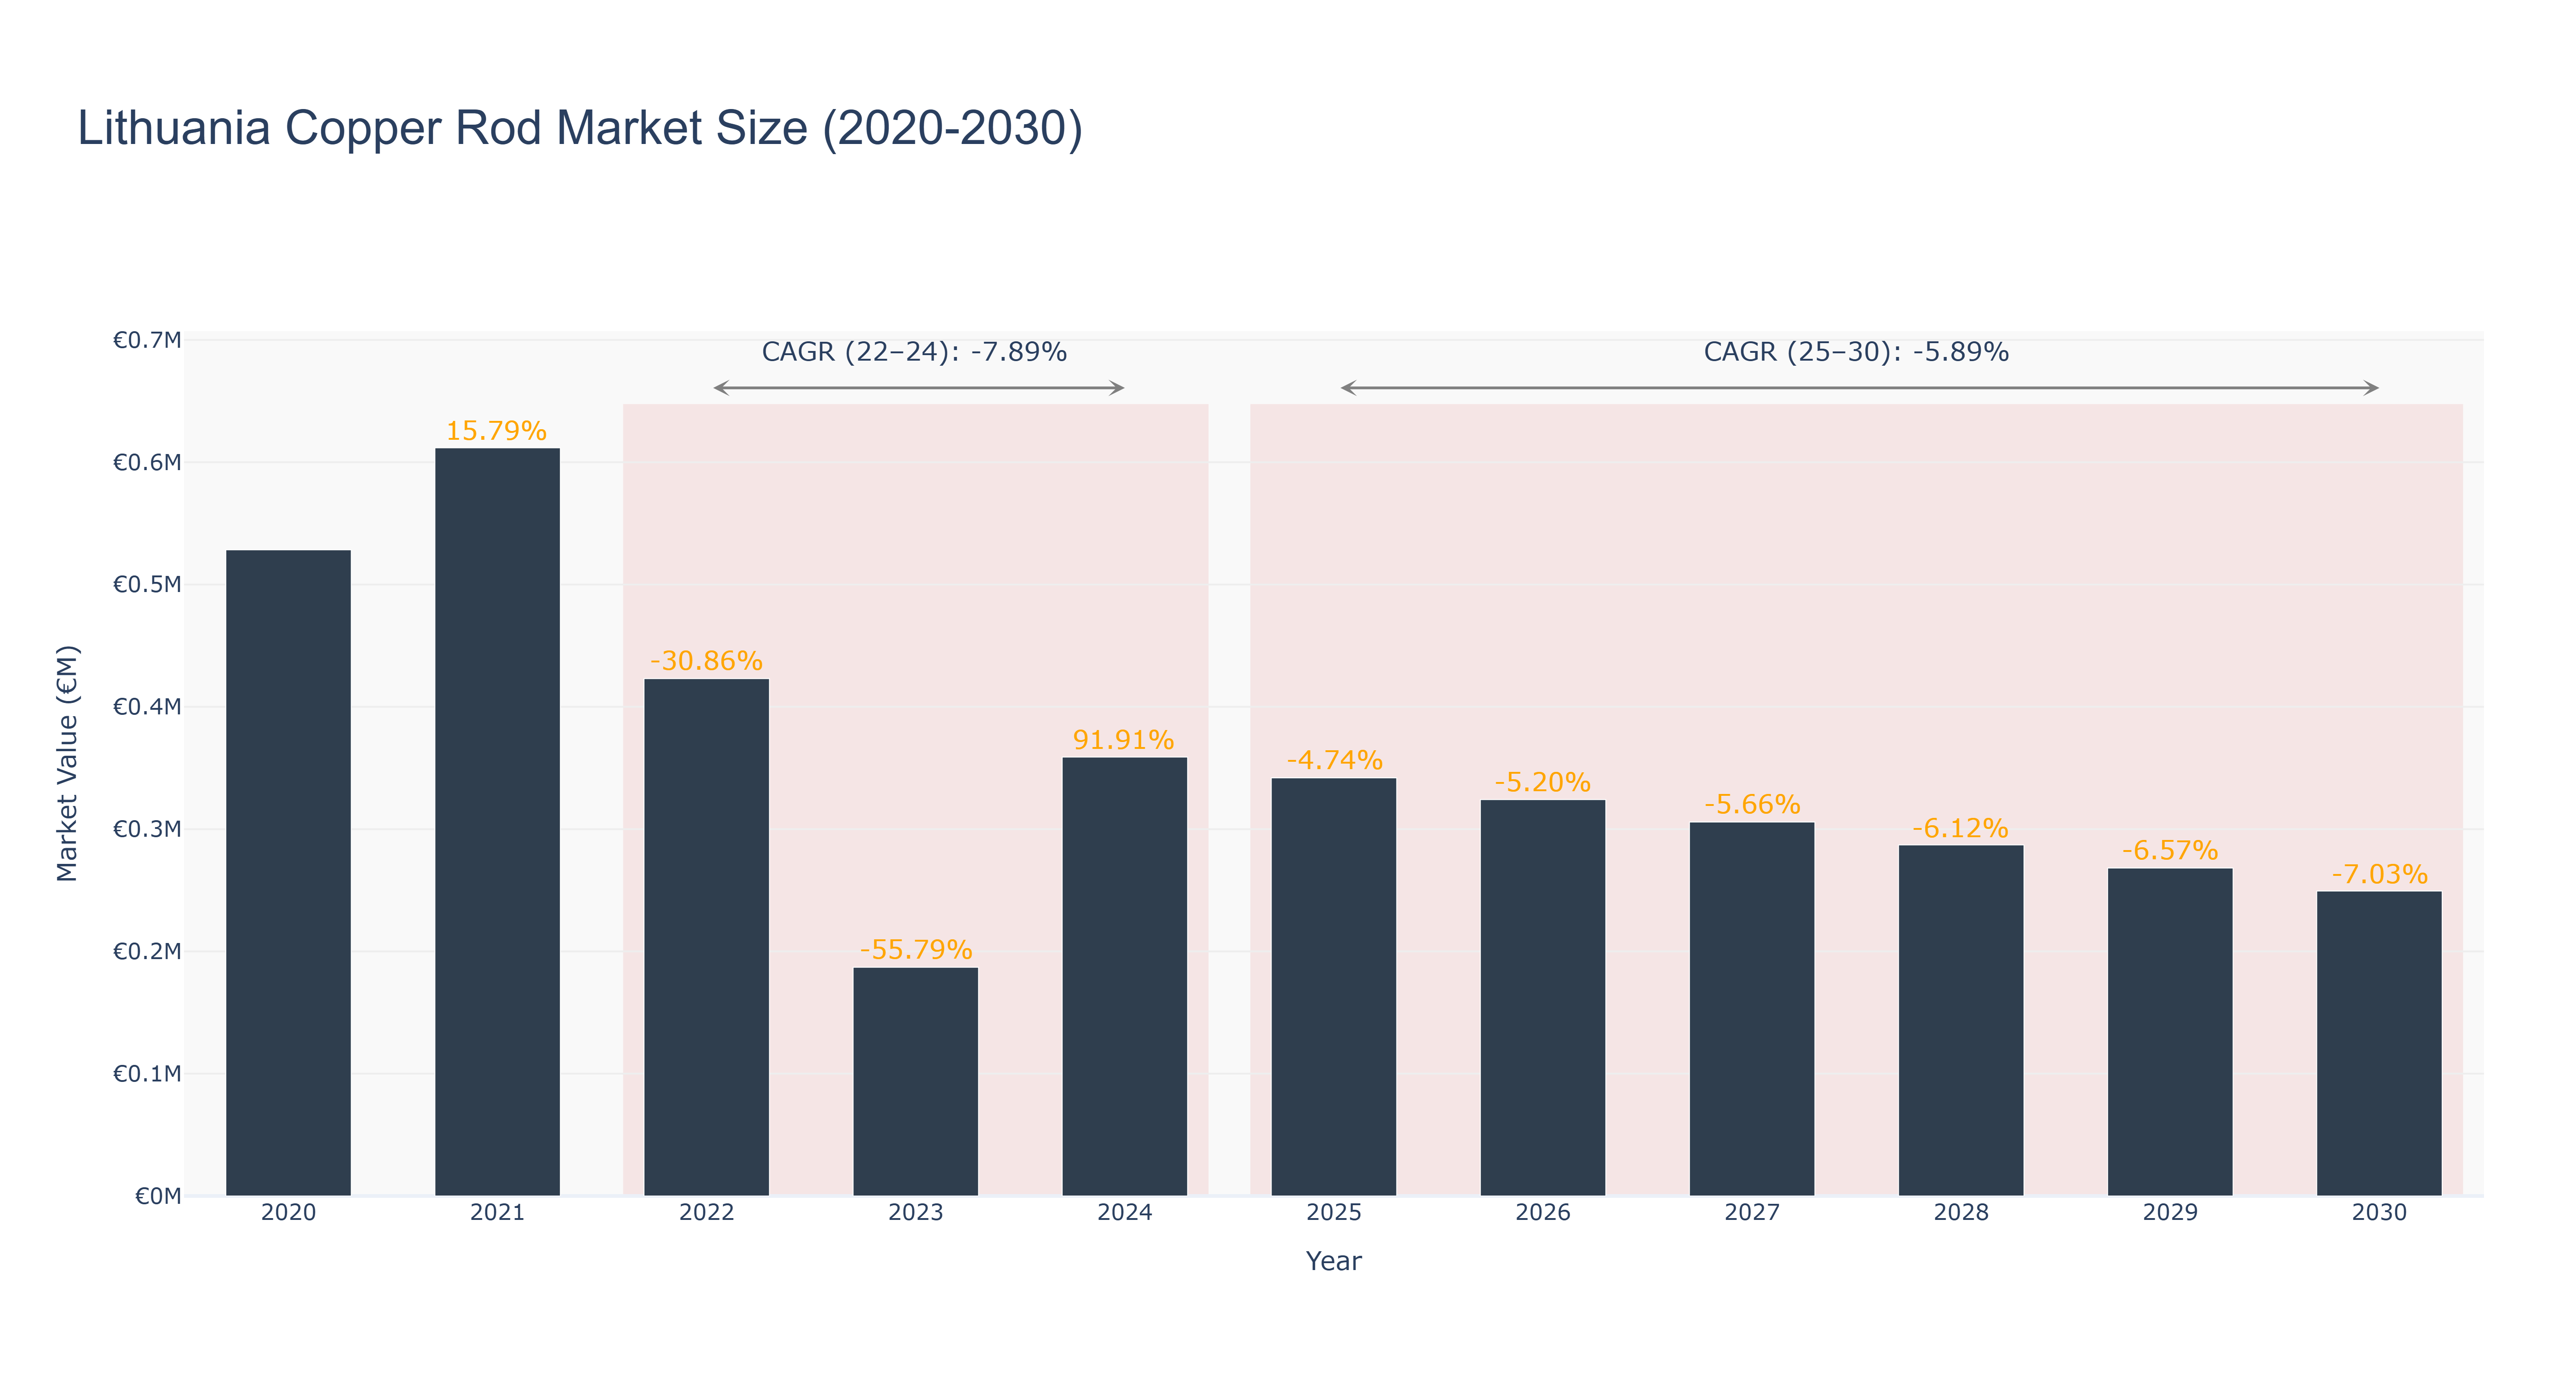
Lithuania Copper Rod Market has experienced fluctuations in market size over the years. The peak market size was in 2021 at €0.61 million, followed by a significant decline to €0.19 million in 2023. The market rebounded in 2024 to €0.36 million, showing a growth of 91.91%. Forecasted market sizes indicate a downward trend from €0.34 million in 2025 to €0.25 million in 2030, with CAGR values of -5.89% (2025-30) and -7.89% (2022-24). The market's decline can be attributed to global economic uncertainties impacting copper prices and demand. Looking ahead, Lithuania is set to invest in renewable energy projects, potentially driving demand for copper rods in the near future. This shift towards sustainable energy sources could be a key driver for the market's growth in the coming years.
Lithuania Copper Rod Market: Production & Trade Performance (2019-2025)
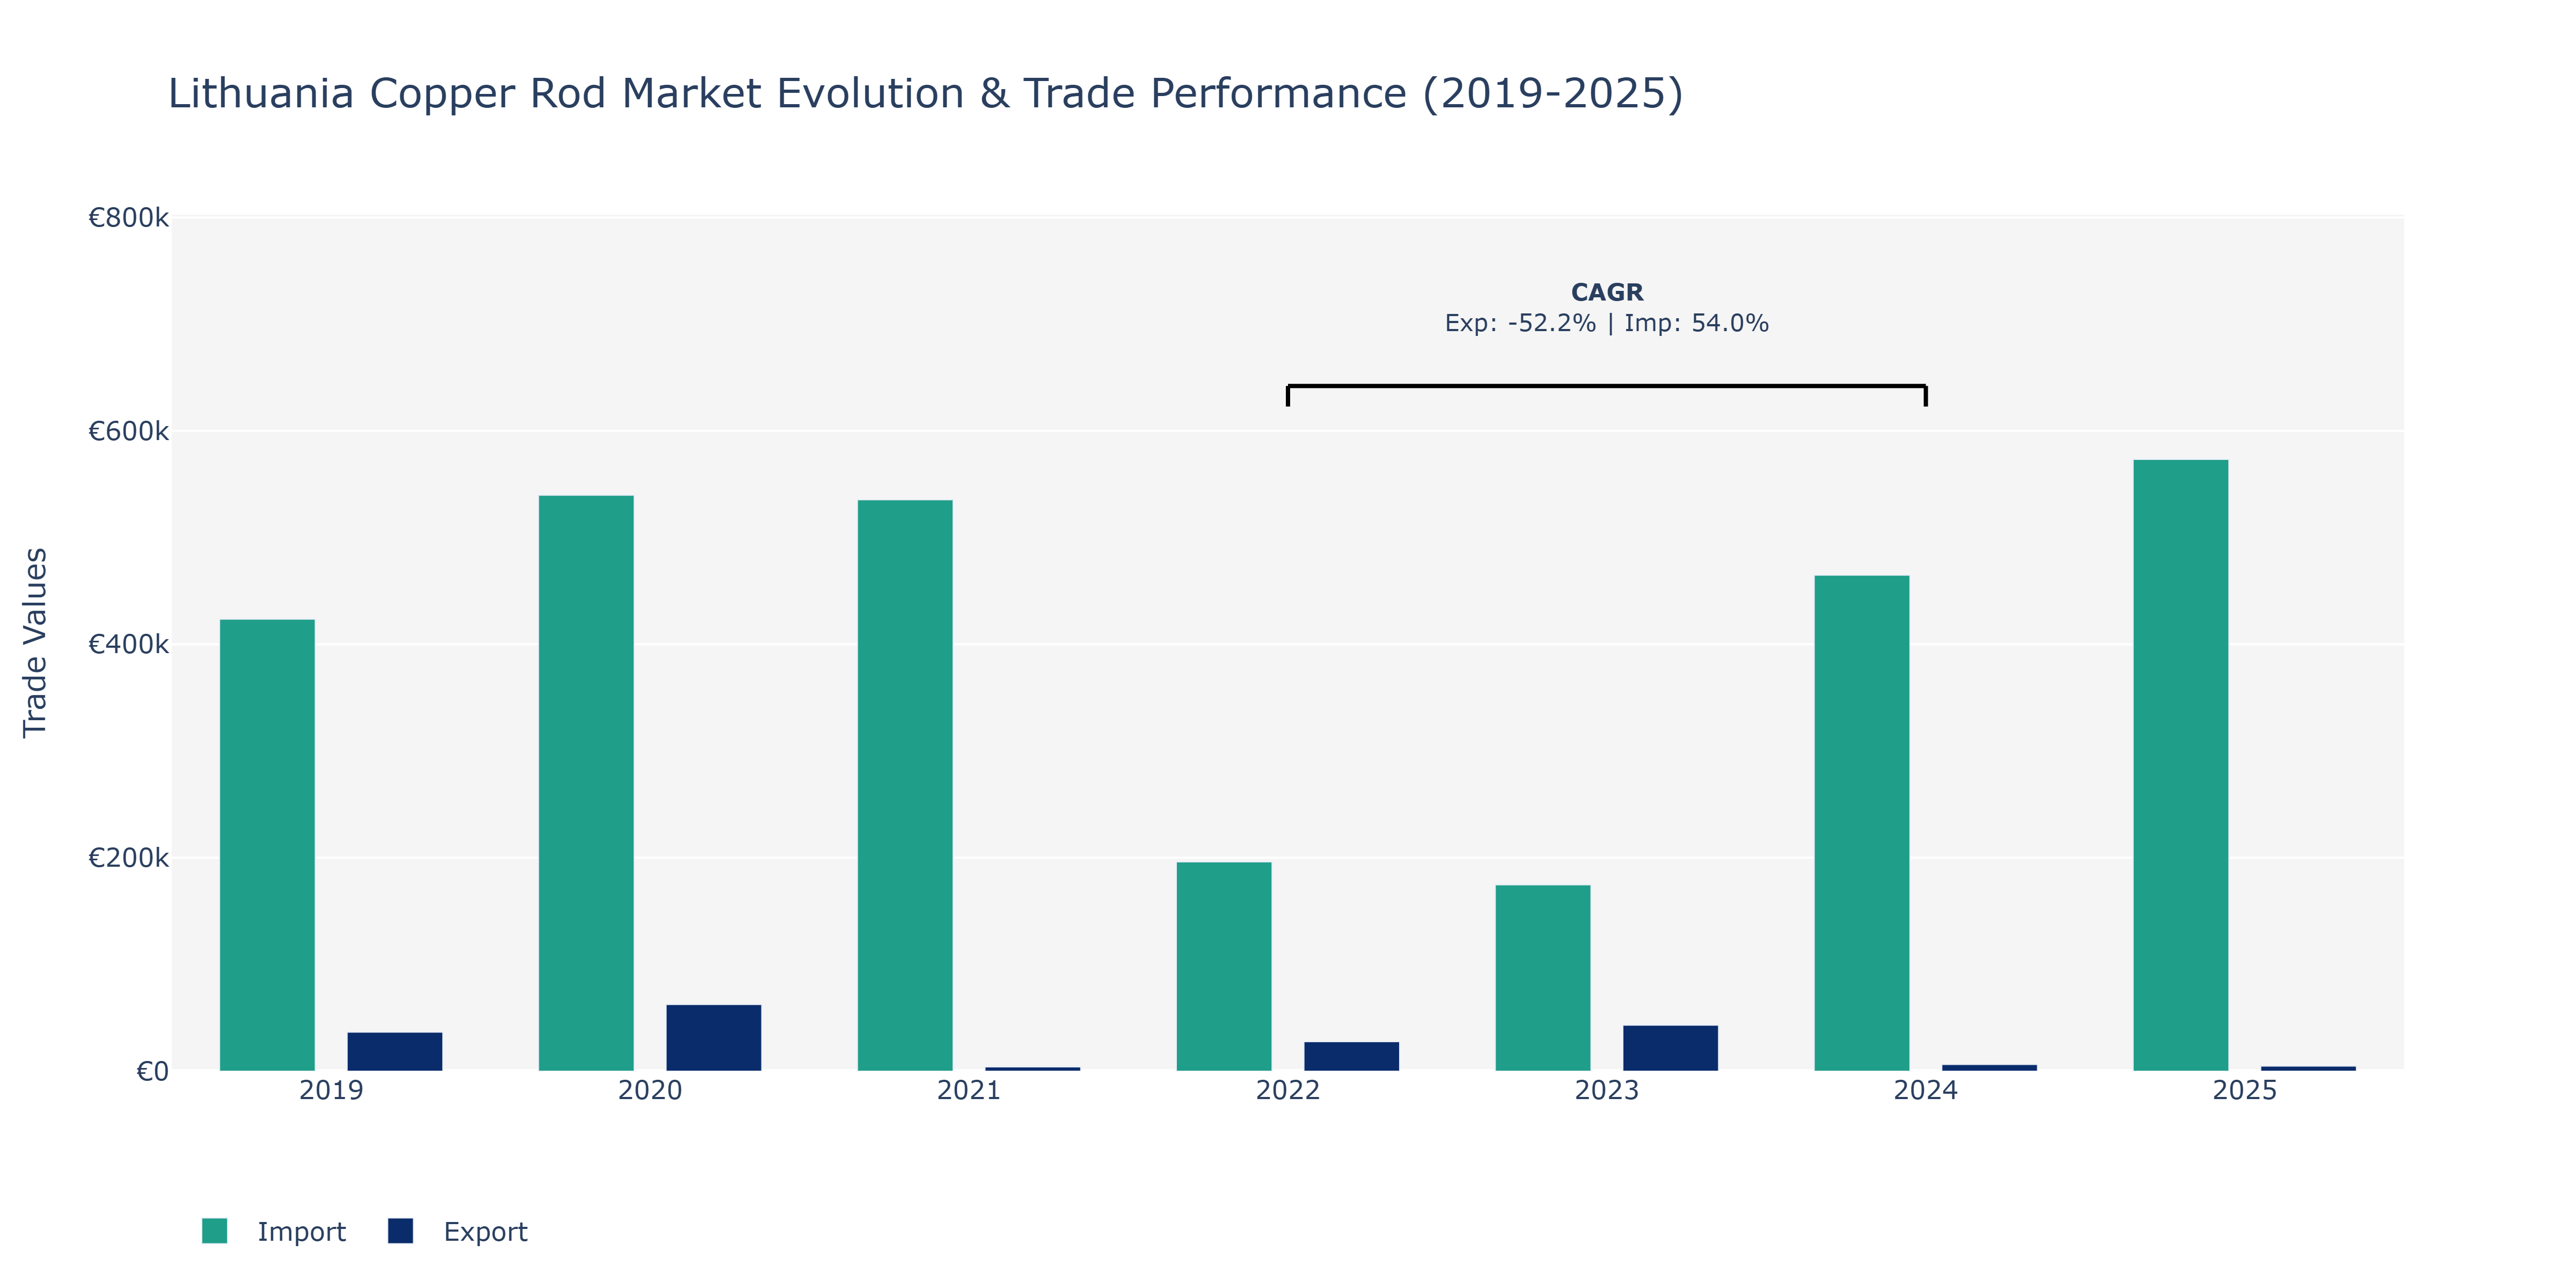
Between 2019 and 2025, Lithuania's Copper Rod Market experienced notable fluctuations in both exports and imports. In 2020, exports saw a substantial increase to €62.53 thousand, but sharply declined in 2021 to €4.01 thousand before showing a recovery in the following years. Imports, on the other hand, consistently increased from €423.51 thousand in 2019 to €573.29 thousand in 2025, reaching its peak in the final year. The surge in imports can be attributed to the growing demand for copper rods in Lithuania's manufacturing sector, potentially driven by infrastructural developments and advancements in renewable energy projects. The fluctuating nature of exports could reflect market dynamics, global copper prices, or shifts in trading partners. The contrasting trends in exports and imports emphasize the market's sensitivity to external factors and underline the need for market players to adapt to changing conditions to maintain competitiveness.
Key Highlights of the Report:
- Lithuania Copper Rod Market Outlook
- Market Size of Lithuania Copper Rod Market, 2025
- Forecast of Lithuania Copper Rod Market, 2032
- Historical Data and Forecast of Lithuania Copper Rod Revenues & Volume for the Period 2022 - 2032F
- Lithuania Copper Rod Market Trend Evolution
- Lithuania Copper Rod Market Drivers and Challenges
- Lithuania Copper Rod Price Trends
- Lithuania Copper Rod Porter's Five Forces
- Lithuania Copper Rod Industry Life Cycle
- Historical Data and Forecast of Lithuania Copper Rod Market Revenues & Volume By Rod Type for the Period 2022 - 2032F
- Historical Data and Forecast of Lithuania Copper Rod Market Revenues & Volume By Round Rod for the Period 2022 - 2032F
- Historical Data and Forecast of Lithuania Copper Rod Market Revenues & Volume By Square Rod for the Period 2022 - 2032F
- Historical Data and Forecast of Lithuania Copper Rod Market Revenues & Volume By Hexagonal Rod for the Period 2022 - 2032F
- Historical Data and Forecast of Lithuania Copper Rod Market Revenues & Volume By Others for the Period 2022 - 2032F
- Historical Data and Forecast of Lithuania Copper Rod Market Revenues & Volume By Processing Method for the Period 2022 - 2032F
- Historical Data and Forecast of Lithuania Copper Rod Market Revenues & Volume By Extrusion for the Period 2022 - 2032F
- Historical Data and Forecast of Lithuania Copper Rod Market Revenues & Volume By Rolling for the Period 2022 - 2032F
- Historical Data and Forecast of Lithuania Copper Rod Market Revenues & Volume By Casting for the Period 2022 - 2032F
- Historical Data and Forecast of Lithuania Copper Rod Market Revenues & Volume By Others for the Period 2022 - 2032F
- Historical Data and Forecast of Lithuania Copper Rod Market Revenues & Volume By End-Use for the Period 2022 - 2032F
- Historical Data and Forecast of Lithuania Copper Rod Market Revenues & Volume By Electrical for the Period 2022 - 2032F
- Historical Data and Forecast of Lithuania Copper Rod Market Revenues & Volume By Industrial for the Period 2022 - 2032F
- Historical Data and Forecast of Lithuania Copper Rod Market Revenues & Volume By Construction for the Period 2022 - 2032F
- Historical Data and Forecast of Lithuania Copper Rod Market Revenues & Volume By Others for the Period 2022 - 2032F
- Historical Data and Forecast of Lithuania Copper Rod Market Revenues & Volume By Material Composition for the Period 2022 - 2032F
- Historical Data and Forecast of Lithuania Copper Rod Market Revenues & Volume By Pure Copper for the Period 2022 - 2032F
- Historical Data and Forecast of Lithuania Copper Rod Market Revenues & Volume By Copper Alloys for the Period 2022 - 2032F
- Historical Data and Forecast of Lithuania Copper Rod Market Revenues & Volume By Recycled Copper for the Period 2022 - 2032F
- Historical Data and Forecast of Lithuania Copper Rod Market Revenues & Volume By Others for the Period 2022 - 2032F
- Historical Data and Forecast of Lithuania Copper Rod Market Revenues & Volume By Distribution Channel for the Period 2022 - 2032F
- Historical Data and Forecast of Lithuania Copper Rod Market Revenues & Volume By Wholesale for the Period 2022 - 2032F
- Historical Data and Forecast of Lithuania Copper Rod Market Revenues & Volume By Retail for the Period 2022 - 2032F
- Historical Data and Forecast of Lithuania Copper Rod Market Revenues & Volume By Direct Sales for the Period 2022 - 2032F
- Historical Data and Forecast of Lithuania Copper Rod Market Revenues & Volume By Others for the Period 2022 - 2032F
- Lithuania Copper Rod Import Export Trade Statistics
- Market Opportunity Assessment By Rod Type
- Market Opportunity Assessment By Processing Method
- Market Opportunity Assessment By End-Use
- Market Opportunity Assessment By Material Composition
- Market Opportunity Assessment By Distribution Channel
- Lithuania Copper Rod Top Companies Market Share
- Lithuania Copper Rod Competitive Benchmarking By Technical and Operational Parameters
- Lithuania Copper Rod Company Profiles
- Lithuania Copper Rod Key Strategic Recommendations
Frequently Asked Questions About the Market Study (FAQs):
6Wresearch actively monitors the Lithuania Copper Rod Market and publishes its comprehensive annual report, highlighting emerging trends, growth drivers, revenue analysis, and forecast outlook. Our insights help businesses to make data-backed strategic decisions with ongoing market dynamics. Our analysts track relevent industries related to the Lithuania Copper Rod Market, allowing our clients with actionable intelligence and reliable forecasts tailored to emerging regional needs.
Yes, we provide customisation as per your requirements. To learn more, feel free to contact us on sales@6wresearch.com
1 Executive Summary |
2 Introduction |
2.1 Key Highlights of the Report |
2.2 Report Description |
2.3 Market Scope & Segmentation |
2.4 Research Methodology |
2.5 Assumptions |
3 Lithuania Copper Rod Market Overview |
3.1 Lithuania Country Macro Economic Indicators |
3.2 Lithuania Copper Rod Market Revenues & Volume, 2022 & 2032F |
3.3 Lithuania Copper Rod Market - Industry Life Cycle |
3.4 Lithuania Copper Rod Market - Porter's Five Forces |
3.5 Lithuania Copper Rod Market Revenues & Volume Share, By Rod Type, 2022 & 2032F |
3.6 Lithuania Copper Rod Market Revenues & Volume Share, By Processing Method, 2022 & 2032F |
3.7 Lithuania Copper Rod Market Revenues & Volume Share, By End-Use, 2022 & 2032F |
3.8 Lithuania Copper Rod Market Revenues & Volume Share, By Material Composition, 2022 & 2032F |
3.9 Lithuania Copper Rod Market Revenues & Volume Share, By Distribution Channel, 2022 & 2032F |
4 Lithuania Copper Rod Market Dynamics |
4.1 Impact Analysis |
4.2 Market Drivers |
4.2.1 Increasing demand for copper rods in the construction industry for electrical wiring and plumbing applications. |
4.2.2 Growth in the automotive sector, where copper rods are used for manufacturing various components. |
4.2.3 Government initiatives promoting the use of copper rods in renewable energy projects. |
4.3 Market Restraints |
4.3.1 Fluctuating prices of copper in the global market impacting the cost of production. |
4.3.2 Competition from alternative materials such as aluminum and steel in certain applications. |
4.3.3 Economic uncertainties affecting investment decisions in infrastructure projects. |
5 Lithuania Copper Rod Market Trends |
6 Lithuania Copper Rod Market, By Types |
6.1 Lithuania Copper Rod Market, By Rod Type |
6.1.1 Overview and Analysis |
6.1.2 Lithuania Copper Rod Market Revenues & Volume, By Rod Type, 2022 - 2032F |
6.1.3 Lithuania Copper Rod Market Revenues & Volume, By Round Rod, 2022 - 2032F |
6.1.4 Lithuania Copper Rod Market Revenues & Volume, By Square Rod, 2022 - 2032F |
6.1.5 Lithuania Copper Rod Market Revenues & Volume, By Hexagonal Rod, 2022 - 2032F |
6.1.6 Lithuania Copper Rod Market Revenues & Volume, By Others, 2022 - 2032F |
6.2 Lithuania Copper Rod Market, By Processing Method |
6.2.1 Overview and Analysis |
6.2.2 Lithuania Copper Rod Market Revenues & Volume, By Extrusion, 2022 - 2032F |
6.2.3 Lithuania Copper Rod Market Revenues & Volume, By Rolling, 2022 - 2032F |
6.2.4 Lithuania Copper Rod Market Revenues & Volume, By Casting, 2022 - 2032F |
6.2.5 Lithuania Copper Rod Market Revenues & Volume, By Others, 2022 - 2032F |
6.3 Lithuania Copper Rod Market, By End-Use |
6.3.1 Overview and Analysis |
6.3.2 Lithuania Copper Rod Market Revenues & Volume, By Electrical, 2022 - 2032F |
6.3.3 Lithuania Copper Rod Market Revenues & Volume, By Industrial, 2022 - 2032F |
6.3.4 Lithuania Copper Rod Market Revenues & Volume, By Construction, 2022 - 2032F |
6.3.5 Lithuania Copper Rod Market Revenues & Volume, By Others, 2022 - 2032F |
6.4 Lithuania Copper Rod Market, By Material Composition |
6.4.1 Overview and Analysis |
6.4.2 Lithuania Copper Rod Market Revenues & Volume, By Pure Copper, 2022 - 2032F |
6.4.3 Lithuania Copper Rod Market Revenues & Volume, By Copper Alloys, 2022 - 2032F |
6.4.4 Lithuania Copper Rod Market Revenues & Volume, By Recycled Copper, 2022 - 2032F |
6.4.5 Lithuania Copper Rod Market Revenues & Volume, By Others, 2022 - 2032F |
6.5 Lithuania Copper Rod Market, By Distribution Channel |
6.5.1 Overview and Analysis |
6.5.2 Lithuania Copper Rod Market Revenues & Volume, By Wholesale, 2022 - 2032F |
6.5.3 Lithuania Copper Rod Market Revenues & Volume, By Retail, 2022 - 2032F |
6.5.4 Lithuania Copper Rod Market Revenues & Volume, By Direct Sales, 2022 - 2032F |
6.5.5 Lithuania Copper Rod Market Revenues & Volume, By Others, 2022 - 2032F |
7 Lithuania Copper Rod Market Import-Export Trade Statistics |
7.1 Lithuania Copper Rod Market Export to Major Countries |
7.2 Lithuania Copper Rod Market Imports from Major Countries |
8 Lithuania Copper Rod Market Key Performance Indicators |
8.1 Average selling price of copper rods. |
8.2 Percentage of copper rod sales to the construction industry. |
8.3 Number of new renewable energy projects using copper rods. |
8.4 Capacity utilization rate of copper rod manufacturing facilities. |
8.5 Percentage of copper rod imports compared to domestic production. |
9 Lithuania Copper Rod Market - Opportunity Assessment |
9.1 Lithuania Copper Rod Market Opportunity Assessment, By Rod Type, 2022 & 2032F |
9.2 Lithuania Copper Rod Market Opportunity Assessment, By Processing Method, 2022 & 2032F |
9.3 Lithuania Copper Rod Market Opportunity Assessment, By End-Use, 2022 & 2032F |
9.4 Lithuania Copper Rod Market Opportunity Assessment, By Material Composition, 2022 & 2032F |
9.5 Lithuania Copper Rod Market Opportunity Assessment, By Distribution Channel, 2022 & 2032F |
10 Lithuania Copper Rod Market - Competitive Landscape |
10.1 Lithuania Copper Rod Market Revenue Share, By Companies, 2025 |
10.2 Lithuania Copper Rod Market Competitive Benchmarking, By Operating and Technical Parameters |
11 Company Profiles |
12 Recommendations |
13 Disclaimer |
Export potential assessment - trade Analytics for 2030
Export potential enables firms to identify high-growth global markets with greater confidence by combining advanced trade intelligence with a structured quantitative methodology. The framework analyzes emerging demand trends and country-level import patterns while integrating macroeconomic and trade datasets such as GDP and population forecasts, bilateral import–export flows, tariff structures, elasticity differentials between developed and developing economies, geographic distance, and import demand projections. Using weighted trade values from 2020–2024 as the base period to project country-to-country export potential for 2030, these inputs are operationalized through calculated drivers such as gravity model parameters, tariff impact factors, and projected GDP per-capita growth. Through an analysis of hidden potentials, demand hotspots, and market conditions that are most favorable to success, this method enables firms to focus on target countries, maximize returns, and global expansion with data, backed by accuracy.
By factoring in the projected importer demand gap that is currently unmet and could be potential opportunity, it identifies the potential for the Exporter (Country) among 190 countries, against the general trade analysis, which identifies the biggest importer or exporter.
To discover high-growth global markets and optimize your business strategy:
Click Here
Pricing
- Single User License$ 1,995
- Department License$ 2,400
- Site License$ 3,120
- Global License$ 3,795

Search
Thought Leadership and Analyst Meet


Our Clients
Latest Reports
- Philippines Polyhydroxybutyrate-co-Hydroxyvalerate Market (2026-2032) | Trends, Insights, Challenges, Restraints, Competition, Size, Value, Forecast, Pricing, Share, Outlook, Revenue, Investment Opportunities, Strategy, Drivers, Demand, Growth, segmentation, Analysis, Companies
- Peru Polyhydroxybutyrate-co-Hydroxyvalerate Market (2026-2032) | Growth, Demand, Challenges, Share, Trends, Analysis, Pricing, Investment Opportunities, Drivers, Value, Forecast, Competition, Size, Companies, Insights, Outlook, Restraints, segmentation, Revenue, Strategy
- Pakistan Polyhydroxybutyrate-co-Hydroxyvalerate Market (2026-2032) | Restraints, segmentation, Pricing, Forecast, Share, Strategy, Competition, Trends, Insights, Drivers, Challenges, Growth, Revenue, Outlook, Value, Investment Opportunities, Companies, Size, Analysis, Demand
- Oman Polyhydroxybutyrate-co-Hydroxyvalerate Market (2026-2032) | Drivers, segmentation, Insights, Competition, Pricing, Outlook, Size, Revenue, Challenges, Forecast, Analysis, Growth, Value, Share, Trends, Investment Opportunities, Strategy, Restraints, Companies, Demand
- Nigeria Polyhydroxybutyrate-co-Hydroxyvalerate Market (2026-2032) | Value, Investment Opportunities, Analysis, Revenue, Restraints, Pricing, Outlook, Competition, Demand, Growth, Forecast, Companies, Trends, Challenges, segmentation, Drivers, Insights, Share, Size, Strategy
- Nepal Polyhydroxybutyrate-co-Hydroxyvalerate Market (2026-2032) | Insights, Analysis, Drivers, Share, Revenue, Demand, segmentation, Investment Opportunities, Competition, Forecast, Growth, Pricing, Companies, Strategy, Trends, Restraints, Challenges, Outlook, Size, Value
- Myanmar Polyhydroxybutyrate-co-Hydroxyvalerate Market (2026-2032) | Outlook, Revenue, Strategy, Restraints, Drivers, segmentation, Share, Forecast, Competition, Insights, Growth, Pricing, Size, Demand, Value, Companies, Trends, Challenges, Investment Opportunities, Analysis
- Morocco Polyhydroxybutyrate-co-Hydroxyvalerate Market (2026-2032) | Outlook, Investment Opportunities, Restraints, Strategy, Forecast, Challenges, Drivers, Growth, Companies, segmentation, Trends, Size, Competition, Revenue, Demand, Insights, Share, Analysis, Value, Pricing
- Mexico Polyhydroxybutyrate-co-Hydroxyvalerate Market (2026-2032) | Size, Drivers, Outlook, Share, Strategy, Growth, Pricing, Challenges, Companies, Demand, Value, Investment Opportunities, Restraints, Trends, Forecast, segmentation, Analysis, Insights, Competition, Revenue
- Malaysia Polyhydroxybutyrate-co-Hydroxyvalerate Market (2026-2032) | Share, segmentation, Size, Companies, Analysis, Insights, Forecast, Value, Revenue, Drivers, Restraints, Challenges, Investment Opportunities, Trends, Competition, Strategy, Demand, Growth, Outlook, Pricing
Industry Events and Analyst Meet

HIMTEX 2026

India Refining Summit 2026

India EV Show 2026

EV tech India Expo 2026

Auto Tech Asia 2026
Whitepaper
- Middle East & Africa Commercial Security Market Click here to view more.
- Middle East & Africa Fire Safety Systems & Equipment Market Click here to view more.
- GCC Drone Market Click here to view more.
- Middle East Lighting Fixture Market Click here to view more.
- GCC Physical & Perimeter Security Market Click here to view more.
6WResearch In News
- Doha a strategic location for EV manufacturing hub: IPA Qatar
- Demand for luxury TVs surging in the GCC, says Samsung
- Empowering Growth: The Thriving Journey of Bangladesh’s Cable Industry
- Demand for luxury TVs surging in the GCC, says Samsung
- Video call with a traditional healer? Once unthinkable, it’s now common in South Africa
- Intelligent Buildings To Smooth GCC’s Path To Net Zero