Lithuania Dichloroethane Market (2026-2032) | Industry, Size, Trends, Share, Analysis, Companies, Forecast, Value, Outlook, Segmentation, Revenue & Growth
Market Forecast By Application (Ethylenediamine, Ethylene Glycol, Polyvinyl Chloride, Nylon, Rayon, Others), By Product (Paints, Coatings, Soap, Cleaners, Others) And Competitive Landscape
| Product Code: ETC4789123 | Publication Date: Nov 2023 | Updated Date: Apr 2026 | Product Type: Market Research Report | |
| Publisher: 6Wresearch | Author: Shubham Padhi | No. of Pages: 60 | No. of Figures: 30 | No. of Tables: 5 |
Lithuania Dichloroethane Market Size (2020-2030)
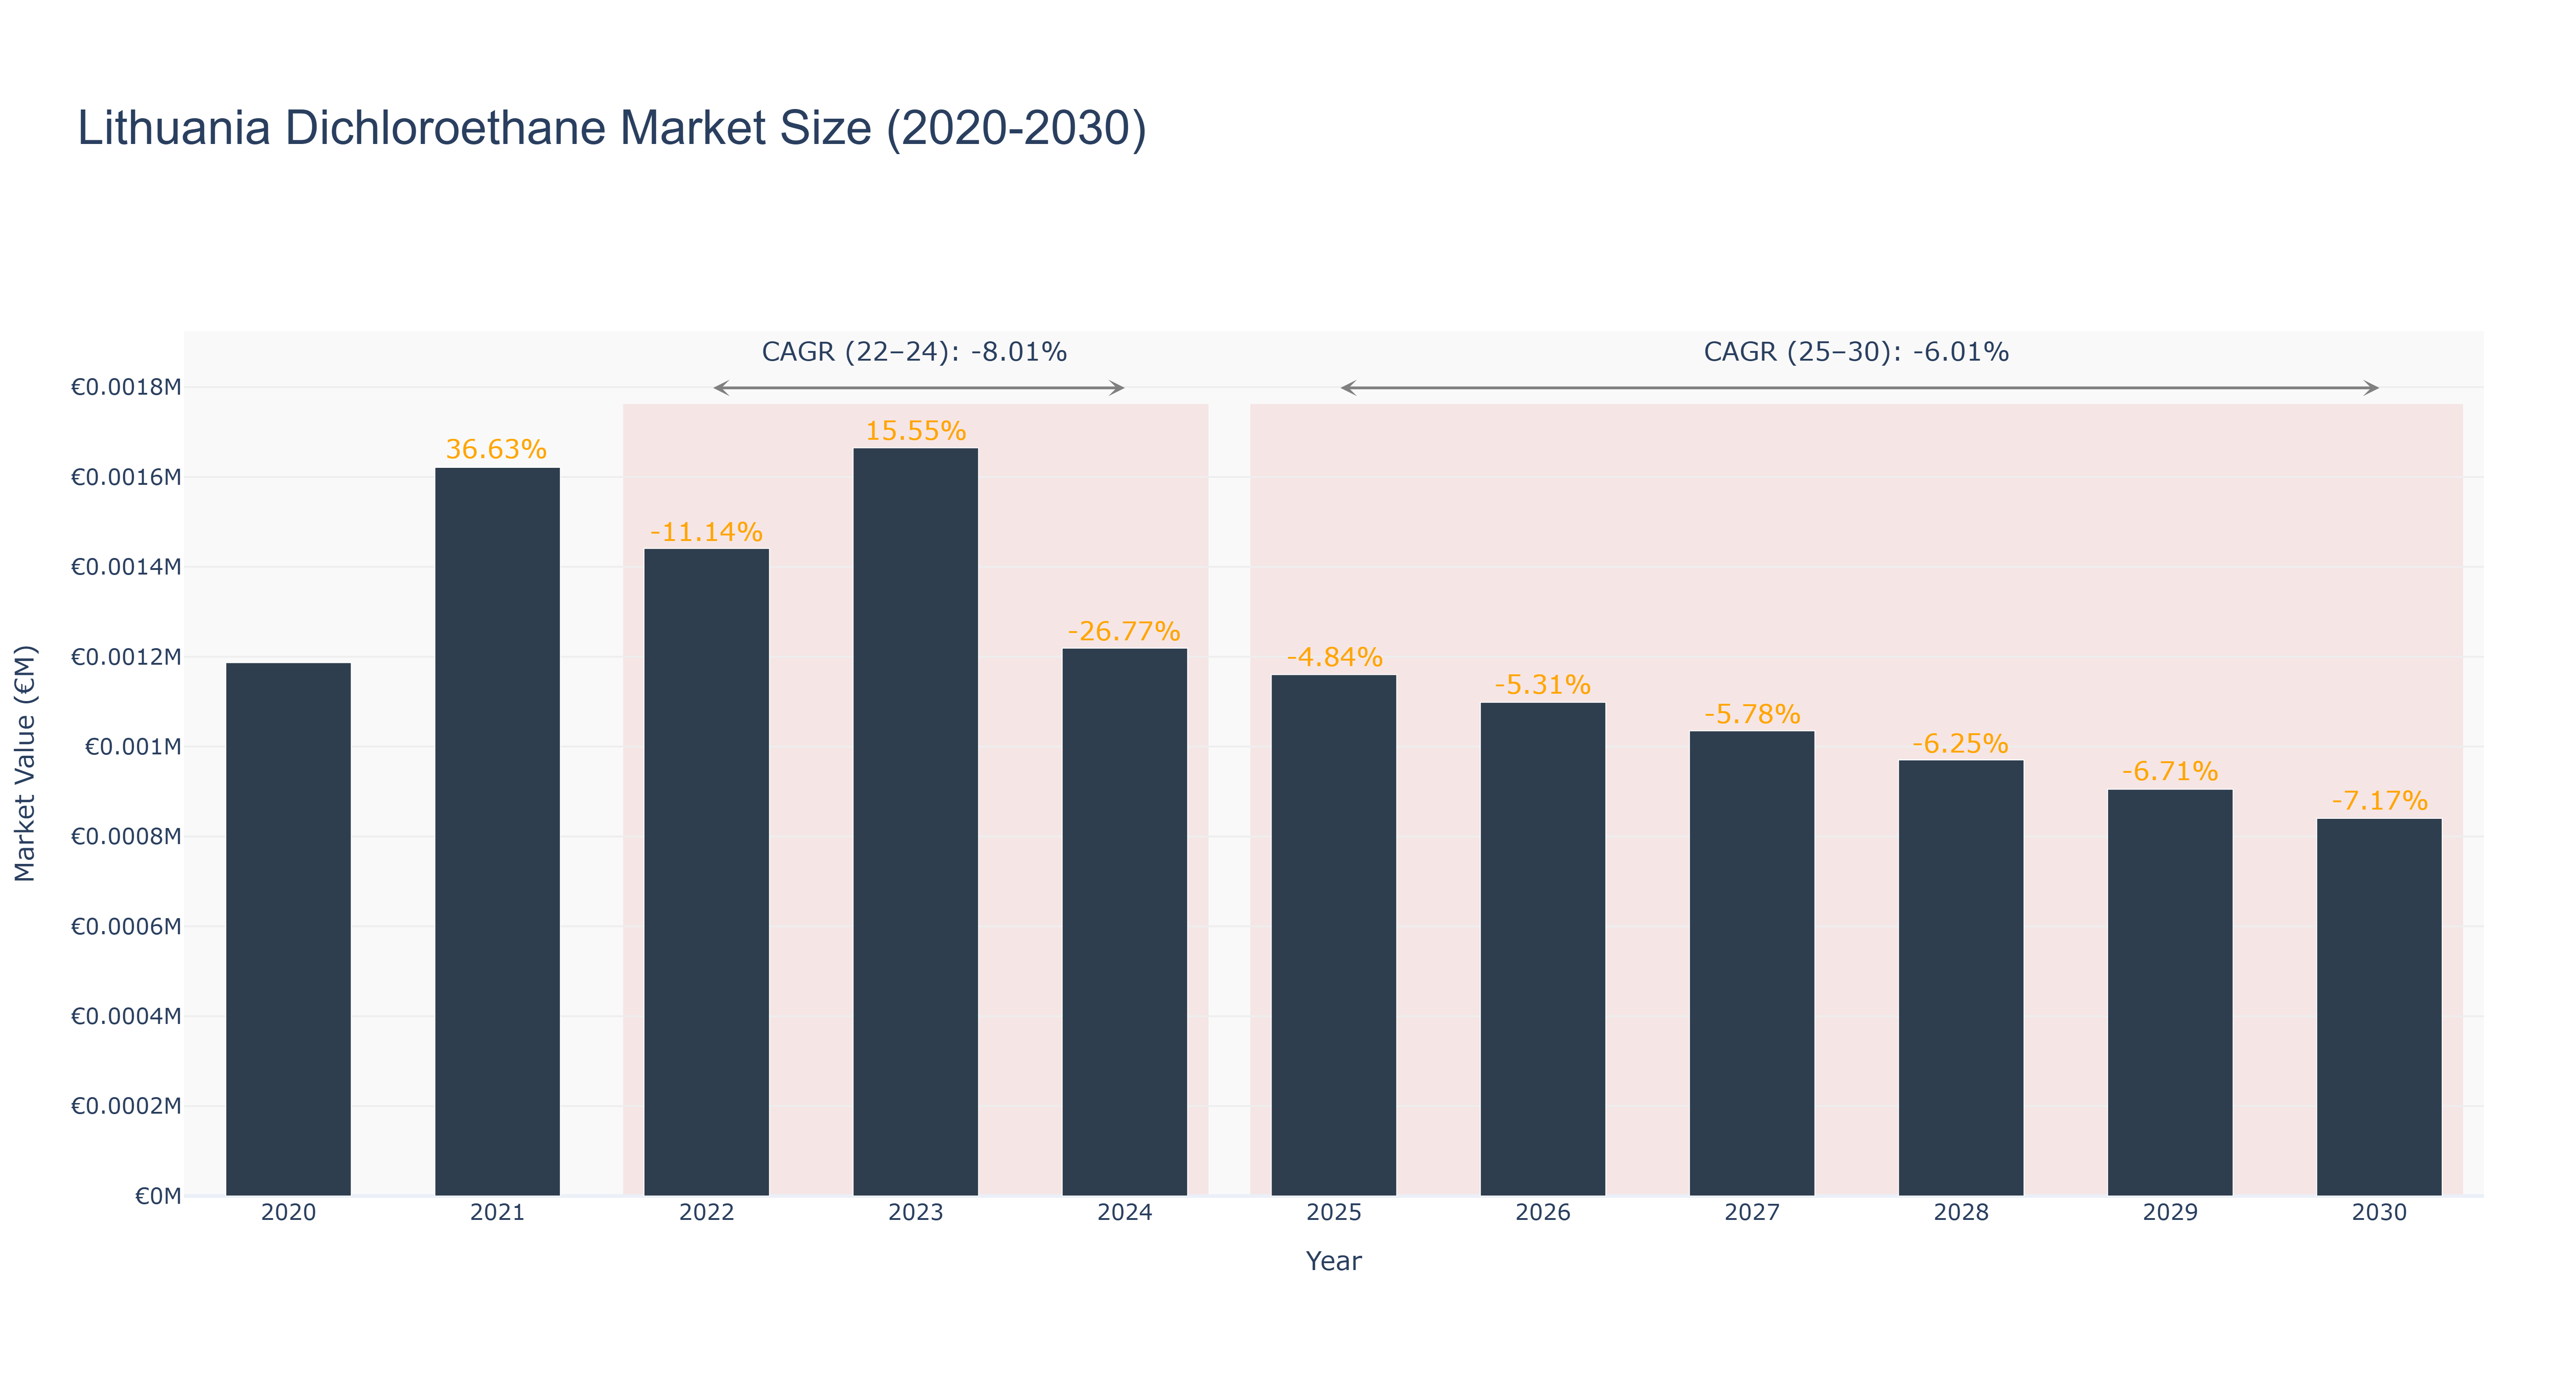
The Lithuania Dichloroethane Market has experienced a fluctuating trajectory in recent years, peaking at €1.62 thousand in 2021 before declining to €1.22 thousand in 2024, reflecting an actual CAGR of -8.01% from 2022 to 2024. The market saw significant growth in 2021, driven by increased demand in industrial applications, but faced a downturn in subsequent years due to regulatory challenges and reduced production capacities. Looking ahead, the forecasted period from 2025 to 2030 suggests a continued decline, with projected market sizes decreasing from €1.16 thousand in 2025 to €840.32 thousand in 2030, corresponding to a CAGR of -6.01%. Factors contributing to this decline include ongoing environmental regulations and a shift towards more sustainable alternatives. While specific upcoming projects in the dichloroethane sector are not highlighted, the broader industry may be influenced by the global transition towards greener chemical processes, potentially reshaping future demand dynamics.
Lithuania Dichloroethane Market: Production & Trade Performance (2019-2025)

In the Lithuania Dichloroethane Market, imports experienced notable fluctuations over the years. Starting at €370 thousand in 2019, imports surged to €1.61 thousand in 2020, marking a substantial increase. However, in 2021, imports decreased to €1.13 thousand despite a modest uptick in exports to €39 million. This divergence suggests a shift in market dynamics or demand patterns within the industry. The following years saw varying levels of imports, with a significant decline to €564 thousand in 2024 before a partial recovery to €423 thousand in 2025. The observed fluctuations may be attributed to multiple factors such as changes in production capacities, global market conditions, or regulatory influences affecting import volumes. The negative CAGR of -34.31% for imports between 2022 and 2024 indicates a substantial contraction in the market, potentially driven by supply chain disruptions, price fluctuations, or evolving trade policies impacting the dichloroethane sector. Further research into regional demand drivers and competitive landscapes could provide deeper insights into the market dynamics influencing import trends in Lithuania.
Key Highlights of the Report:
- Lithuania Dichloroethane Market Outlook
- Market Size of Lithuania Dichloroethane Market, 2025
- Forecast of Lithuania Dichloroethane Market, 2032
- Historical Data and Forecast of Lithuania Dichloroethane Revenues & Volume for the Period 2022 - 2032F
- Lithuania Dichloroethane Market Trend Evolution
- Lithuania Dichloroethane Market Drivers and Challenges
- Lithuania Dichloroethane Price Trends
- Lithuania Dichloroethane Porter`s Five Forces
- Lithuania Dichloroethane Industry Life Cycle
- Historical Data and Forecast of Lithuania Dichloroethane Market Revenues & Volume By Application for the Period 2022 - 2032F
- Historical Data and Forecast of Lithuania Dichloroethane Market Revenues & Volume By Ethylenediamine for the Period 2022 - 2032F
- Historical Data and Forecast of Lithuania Dichloroethane Market Revenues & Volume By Ethylene Glycol for the Period 2022 - 2032F
- Historical Data and Forecast of Lithuania Dichloroethane Market Revenues & Volume By Polyvinyl Chloride for the Period 2022 - 2032F
- Historical Data and Forecast of Lithuania Dichloroethane Market Revenues & Volume By Nylon for the Period 2022 - 2032F
- Historical Data and Forecast of Lithuania Dichloroethane Market Revenues & Volume By Rayon for the Period 2022 - 2032F
- Historical Data and Forecast of Lithuania Dichloroethane Market Revenues & Volume By Others for the Period 2022 - 2032F
- Historical Data and Forecast of Lithuania Dichloroethane Market Revenues & Volume By Product for the Period 2022 - 2032F
- Historical Data and Forecast of Lithuania Dichloroethane Market Revenues & Volume By Paints for the Period 2022 - 2032F
- Historical Data and Forecast of Lithuania Dichloroethane Market Revenues & Volume By Coatings for the Period 2022 - 2032F
- Historical Data and Forecast of Lithuania Dichloroethane Market Revenues & Volume By Soap for the Period 2022 - 2032F
- Historical Data and Forecast of Lithuania Dichloroethane Market Revenues & Volume By Cleaners for the Period 2022 - 2032F
- Historical Data and Forecast of Lithuania Dichloroethane Market Revenues & Volume By Others for the Period 2022 - 2032F
- Lithuania Dichloroethane Import Export Trade Statistics
- Market Opportunity Assessment By Application
- Market Opportunity Assessment By Product
- Lithuania Dichloroethane Top Companies Market Share
- Lithuania Dichloroethane Competitive Benchmarking By Technical and Operational Parameters
- Lithuania Dichloroethane Company Profiles
- Lithuania Dichloroethane Key Strategic Recommendations
Frequently Asked Questions About the Market Study (FAQs):
6Wresearch actively monitors the Lithuania Dichloroethane Market and publishes its comprehensive annual report, highlighting emerging trends, growth drivers, revenue analysis, and forecast outlook. Our insights help businesses to make data-backed strategic decisions with ongoing market dynamics. Our analysts track relevent industries related to the Lithuania Dichloroethane Market, allowing our clients with actionable intelligence and reliable forecasts tailored to emerging regional needs.
Yes, we provide customisation as per your requirements. To learn more, feel free to contact us on sales@6wresearch.com
1 Executive Summary |
2 Introduction |
2.1 Key Highlights of the Report |
2.2 Report Description |
2.3 Market Scope & Segmentation |
2.4 Research Methodology |
2.5 Assumptions |
3 Lithuania Dichloroethane Market Overview |
3.1 Lithuania Country Macro Economic Indicators |
3.2 Lithuania Dichloroethane Market Revenues & Volume, 2022 & 2032F |
3.3 Lithuania Dichloroethane Market - Industry Life Cycle |
3.4 Lithuania Dichloroethane Market - Porter's Five Forces |
3.5 Lithuania Dichloroethane Market Revenues & Volume Share, By Application, 2022 & 2032F |
3.6 Lithuania Dichloroethane Market Revenues & Volume Share, By Product, 2022 & 2032F |
4 Lithuania Dichloroethane Market Dynamics |
4.1 Impact Analysis |
4.2 Market Drivers |
4.2.1 Growing demand for dichloroethane in various industries such as pharmaceuticals, agrochemicals, and plastics manufacturing. |
4.2.2 Increasing investments in infrastructure projects and construction activities in Lithuania. |
4.2.3 Favorable government regulations and policies supporting the use of dichloroethane in key industries. |
4.3 Market Restraints |
4.3.1 Fluctuating raw material prices impacting the production cost of dichloroethane. |
4.3.2 Environmental concerns and stringent regulations regarding the disposal and handling of dichloroethane. |
4.3.3 Competition from alternative chemicals or technologies affecting the market demand for dichloroethane. |
5 Lithuania Dichloroethane Market Trends |
6 Lithuania Dichloroethane Market Segmentations |
6.1 Lithuania Dichloroethane Market, By Application |
6.1.1 Overview and Analysis |
6.1.2 Lithuania Dichloroethane Market Revenues & Volume, By Ethylenediamine, 2022 - 2032F |
6.1.3 Lithuania Dichloroethane Market Revenues & Volume, By Ethylene Glycol, 2022 - 2032F |
6.1.4 Lithuania Dichloroethane Market Revenues & Volume, By Polyvinyl Chloride, 2022 - 2032F |
6.1.5 Lithuania Dichloroethane Market Revenues & Volume, By Nylon, 2022 - 2032F |
6.1.6 Lithuania Dichloroethane Market Revenues & Volume, By Rayon, 2022 - 2032F |
6.1.7 Lithuania Dichloroethane Market Revenues & Volume, By Others, 2022 - 2032F |
6.2 Lithuania Dichloroethane Market, By Product |
6.2.1 Overview and Analysis |
6.2.2 Lithuania Dichloroethane Market Revenues & Volume, By Paints, 2022 - 2032F |
6.2.3 Lithuania Dichloroethane Market Revenues & Volume, By Coatings, 2022 - 2032F |
6.2.4 Lithuania Dichloroethane Market Revenues & Volume, By Soap, 2022 - 2032F |
6.2.5 Lithuania Dichloroethane Market Revenues & Volume, By Cleaners, 2022 - 2032F |
6.2.6 Lithuania Dichloroethane Market Revenues & Volume, By Others, 2022 - 2032F |
7 Lithuania Dichloroethane Market Import-Export Trade Statistics |
7.1 Lithuania Dichloroethane Market Export to Major Countries |
7.2 Lithuania Dichloroethane Market Imports from Major Countries |
8 Lithuania Dichloroethane Market Key Performance Indicators |
8.1 Capacity utilization rate of dichloroethane production facilities in Lithuania. |
8.2 Average selling price of dichloroethane in the market. |
8.3 Number of new product developments or innovations in the dichloroethane sector. |
8.4 Environmental compliance metrics related to the use and disposal of dichloroethane. |
9 Lithuania Dichloroethane Market - Opportunity Assessment |
9.1 Lithuania Dichloroethane Market Opportunity Assessment, By Application, 2022 & 2032F |
9.2 Lithuania Dichloroethane Market Opportunity Assessment, By Product, 2022 & 2032F |
10 Lithuania Dichloroethane Market - Competitive Landscape |
10.1 Lithuania Dichloroethane Market Revenue Share, By Companies, 2025 |
10.2 Lithuania Dichloroethane Market Competitive Benchmarking, By Operating and Technical Parameters |
11 Company Profiles |
12 Recommendations | 13 Disclaimer |
Export potential assessment - trade Analytics for 2030
Export potential enables firms to identify high-growth global markets with greater confidence by combining advanced trade intelligence with a structured quantitative methodology. The framework analyzes emerging demand trends and country-level import patterns while integrating macroeconomic and trade datasets such as GDP and population forecasts, bilateral import–export flows, tariff structures, elasticity differentials between developed and developing economies, geographic distance, and import demand projections. Using weighted trade values from 2020–2024 as the base period to project country-to-country export potential for 2030, these inputs are operationalized through calculated drivers such as gravity model parameters, tariff impact factors, and projected GDP per-capita growth. Through an analysis of hidden potentials, demand hotspots, and market conditions that are most favorable to success, this method enables firms to focus on target countries, maximize returns, and global expansion with data, backed by accuracy.
By factoring in the projected importer demand gap that is currently unmet and could be potential opportunity, it identifies the potential for the Exporter (Country) among 190 countries, against the general trade analysis, which identifies the biggest importer or exporter.
To discover high-growth global markets and optimize your business strategy:
Click Here
Pricing
- Single User License$ 1,995
- Department License$ 2,400
- Site License$ 3,120
- Global License$ 3,795

Search
Thought Leadership and Analyst Meet


Our Clients
Latest Reports
- France Thermally Conductive Filler Dispersants Market (2026-2032) | Challenges, Restraints, Value, Share, Size, segmentation, Analysis, Trends, Investment Opportunities, Outlook, Pricing, Demand, Forecast, Revenue, Companies, Growth, Drivers, Strategy, Insights, Competition
- Egypt Thermally Conductive Filler Dispersants Market (2026-2032) | Competition, Forecast, Strategy, Value, Insights, Outlook, Investment Opportunities, Pricing, Demand, Share, segmentation, Drivers, Size, Companies, Restraints, Growth, Trends, Revenue, Challenges, Analysis
- Czech Republic Thermally Conductive Filler Dispersants Market (2026-2032) | Forecast, Pricing, Analysis, Drivers, Insights, Size, Demand, Growth, Challenges, segmentation, Competition, Outlook, Trends, Investment Opportunities, Companies, Strategy, Revenue, Share, Value, Restraints
- Colombia Thermally Conductive Filler Dispersants Market (2026-2032) | segmentation, Trends, Share, Drivers, Strategy, Companies, Demand, Insights, Size, Challenges, Value, Competition, Analysis, Growth, Revenue, Restraints, Forecast, Pricing, Outlook, Investment Opportunities
- China Thermally Conductive Filler Dispersants Market (2026-2032) | Restraints, Investment Opportunities, Pricing, Companies, Share, Size, Challenges, Trends, Outlook, Value, Analysis, Competition, Revenue, Drivers, Forecast, Demand, Insights, Growth, Strategy, segmentation
- Chile Thermally Conductive Filler Dispersants Market (2026-2032) | Investment Opportunities, Trends, Value, Restraints, Share, Companies, Forecast, segmentation, Pricing, Challenges, Demand, Size, Analysis, Drivers, Outlook, Growth, Competition, Strategy, Revenue, Insights
- Cambodia Thermally Conductive Filler Dispersants Market (2026-2032) | Analysis, Share, Outlook, Strategy, Pricing, Demand, Size, Growth, segmentation, Insights, Revenue, Forecast, Challenges, Competition, Companies, Investment Opportunities, Trends, Restraints, Value, Drivers
- Brazil Thermally Conductive Filler Dispersants Market (2026-2032) | Restraints, Forecast, Competition, Size, Revenue, Value, Investment Opportunities, Trends, Insights, Outlook, Growth, Analysis, Drivers, segmentation, Pricing, Challenges, Strategy, Share, Companies, Demand
- Bangladesh Thermally Conductive Filler Dispersants Market (2026-2032) | Restraints, Trends, Analysis, Competition, Insights, Forecast, Value, Investment Opportunities, Pricing, Share, Demand, Outlook, Revenue, segmentation, Companies, Drivers, Growth, Size, Challenges, Strategy
- Bahrain Thermally Conductive Filler Dispersants Market (2026-2032) | Trends, Outlook, Pricing, Demand, Value, Competition, Forecast, Growth, segmentation, Revenue, Companies, Analysis, Insights, Size, Drivers, Challenges, Strategy, Investment Opportunities, Share, Restraints
Industry Events and Analyst Meet

HIMTEX 2026

India Refining Summit 2026

India EV Show 2026

EV tech India Expo 2026

Auto Tech Asia 2026
Whitepaper
- Middle East & Africa Commercial Security Market Click here to view more.
- Middle East & Africa Fire Safety Systems & Equipment Market Click here to view more.
- GCC Drone Market Click here to view more.
- Middle East Lighting Fixture Market Click here to view more.
- GCC Physical & Perimeter Security Market Click here to view more.
6WResearch In News
- Doha a strategic location for EV manufacturing hub: IPA Qatar
- Demand for luxury TVs surging in the GCC, says Samsung
- Empowering Growth: The Thriving Journey of Bangladesh’s Cable Industry
- Demand for luxury TVs surging in the GCC, says Samsung
- Video call with a traditional healer? Once unthinkable, it’s now common in South Africa
- Intelligent Buildings To Smooth GCC’s Path To Net Zero