Lithuania Erucic Acid Market (2026-2032) | Forecast, Outlook, Segmentation, Industry, Growth, Size, Analysis, Value, Companies, Share, Revenue & Trends
Market Forecast By Grade (Erucic acid 43-50%, Erucic acid >50%), By Application (Slip Agent, Emollient, Hair care and textile softening, Pour point depressant, Lubricants, Food emulsifier, Others), By Source (Rapeseed oil, Canola, Tame Mustard, Fish, Others), By End Users (Plastic, Printing Ink, Food, Personal Care, Rubber, Pharmaceutical, Others) And Competitive Landscape
| Product Code: ETC5343866 | Publication Date: Nov 2023 | Updated Date: Apr 2026 | Product Type: Market Research Report | |
| Publisher: 6Wresearch | Author: Ravi Bhandari | No. of Pages: 60 | No. of Figures: 30 | No. of Tables: 5 |
Lithuania Erucic Acid Market Size (2020-2030)
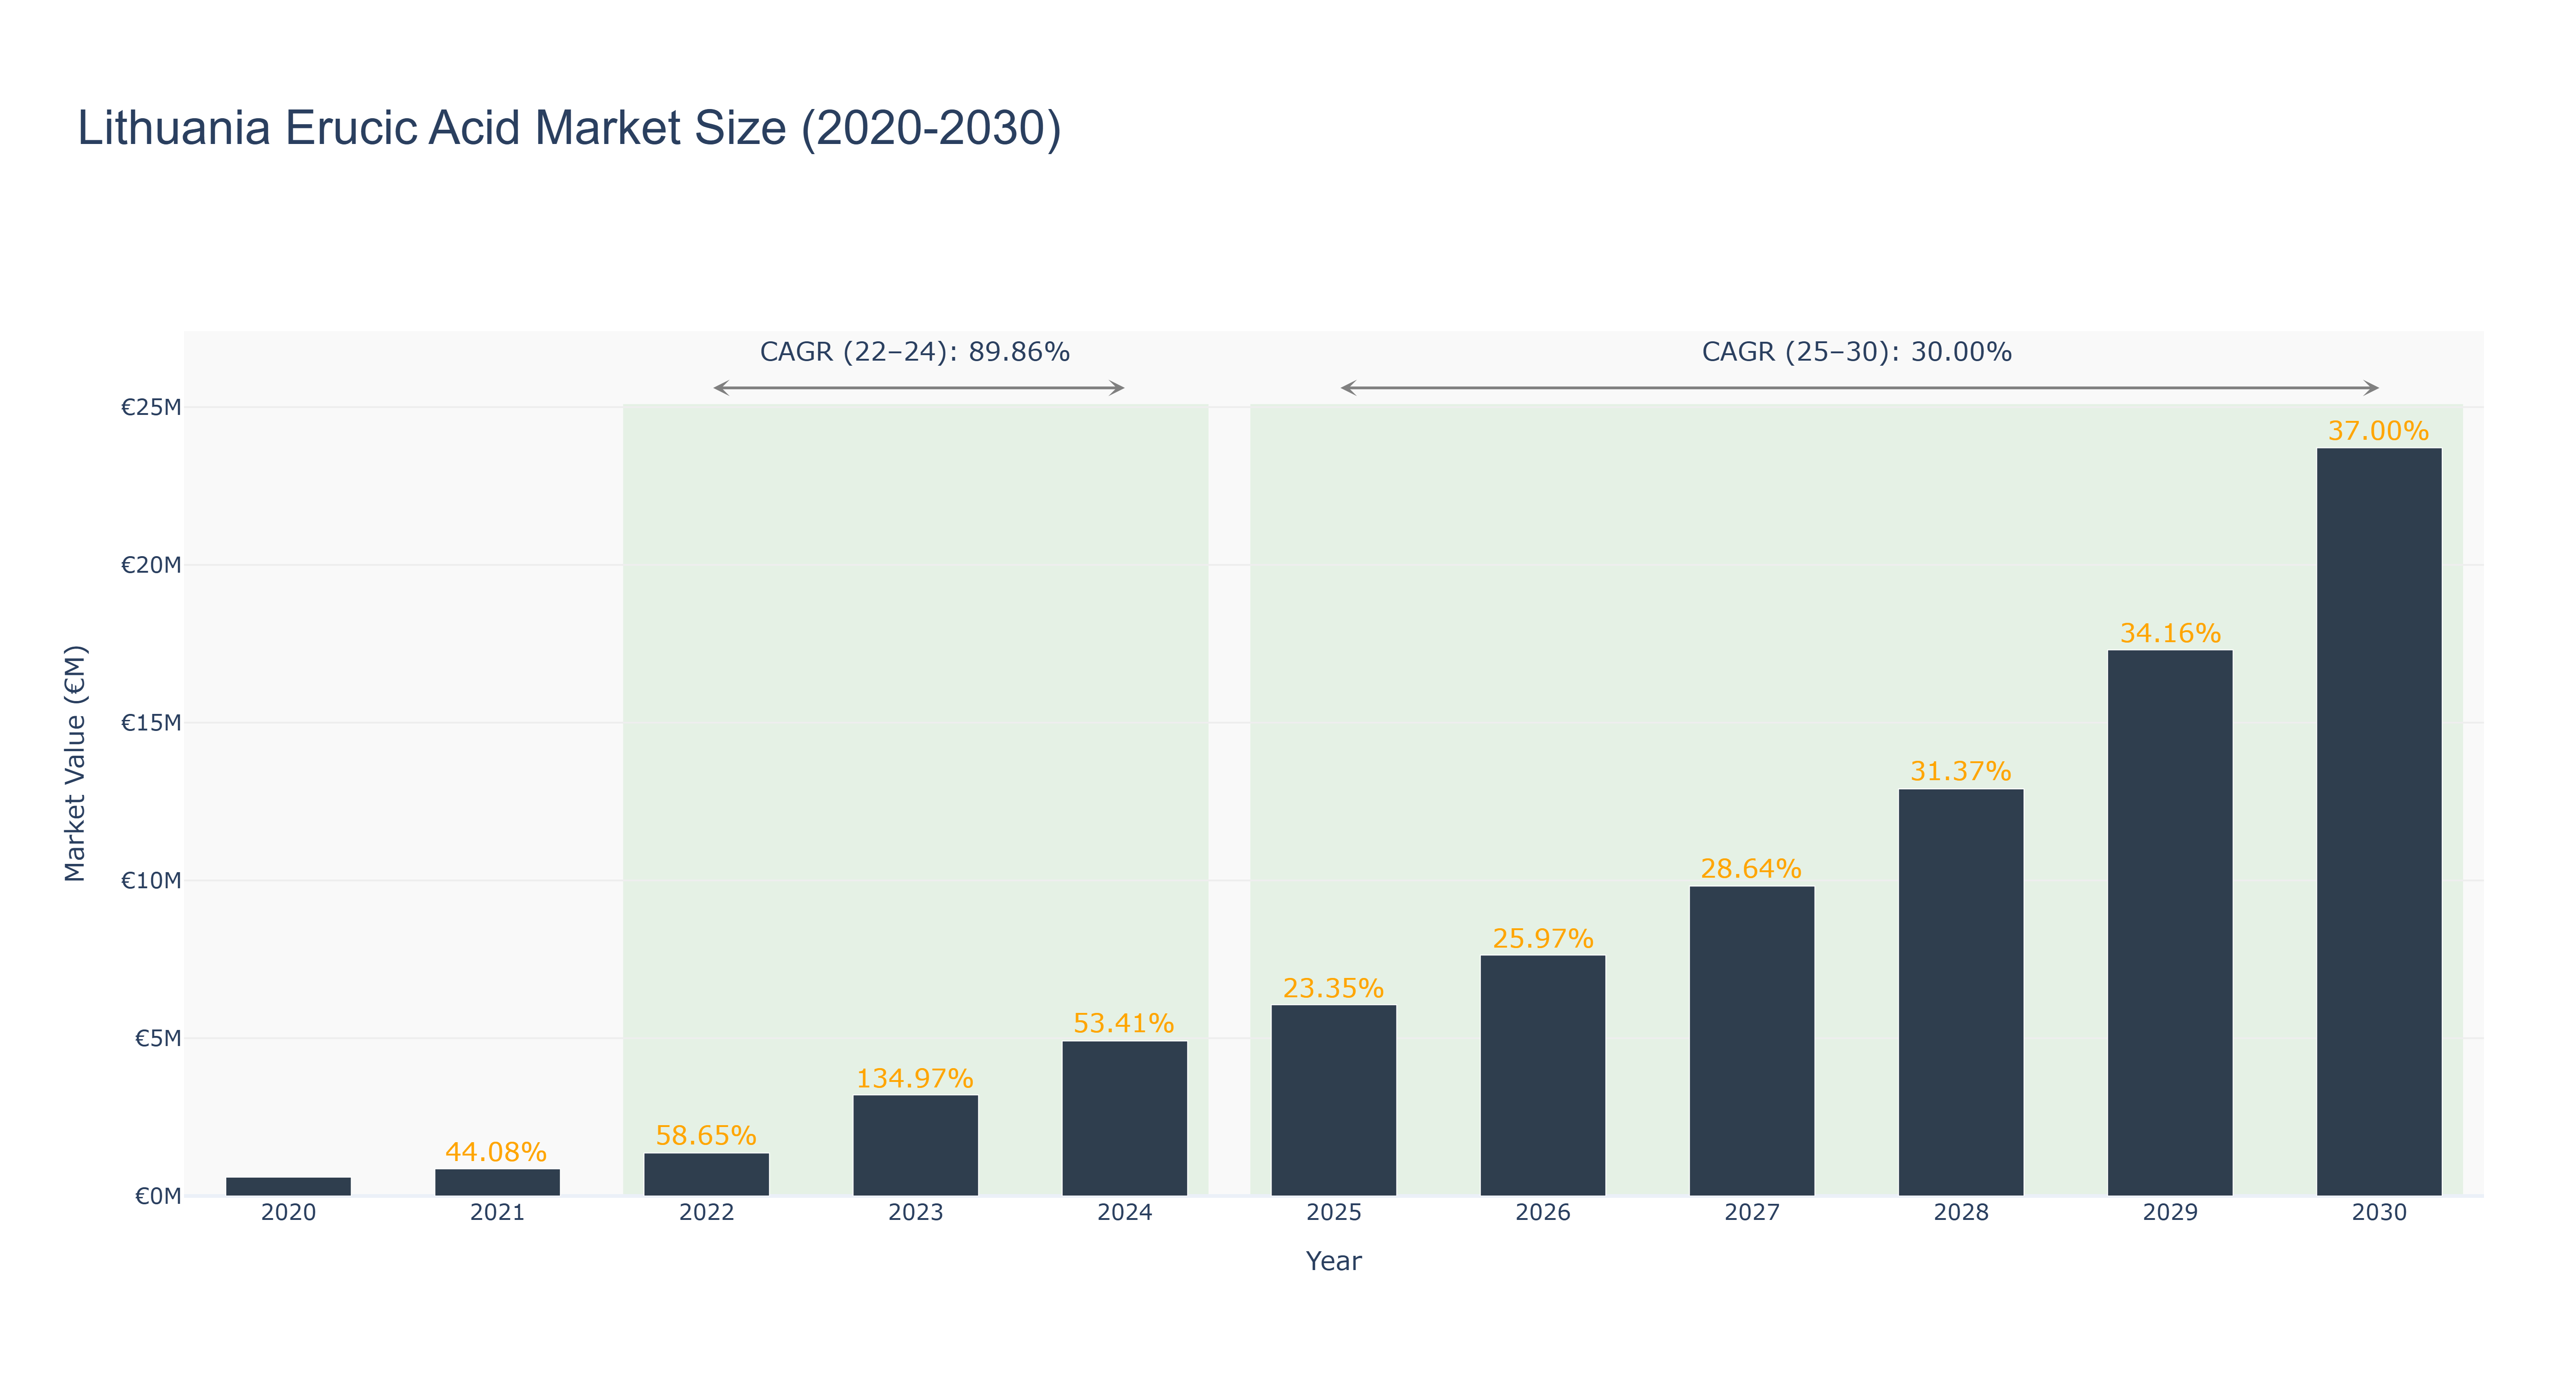
Lithuania's Erucic Acid Market has shown a remarkable growth trajectory over the years. The market reached its peak in 2030 with a size of €23.71 million. From 2020 to 2024, the market size increased steadily, with notable growth rates each year. The forecasted market size from 2025 to 2030 suggests a continued upward trend, with a CAGR of 30.0% between 2025 and 2030. The CAGR for the period 2022-24 was an impressive 89.86%, indicating a period of rapid expansion. This growth can be attributed to increasing demand for erucic acid in various industries, such as cosmetics and food processing. Looking ahead, Lithuania's Erucic Acid Market is poised for further growth, with upcoming projects focusing on enhancing production efficiency and expanding market reach in the European region.
Lithuania Erucic Acid Market: Production & Trade Performance (2019-2025)
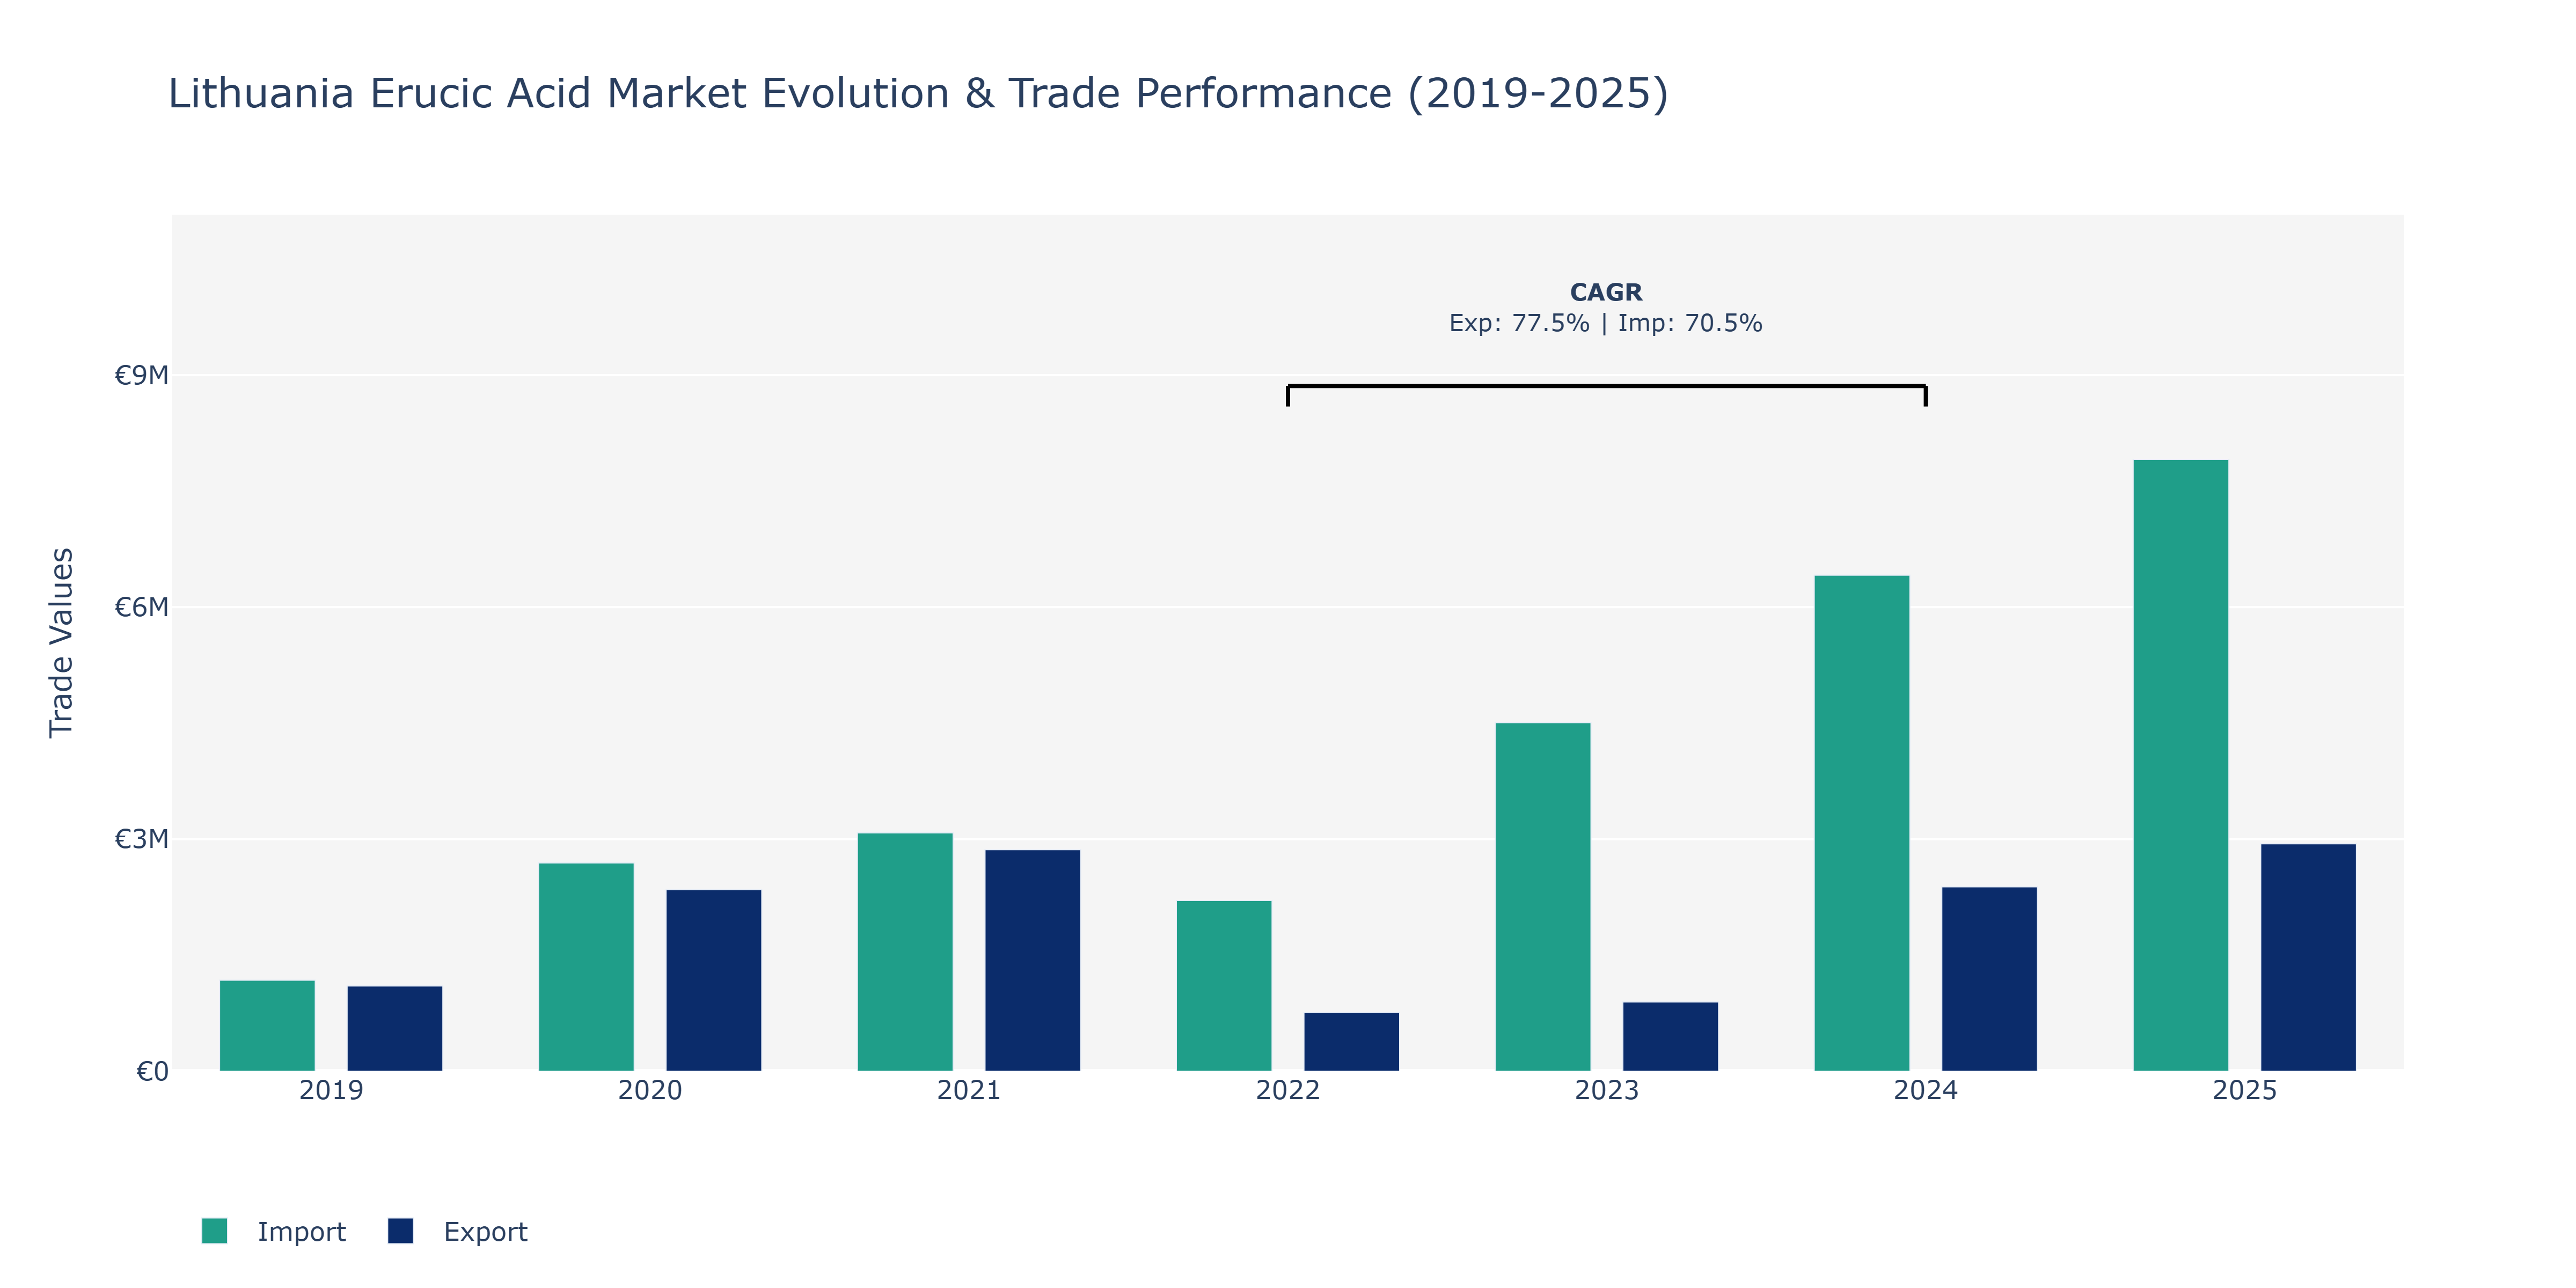
In the Lithuania Erucic Acid Market, exports and imports displayed dynamic fluctuations from 2019 to 2025. Exports started at €1.1 million in 2019, nearly doubled in 2020 to €2.35 million, and peaked at €2.94 million in 2025. This substantial growth can be attributed to increased global demand for erucic acid-based products, especially in industries like cosmetics and lubricants. On the other hand, imports also surged during this period, beginning at €1.18 million in 2019, reaching its pinnacle at €7.91 million in 2025. The sharp rise in imports could be linked to the need for raw materials for domestic erucic acid production or meeting the escalating demand within the country. The notable discrepancy between exports and imports might signify Lithuania's emerging position as a key player in the erucic acid market, both as a supplier and a consumer.
Key Highlights of the Report:
- Lithuania Erucic Acid Market Outlook
- Market Size of Lithuania Erucic Acid Market, 2025
- Forecast of Lithuania Erucic Acid Market, 2032
- Historical Data and Forecast of Lithuania Erucic Acid Revenues & Volume for the Period 2022 - 2032F
- Lithuania Erucic Acid Market Trend Evolution
- Lithuania Erucic Acid Market Drivers and Challenges
- Lithuania Erucic Acid Price Trends
- Lithuania Erucic Acid Porter`s Five Forces
- Lithuania Erucic Acid Industry Life Cycle
- Historical Data and Forecast of Lithuania Erucic Acid Market Revenues & Volume By Grade for the Period 2022 - 2032F
- Historical Data and Forecast of Lithuania Erucic Acid Market Revenues & Volume By Erucic acid 43-50% for the Period 2022 - 2032F
- Historical Data and Forecast of Lithuania Erucic Acid Market Revenues & Volume By Erucic acid >50% for the Period 2022 - 2032F
- Historical Data and Forecast of Lithuania Erucic Acid Market Revenues & Volume By Application for the Period 2022 - 2032F
- Historical Data and Forecast of Lithuania Erucic Acid Market Revenues & Volume By Slip Agent for the Period 2022 - 2032F
- Historical Data and Forecast of Lithuania Erucic Acid Market Revenues & Volume By Emollient for the Period 2022 - 2032F
- Historical Data and Forecast of Lithuania Erucic Acid Market Revenues & Volume By Hair care and textile softening for the Period 2022 - 2032F
- Historical Data and Forecast of Lithuania Erucic Acid Market Revenues & Volume By Pour point depressant for the Period 2022 - 2032F
- Historical Data and Forecast of Lithuania Erucic Acid Market Revenues & Volume By Lubricants for the Period 2022 - 2032F
- Historical Data and Forecast of Lithuania Erucic Acid Market Revenues & Volume By Food emulsifier for the Period 2022 - 2032F
- Historical Data and Forecast of Lithuania Erucic Acid Market Revenues & Volume By Others for the Period 2022 - 2032F
- Historical Data and Forecast of Lithuania Erucic Acid Market Revenues & Volume By Source for the Period 2022 - 2032F
- Historical Data and Forecast of Lithuania Erucic Acid Market Revenues & Volume By Rapeseed oil for the Period 2022 - 2032F
- Historical Data and Forecast of Lithuania Erucic Acid Market Revenues & Volume By Canola for the Period 2022 - 2032F
- Historical Data and Forecast of Lithuania Erucic Acid Market Revenues & Volume By Tame Mustard for the Period 2022 - 2032F
- Historical Data and Forecast of Lithuania Erucic Acid Market Revenues & Volume By Fish for the Period 2022 - 2032F
- Historical Data and Forecast of Lithuania Erucic Acid Market Revenues & Volume By Others for the Period 2022 - 2032F
- Historical Data and Forecast of Lithuania Erucic Acid Market Revenues & Volume By End Users for the Period 2022 - 2032F
- Historical Data and Forecast of Lithuania Erucic Acid Market Revenues & Volume By Plastic for the Period 2022 - 2032F
- Historical Data and Forecast of Lithuania Erucic Acid Market Revenues & Volume By Printing Ink for the Period 2022 - 2032F
- Historical Data and Forecast of Lithuania Erucic Acid Market Revenues & Volume By Food for the Period 2022 - 2032F
- Historical Data and Forecast of Lithuania Erucic Acid Market Revenues & Volume By Personal Care for the Period 2022 - 2032F
- Historical Data and Forecast of Lithuania Erucic Acid Market Revenues & Volume By Rubber for the Period 2022 - 2032F
- Historical Data and Forecast of Lithuania Erucic Acid Market Revenues & Volume By Pharmaceutical for the Period 2022 - 2032F
- Historical Data and Forecast of Lithuania Erucic Acid Market Revenues & Volume By Others for the Period 2022 - 2032F
- Lithuania Erucic Acid Import Export Trade Statistics
- Market Opportunity Assessment By Grade
- Market Opportunity Assessment By Application
- Market Opportunity Assessment By Source
- Market Opportunity Assessment By End Users
- Lithuania Erucic Acid Top Companies Market Share
- Lithuania Erucic Acid Competitive Benchmarking By Technical and Operational Parameters
- Lithuania Erucic Acid Company Profiles
- Lithuania Erucic Acid Key Strategic Recommendations
Frequently Asked Questions About the Market Study (FAQs):
6Wresearch actively monitors the Lithuania Erucic Acid Market and publishes its comprehensive annual report, highlighting emerging trends, growth drivers, revenue analysis, and forecast outlook. Our insights help businesses to make data-backed strategic decisions with ongoing market dynamics. Our analysts track relevent industries related to the Lithuania Erucic Acid Market, allowing our clients with actionable intelligence and reliable forecasts tailored to emerging regional needs.
Yes, we provide customisation as per your requirements. To learn more, feel free to contact us on sales@6wresearch.com
1 Executive Summary |
2 Introduction |
2.1 Key Highlights of the Report |
2.2 Report Description |
2.3 Market Scope & Segmentation |
2.4 Research Methodology |
2.5 Assumptions |
3 Lithuania Erucic Acid Market Overview |
3.1 Lithuania Country Macro Economic Indicators |
3.2 Lithuania Erucic Acid Market Revenues & Volume, 2022 & 2032F |
3.3 Lithuania Erucic Acid Market - Industry Life Cycle |
3.4 Lithuania Erucic Acid Market - Porter's Five Forces |
3.5 Lithuania Erucic Acid Market Revenues & Volume Share, By Grade, 2022 & 2032F |
3.6 Lithuania Erucic Acid Market Revenues & Volume Share, By Application, 2022 & 2032F |
3.7 Lithuania Erucic Acid Market Revenues & Volume Share, By Source, 2022 & 2032F |
3.8 Lithuania Erucic Acid Market Revenues & Volume Share, By End Users, 2022 & 2032F |
4 Lithuania Erucic Acid Market Dynamics |
4.1 Impact Analysis |
4.2 Market Drivers |
4.2.1 Increasing demand for bio-based products in various industries |
4.2.2 Growing awareness about the benefits of erucic acid in pharmaceuticals and cosmetics |
4.2.3 Government initiatives promoting the use of sustainable and renewable resources |
4.3 Market Restraints |
4.3.1 Fluctuating prices of raw materials impacting production costs |
4.3.2 Stringent regulations and standards for erucic acid content in food and industrial applications |
5 Lithuania Erucic Acid Market Trends |
6 Lithuania Erucic Acid Market Segmentations |
6.1 Lithuania Erucic Acid Market, By Grade |
6.1.1 Overview and Analysis |
6.1.2 Lithuania Erucic Acid Market Revenues & Volume, By Erucic acid 43-50%, 2022 - 2032F |
6.1.3 Lithuania Erucic Acid Market Revenues & Volume, By Erucic acid >50%, 2022 - 2032F |
6.2 Lithuania Erucic Acid Market, By Application |
6.2.1 Overview and Analysis |
6.2.2 Lithuania Erucic Acid Market Revenues & Volume, By Slip Agent, 2022 - 2032F |
6.2.3 Lithuania Erucic Acid Market Revenues & Volume, By Emollient, 2022 - 2032F |
6.2.4 Lithuania Erucic Acid Market Revenues & Volume, By Hair care and textile softening, 2022 - 2032F |
6.2.5 Lithuania Erucic Acid Market Revenues & Volume, By Pour point depressant, 2022 - 2032F |
6.2.6 Lithuania Erucic Acid Market Revenues & Volume, By Lubricants, 2022 - 2032F |
6.2.7 Lithuania Erucic Acid Market Revenues & Volume, By Food emulsifier, 2022 - 2032F |
6.3 Lithuania Erucic Acid Market, By Source |
6.3.1 Overview and Analysis |
6.3.2 Lithuania Erucic Acid Market Revenues & Volume, By Rapeseed oil, 2022 - 2032F |
6.3.3 Lithuania Erucic Acid Market Revenues & Volume, By Canola, 2022 - 2032F |
6.3.4 Lithuania Erucic Acid Market Revenues & Volume, By Tame Mustard, 2022 - 2032F |
6.3.5 Lithuania Erucic Acid Market Revenues & Volume, By Fish, 2022 - 2032F |
6.3.6 Lithuania Erucic Acid Market Revenues & Volume, By Others, 2022 - 2032F |
6.4 Lithuania Erucic Acid Market, By End Users |
6.4.1 Overview and Analysis |
6.4.2 Lithuania Erucic Acid Market Revenues & Volume, By Plastic, 2022 - 2032F |
6.4.3 Lithuania Erucic Acid Market Revenues & Volume, By Printing Ink, 2022 - 2032F |
6.4.4 Lithuania Erucic Acid Market Revenues & Volume, By Food, 2022 - 2032F |
6.4.5 Lithuania Erucic Acid Market Revenues & Volume, By Personal Care, 2022 - 2032F |
6.4.6 Lithuania Erucic Acid Market Revenues & Volume, By Rubber, 2022 - 2032F |
6.4.7 Lithuania Erucic Acid Market Revenues & Volume, By Pharmaceutical, 2022 - 2032F |
7 Lithuania Erucic Acid Market Import-Export Trade Statistics |
7.1 Lithuania Erucic Acid Market Export to Major Countries |
7.2 Lithuania Erucic Acid Market Imports from Major Countries |
8 Lithuania Erucic Acid Market Key Performance Indicators |
8.1 Percentage of erucic acid used in bio-based products |
8.2 Number of research studies on the applications of erucic acid |
8.3 Percentage of companies using erucic acid in their product formulations |
9 Lithuania Erucic Acid Market - Opportunity Assessment |
9.1 Lithuania Erucic Acid Market Opportunity Assessment, By Grade, 2022 & 2032F |
9.2 Lithuania Erucic Acid Market Opportunity Assessment, By Application, 2022 & 2032F |
9.3 Lithuania Erucic Acid Market Opportunity Assessment, By Source, 2022 & 2032F |
9.4 Lithuania Erucic Acid Market Opportunity Assessment, By End Users, 2022 & 2032F |
10 Lithuania Erucic Acid Market - Competitive Landscape |
10.1 Lithuania Erucic Acid Market Revenue Share, By Companies, 2025 |
10.2 Lithuania Erucic Acid Market Competitive Benchmarking, By Operating and Technical Parameters |
11 Company Profiles |
12 Recommendations | 13 Disclaimer |
Export potential assessment - trade Analytics for 2030
Export potential enables firms to identify high-growth global markets with greater confidence by combining advanced trade intelligence with a structured quantitative methodology. The framework analyzes emerging demand trends and country-level import patterns while integrating macroeconomic and trade datasets such as GDP and population forecasts, bilateral import–export flows, tariff structures, elasticity differentials between developed and developing economies, geographic distance, and import demand projections. Using weighted trade values from 2020–2024 as the base period to project country-to-country export potential for 2030, these inputs are operationalized through calculated drivers such as gravity model parameters, tariff impact factors, and projected GDP per-capita growth. Through an analysis of hidden potentials, demand hotspots, and market conditions that are most favorable to success, this method enables firms to focus on target countries, maximize returns, and global expansion with data, backed by accuracy.
By factoring in the projected importer demand gap that is currently unmet and could be potential opportunity, it identifies the potential for the Exporter (Country) among 190 countries, against the general trade analysis, which identifies the biggest importer or exporter.
To discover high-growth global markets and optimize your business strategy:
Click Here
Pricing
- Single User License$ 1,995
- Department License$ 2,400
- Site License$ 3,120
- Global License$ 3,795

Search
Thought Leadership and Analyst Meet


Our Clients
Latest Reports
- Canada Cloud CFD Market (2026-2032) | Size & Revenue, Industry, Growth, Competitive Landscape, Forecast, Segmentation, Value, Outlook, Trends, Share, Analysis, Companies
- Taiwan Food Delivery Platform Market (2026-2032) | Companies, Outlook, Analysis, Trends, Value, Revenue, Segmentation, Share, Forecast, Competitive Landscape, Growth, Size & Forecast
- United Kingdom (UK) Long-term Care Insurance Market (2026-2032) | Growth, Share, Consumer Insights, Drivers, Opportunities, Competition, Pricing Analysis, Segments, Restraints, Companies, Competitive, Value, Outlook, Size, Demand, Analysis, Challenges, Strategic Insights, Investment Trends, Revenue, Trends, Supply, Forecast
- United Kingdom (UK) Long Term Care Market (2026-2032) | Companies, Outlook, Analysis, Trends, Value, Revenue, Segmentation, Share, Forecast, Competitive Landscape, Growth, Size & Forecast
- Iraq Insulation and Waterproofing Market (2026-2032) | Outlook, Drivers, Growth, Size, Share, Industry, Revenue, Trends, Demand, Competitive, Strategic Insights, Opportunities, Segments, Companies, Challenges, Strategy, Consumer Insights, Analysis, Investment Trends, Value, Segmentation, Forecast, Restraints
- India Switchgear Market Outlook (2026-2032) | Size, Share, Trends, Growth, Revenue, Forecast, Analysis, Value, Outlook
- Pakistan Contraceptive Implants Market (2025-2031) | Demand, Growth, Size, Share, Industry, Pricing Analysis, Competitive, Strategic Insights, Strategy, Consumer Insights, Analysis, Investment Trends, Opportunities, Revenue, Segments, Value, Segmentation, Supply, Forecast, Restraints, Outlook, Competition, Drivers, Trends, Companies, Challenges
- Sri Lanka Packaging Market (2026-2032) | Outlook, Competition, Drivers, Trends, Demand, Pricing Analysis, Competitive, Strategic Insights, Companies, Challenges, Strategy, Consumer Insights, Analysis, Investment Trends, Opportunities, Growth, Size, Share, Industry, Revenue, Segments, Value, Segmentation, Supply, Forecast, Restraints
- India Kids Watches Market (2026-2032) | Strategy, Consumer Insights, Analysis, Investment Trends, Opportunities, Growth, Size, Share, Industry, Revenue, Segments, Value, Segmentation, Supply, Forecast, Restraints, Outlook, Competition, Drivers, Trends, Demand, Pricing Analysis, Competitive, Strategic Insights, Companies, Challenges
- Saudi Arabia Core Assurance Service Market (2025-2031) | Strategy, Consumer Insights, Analysis, Investment Trends, Opportunities, Growth, Size, Share, Industry, Revenue, Segments, Value, Segmentation, Supply, Forecast, Restraints, Outlook, Competition, Drivers, Trends, Demand, Pricing Analysis, Competitive, Strategic Insights, Companies, Challenges
Industry Events and Analyst Meet

India EV Show 2026

EV tech India Expo 2026

Auto Tech Asia 2026

Battery Tech India 2026

Smart Production Solutions Guangzhou 2026
Whitepaper
- Middle East & Africa Commercial Security Market Click here to view more.
- Middle East & Africa Fire Safety Systems & Equipment Market Click here to view more.
- GCC Drone Market Click here to view more.
- Middle East Lighting Fixture Market Click here to view more.
- GCC Physical & Perimeter Security Market Click here to view more.
6WResearch In News
- Doha a strategic location for EV manufacturing hub: IPA Qatar
- Demand for luxury TVs surging in the GCC, says Samsung
- Empowering Growth: The Thriving Journey of Bangladesh’s Cable Industry
- Demand for luxury TVs surging in the GCC, says Samsung
- Video call with a traditional healer? Once unthinkable, it’s now common in South Africa
- Intelligent Buildings To Smooth GCC’s Path To Net Zero