Lithuania Food Cans Market (2026-2032) | Segmentation, Competitive Landscape, Analysis, Value, Outlook, Share, Companies, Industry, Trends, Growth, Forecast, Size & Revenue
Market Forecast By Product (2 Piece Cans, 3 Piece Cans), By Material (Metal, Paperboard, Plastic), By Capacity (Less than 100 gm, 100 gm300 gm, 301 gm500 gm, More than 500 gm), By End-use (Meat and Poultry & Seafood, Pet Food, Bakery & Confectionery, Sauces and Jams & Pickles, Fruits & Vegetables, Tea & Coffee, Others (Baby Food, Ready Meals, Nutrition Food, Dairy, etc.)) And Competitive Landscape
| Product Code: ETC8041255 | Publication Date: Sep 2024 | Updated Date: Apr 2026 | Product Type: Market Research Report | |
| Publisher: 6Wresearch | Author: Summon Dutta | No. of Pages: 75 | No. of Figures: 35 | No. of Tables: 20 |
Lithuania Food Cans Market Size (2020-2030)
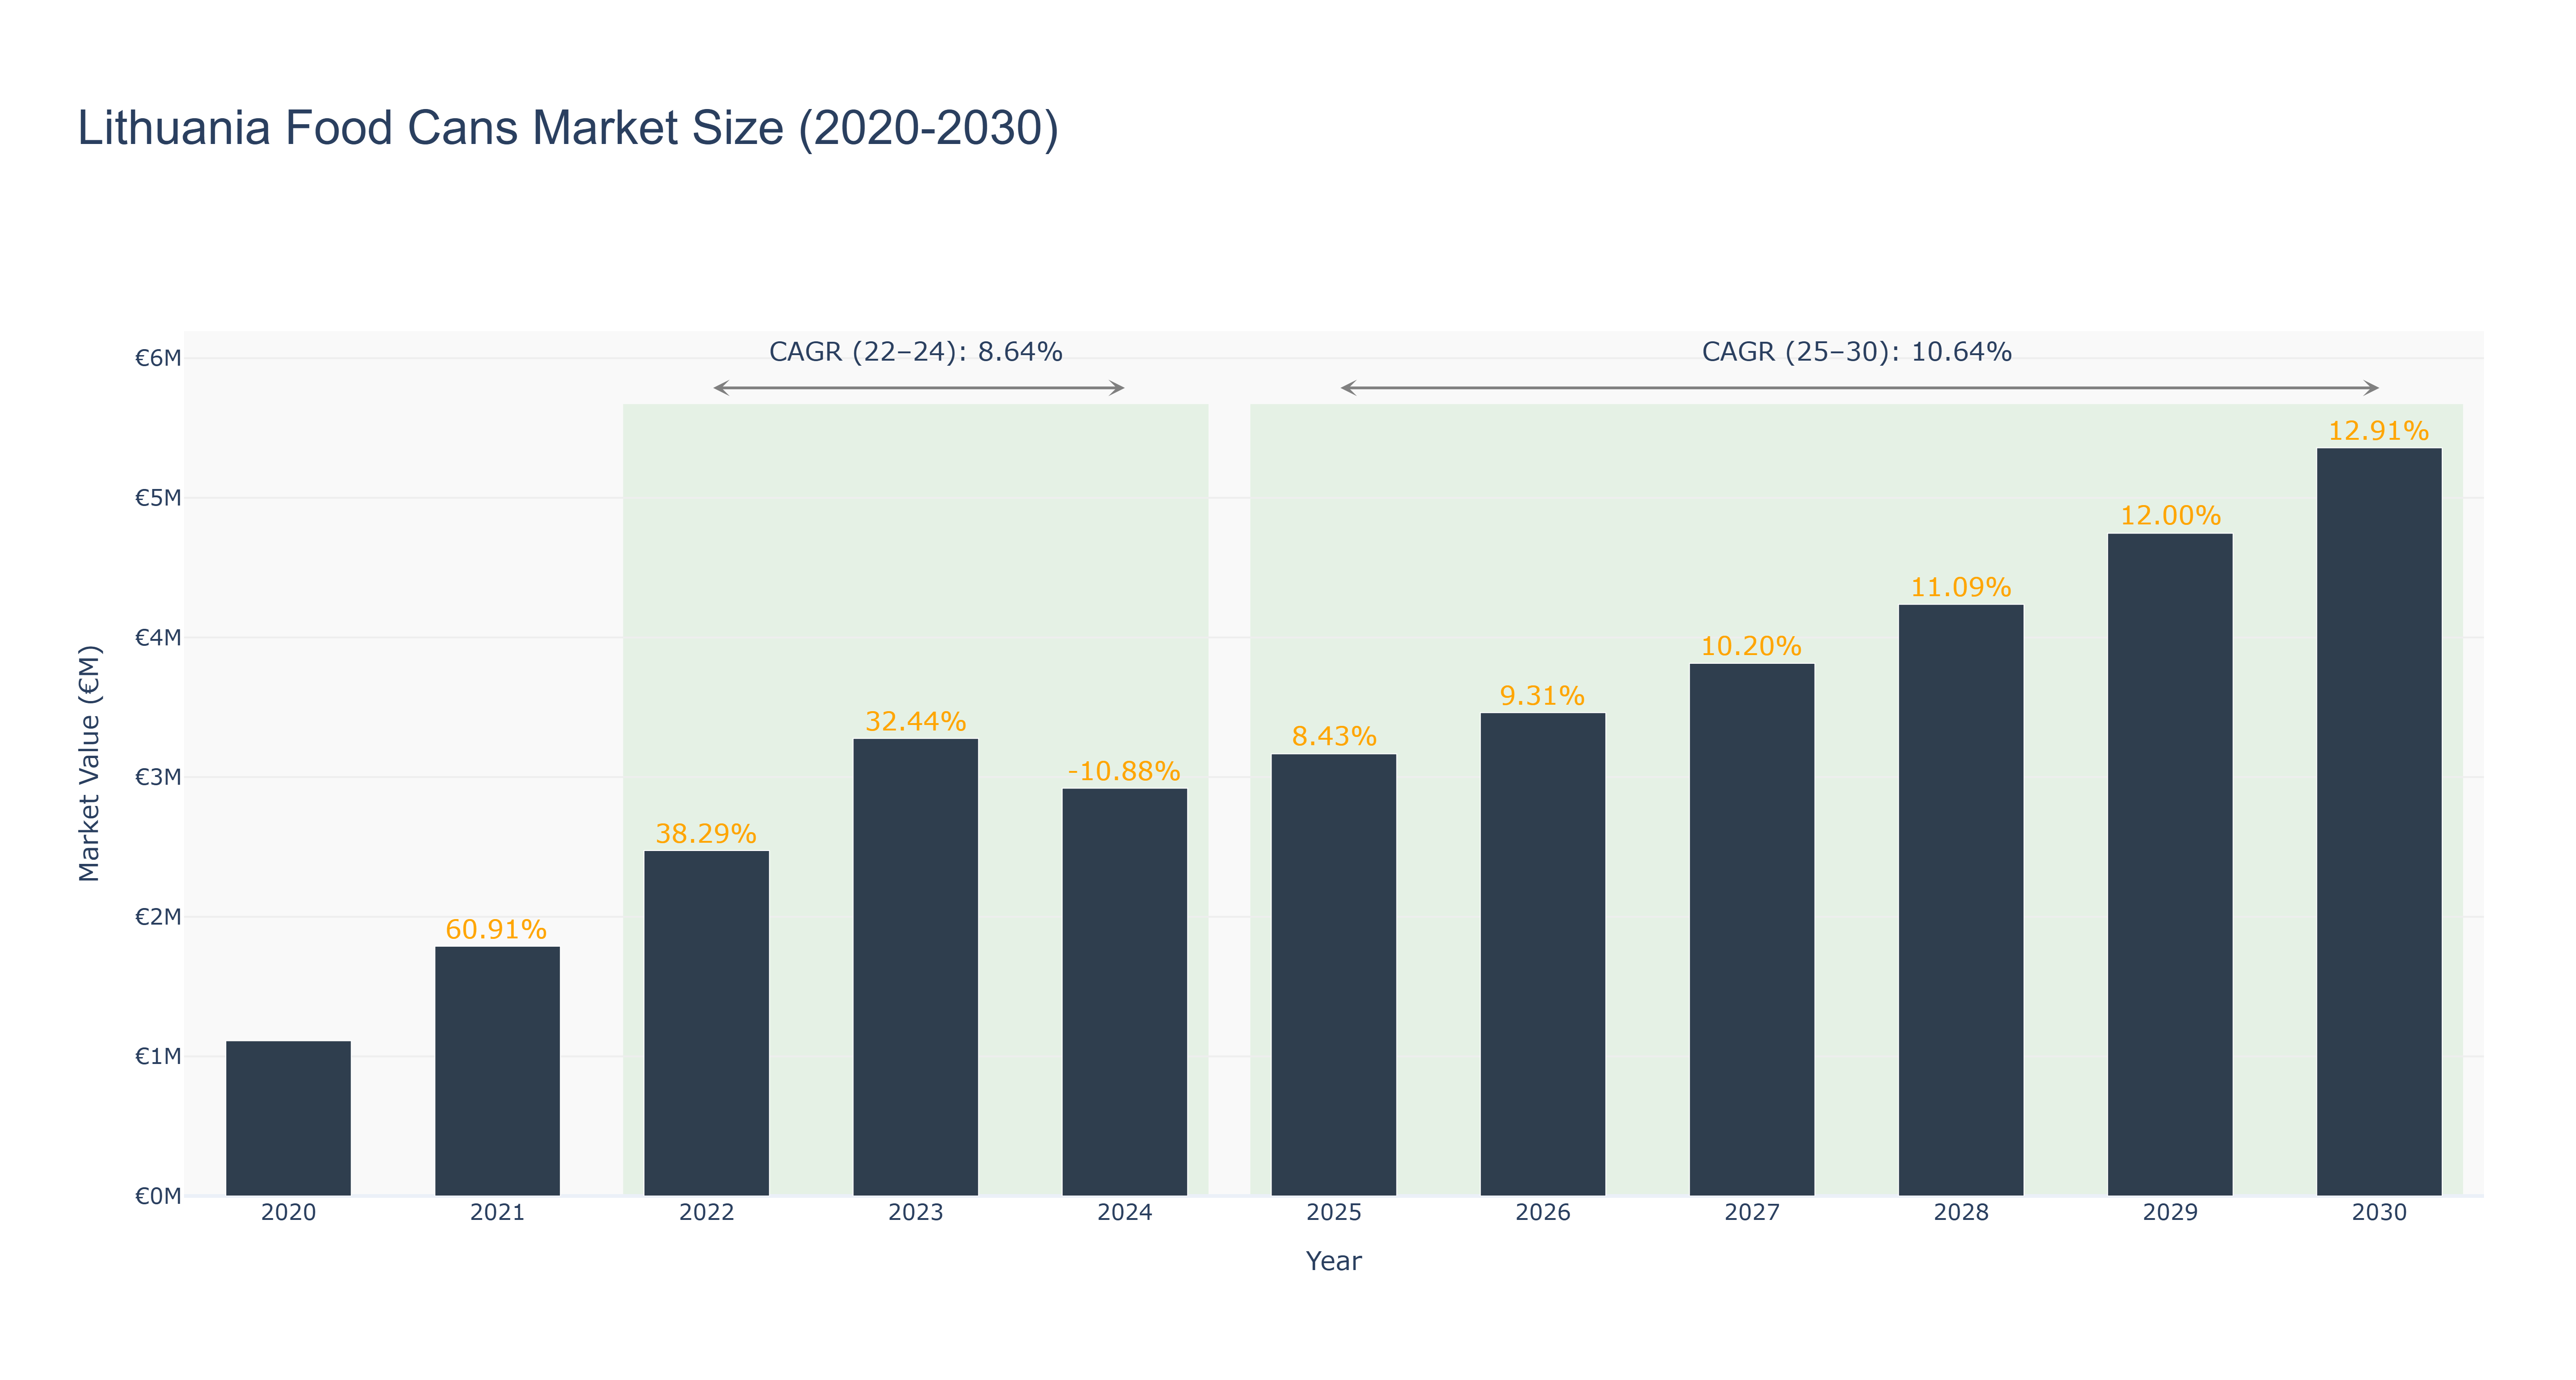
The Lithuania Food Cans Market experienced significant growth from 2020 to 2024, peaking in 2023 with a market size of €3.28 million, reflecting a robust growth trend despite a decline in 2024 to €2.92 million. The actual CAGR from 2022 to 2024 stands at 8.64%, driven by increasing consumer demand for convenient and long-shelf-life food products, alongside rising health awareness. Looking ahead, the forecasted period from 2025 to 2030 projects a market size growth from €3.17 million to €5.36 million, with a higher CAGR of 10.64%. This anticipated growth is supported by ongoing innovations in packaging technology and the expanding presence of e-commerce, which enhances accessibility for consumers. As the market evolves, the integration of sustainable practices and the introduction of new product lines will likely play crucial roles in shaping the competitive landscape and driving future demand in Lithuania's food cans market.
Lithuania Food Cans Market: Production & Trade Performance (2019-2025)
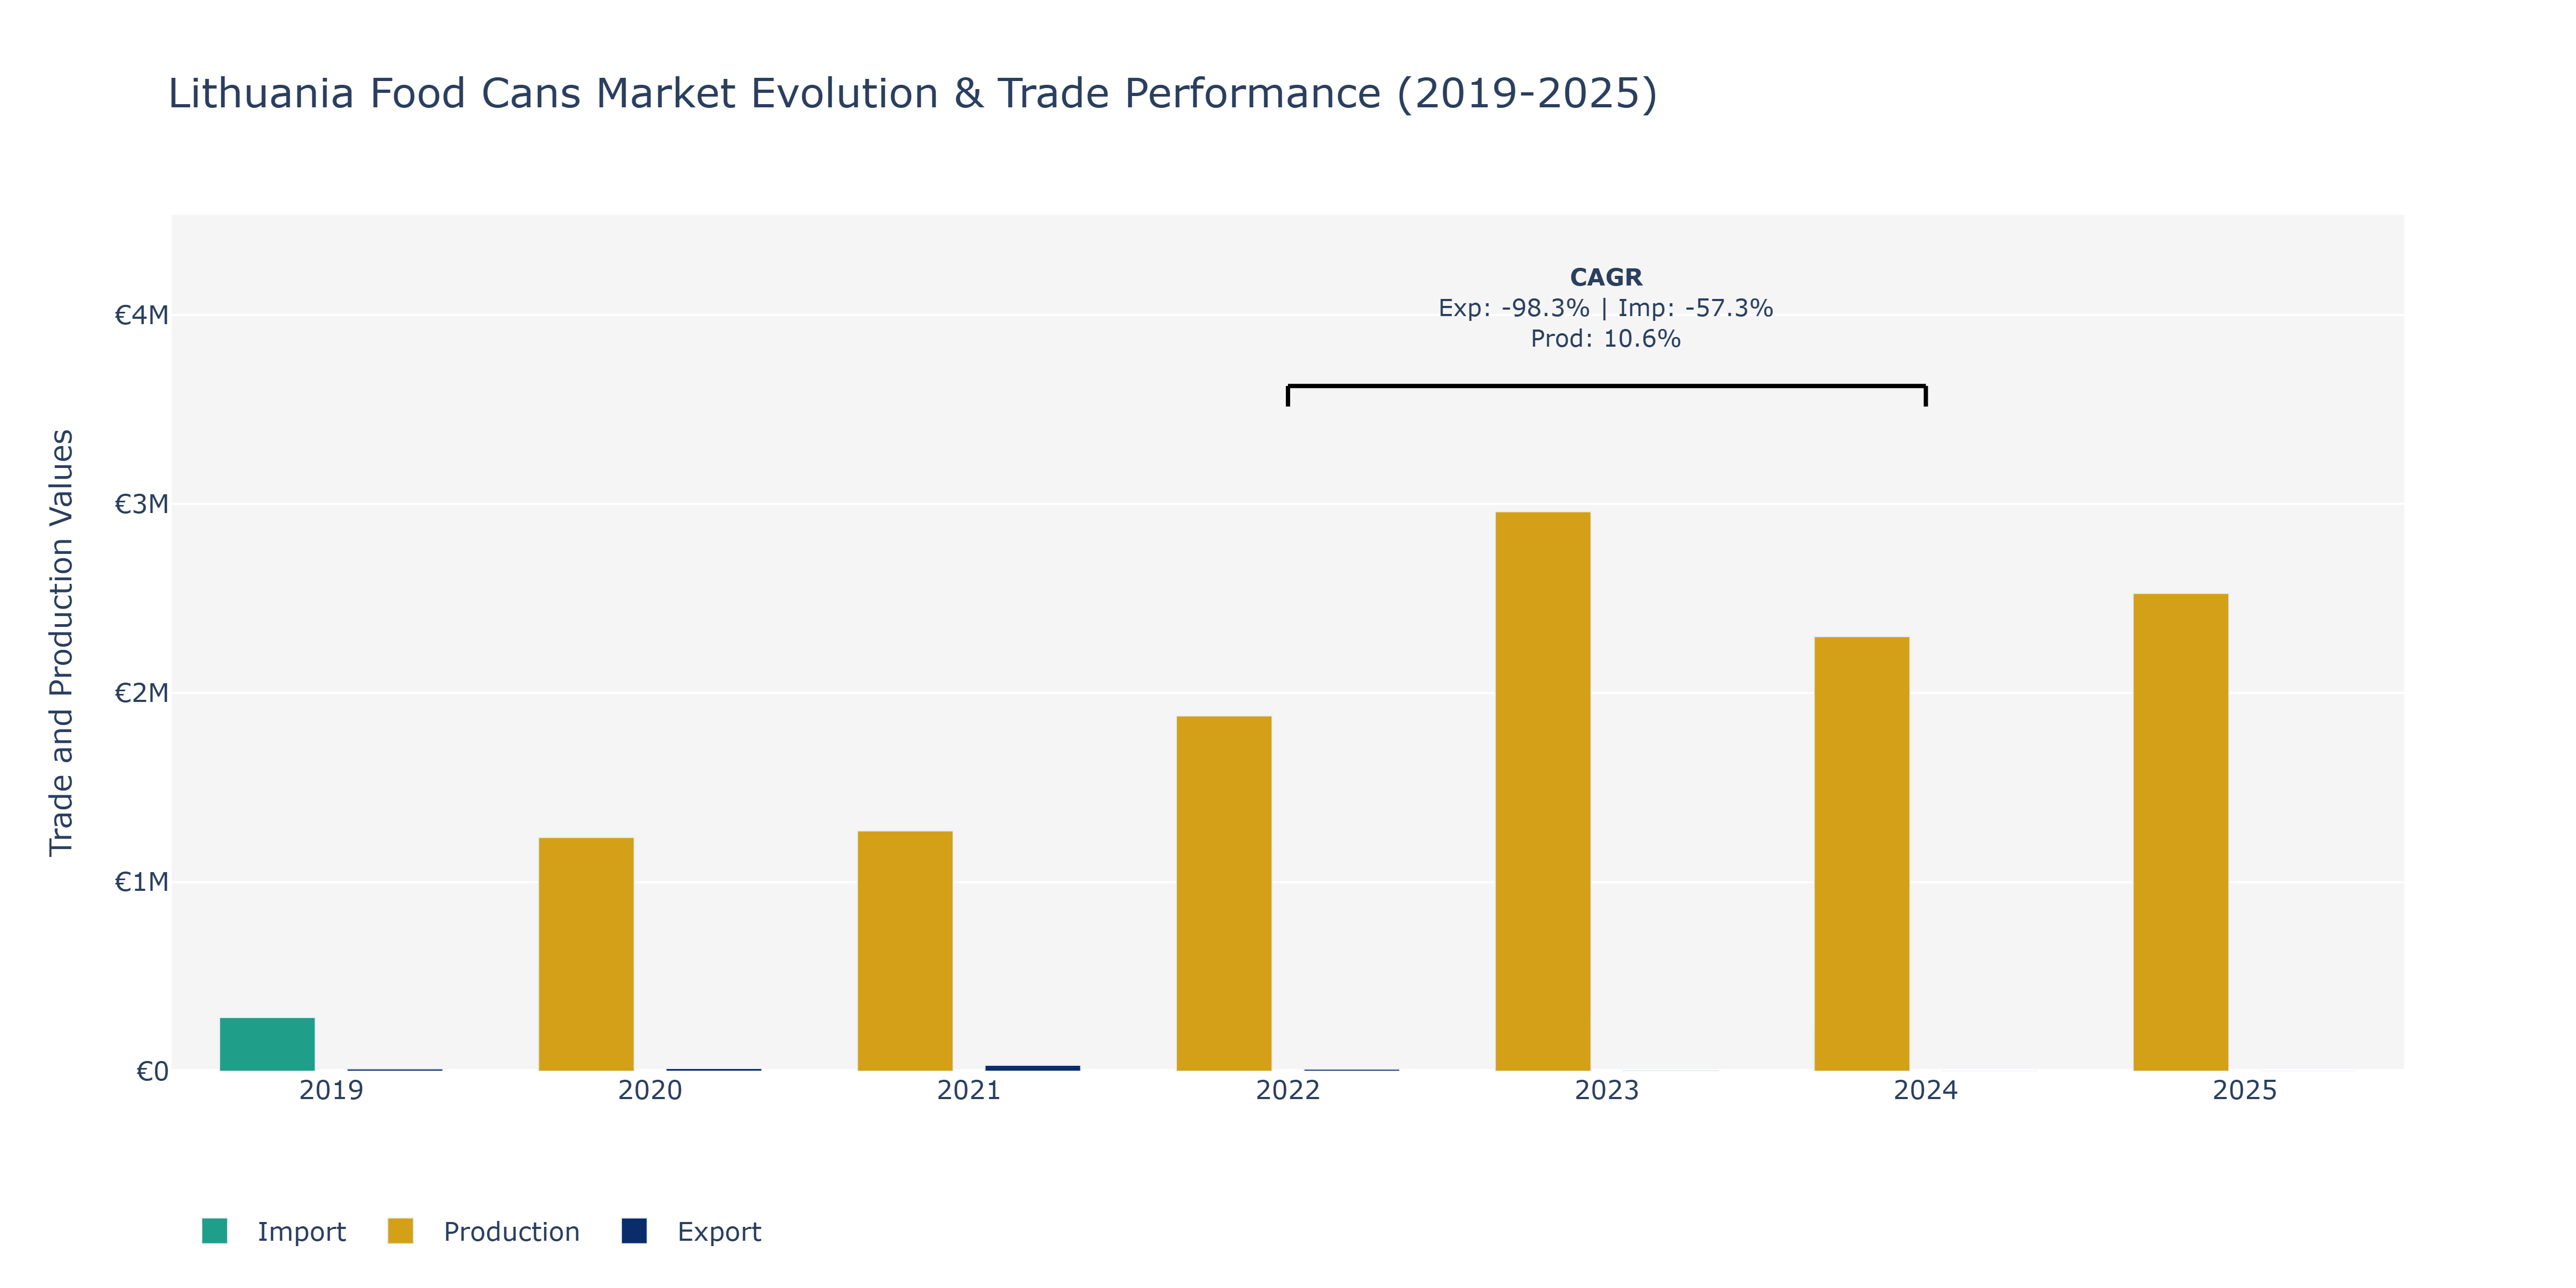
In the Lithuania Food Cans Market, exports exhibited a fluctuating pattern over the years, starting at €12.42 thousand in 2019, increasing to €31.24 thousand in 2021, then sharply declining to €3.00 thousand in 2024, and further decreasing to €2.26 thousand in 2025. This decline could be attributed to changing consumer preferences towards more sustainable packaging options, impacting the demand for traditional metal food cans. In contrast, imports showed a consistent upward trend, rising from €283.82 thousand in 2019 to €1.59 million in 2025, potentially indicating increased demand for a variety of canned food products in the market. Production levels also rose steadily from €1.24 thousand in 2020 to €2.53 million in 2025, reflecting the industry's efforts to meet growing consumer needs efficiently. The positive production CAGR of 10.59% during 2022-2024 suggests strategic investments by manufacturers to enhance production capabilities and meet market demands efficiently.
Key Highlights of the Report:
- Lithuania Food Cans Market Outlook
- Market Size of Lithuania Food Cans Market, 2025
- Forecast of Lithuania Food Cans Market, 2032
- Historical Data and Forecast of Lithuania Food Cans Revenues & Volume for the Period 2022 - 2032
- Lithuania Food Cans Market Trend Evolution
- Lithuania Food Cans Market Drivers and Challenges
- Lithuania Food Cans Price Trends
- Lithuania Food Cans Porter's Five Forces
- Lithuania Food Cans Industry Life Cycle
- Historical Data and Forecast of Lithuania Food Cans Market Revenues & Volume By Product for the Period 2022 - 2032
- Historical Data and Forecast of Lithuania Food Cans Market Revenues & Volume By 2 Piece Cans for the Period 2022 - 2032
- Historical Data and Forecast of Lithuania Food Cans Market Revenues & Volume By 3 Piece Cans for the Period 2022 - 2032
- Historical Data and Forecast of Lithuania Food Cans Market Revenues & Volume By Material for the Period 2022 - 2032
- Historical Data and Forecast of Lithuania Food Cans Market Revenues & Volume By Metal for the Period 2022 - 2032
- Historical Data and Forecast of Lithuania Food Cans Market Revenues & Volume By Paperboard for the Period 2022 - 2032
- Historical Data and Forecast of Lithuania Food Cans Market Revenues & Volume By Plastic for the Period 2022 - 2032
- Historical Data and Forecast of Lithuania Food Cans Market Revenues & Volume By Capacity for the Period 2022 - 2032
- Historical Data and Forecast of Lithuania Food Cans Market Revenues & Volume By Less than 100 gm for the Period 2022 - 2032
- Historical Data and Forecast of Lithuania Food Cans Market Revenues & Volume By 100 gm300 gm for the Period 2022 - 2032
- Historical Data and Forecast of Lithuania Food Cans Market Revenues & Volume By 301 gm500 gm for the Period 2022 - 2032
- Historical Data and Forecast of Lithuania Food Cans Market Revenues & Volume By More than 500 gm for the Period 2022 - 2032
- Historical Data and Forecast of Lithuania Food Cans Market Revenues & Volume By End-use for the Period 2022 - 2032
- Historical Data and Forecast of Lithuania Food Cans Market Revenues & Volume By Meat and Poultry & Seafood for the Period 2022 - 2032
- Historical Data and Forecast of Lithuania Food Cans Market Revenues & Volume By Pet Food for the Period 2022 - 2032
- Historical Data and Forecast of Lithuania Food Cans Market Revenues & Volume By Bakery & Confectionery for the Period 2022 - 2032
- Historical Data and Forecast of Lithuania Food Cans Market Revenues & Volume By Sauces and Jams & Pickles for the Period 2022 - 2032
- Historical Data and Forecast of Lithuania Food Cans Market Revenues & Volume By Fruits & Vegetables for the Period 2022 - 2032
- Historical Data and Forecast of Lithuania Food Cans Market Revenues & Volume By Tea & Coffee for the Period 2022 - 2032
- Historical Data and Forecast of Lithuania Food Cans Market Revenues & Volume By Others (Baby Food, Ready Meals, Nutrition Food, Dairy, etc.) for the Period 2022 - 2032
- Lithuania Food Cans Import Export Trade Statistics
- Market Opportunity Assessment By Product
- Market Opportunity Assessment By Material
- Market Opportunity Assessment By Capacity
- Market Opportunity Assessment By End-use
- Lithuania Food Cans Top Companies Market Share
- Lithuania Food Cans Competitive Benchmarking By Technical and Operational Parameters
- Lithuania Food Cans Company Profiles
- Lithuania Food Cans Key Strategic Recommendations
Frequently Asked Questions About the Market Study (FAQs):
6Wresearch actively monitors the Lithuania Food Cans Market and publishes its comprehensive annual report, highlighting emerging trends, growth drivers, revenue analysis, and forecast outlook. Our insights help businesses to make data-backed strategic decisions with ongoing market dynamics. Our analysts track relevent industries related to the Lithuania Food Cans Market, allowing our clients with actionable intelligence and reliable forecasts tailored to emerging regional needs.
Yes, we provide customisation as per your requirements. To learn more, feel free to contact us on sales@6wresearch.com
1 Executive Summary |
2 Introduction |
2.1 Key Highlights of the Report |
2.2 Report Description |
2.3 Market Scope & Segmentation |
2.4 Research Methodology |
2.5 Assumptions |
3 Lithuania Food Cans Market Overview |
3.1 Lithuania Country Macro Economic Indicators |
3.2 Lithuania Food Cans Market Revenues & Volume, 2022 & 2032F |
3.3 Lithuania Food Cans Market - Industry Life Cycle |
3.4 Lithuania Food Cans Market - Porter's Five Forces |
3.5 Lithuania Food Cans Market Revenues & Volume Share, By Product, 2022 & 2032F |
3.6 Lithuania Food Cans Market Revenues & Volume Share, By Material, 2022 & 2032F |
3.7 Lithuania Food Cans Market Revenues & Volume Share, By Capacity, 2022 & 2032F |
3.8 Lithuania Food Cans Market Revenues & Volume Share, By End-use, 2022 & 2032F |
4 Lithuania Food Cans Market Dynamics |
4.1 Impact Analysis |
4.2 Market Drivers |
4.3 Market Restraints |
5 Lithuania Food Cans Market Trends |
6 Lithuania Food Cans Market, By Types |
6.1 Lithuania Food Cans Market, By Product |
6.1.1 Overview and Analysis |
6.1.2 Lithuania Food Cans Market Revenues & Volume, By Product, 2022 - 2032F |
6.1.3 Lithuania Food Cans Market Revenues & Volume, By 2 Piece Cans, 2022 - 2032F |
6.1.4 Lithuania Food Cans Market Revenues & Volume, By 3 Piece Cans, 2022 - 2032F |
6.2 Lithuania Food Cans Market, By Material |
6.2.1 Overview and Analysis |
6.2.2 Lithuania Food Cans Market Revenues & Volume, By Metal, 2022 - 2032F |
6.2.3 Lithuania Food Cans Market Revenues & Volume, By Paperboard, 2022 - 2032F |
6.2.4 Lithuania Food Cans Market Revenues & Volume, By Plastic, 2022 - 2032F |
6.3 Lithuania Food Cans Market, By Capacity |
6.3.1 Overview and Analysis |
6.3.2 Lithuania Food Cans Market Revenues & Volume, By Less than 100 gm, 2022 - 2032F |
6.3.3 Lithuania Food Cans Market Revenues & Volume, By 100 gm300 gm, 2022 - 2032F |
6.3.4 Lithuania Food Cans Market Revenues & Volume, By 301 gm500 gm, 2022 - 2032F |
6.3.5 Lithuania Food Cans Market Revenues & Volume, By More than 500 gm, 2022 - 2032F |
6.4 Lithuania Food Cans Market, By End-use |
6.4.1 Overview and Analysis |
6.4.2 Lithuania Food Cans Market Revenues & Volume, By Meat and Poultry & Seafood, 2022 - 2032F |
6.4.3 Lithuania Food Cans Market Revenues & Volume, By Pet Food, 2022 - 2032F |
6.4.4 Lithuania Food Cans Market Revenues & Volume, By Bakery & Confectionery, 2022 - 2032F |
6.4.5 Lithuania Food Cans Market Revenues & Volume, By Sauces and Jams & Pickles, 2022 - 2032F |
6.4.6 Lithuania Food Cans Market Revenues & Volume, By Fruits & Vegetables, 2022 - 2032F |
6.4.7 Lithuania Food Cans Market Revenues & Volume, By Tea & Coffee, 2022 - 2032F |
7 Lithuania Food Cans Market Import-Export Trade Statistics |
7.1 Lithuania Food Cans Market Export to Major Countries |
7.2 Lithuania Food Cans Market Imports from Major Countries |
8 Lithuania Food Cans Market Key Performance Indicators |
9 Lithuania Food Cans Market - Opportunity Assessment |
9.1 Lithuania Food Cans Market Opportunity Assessment, By Product, 2022 & 2032F |
9.2 Lithuania Food Cans Market Opportunity Assessment, By Material, 2022 & 2032F |
9.3 Lithuania Food Cans Market Opportunity Assessment, By Capacity, 2022 & 2032F |
9.4 Lithuania Food Cans Market Opportunity Assessment, By End-use, 2022 & 2032F |
10 Lithuania Food Cans Market - Competitive Landscape |
10.1 Lithuania Food Cans Market Revenue Share, By Companies, 2025 |
10.2 Lithuania Food Cans Market Competitive Benchmarking, By Operating and Technical Parameters |
11 Company Profiles |
12 Recommendations |
13 Disclaimer |
Export potential assessment - trade Analytics for 2030
Export potential enables firms to identify high-growth global markets with greater confidence by combining advanced trade intelligence with a structured quantitative methodology. The framework analyzes emerging demand trends and country-level import patterns while integrating macroeconomic and trade datasets such as GDP and population forecasts, bilateral import–export flows, tariff structures, elasticity differentials between developed and developing economies, geographic distance, and import demand projections. Using weighted trade values from 2020–2024 as the base period to project country-to-country export potential for 2030, these inputs are operationalized through calculated drivers such as gravity model parameters, tariff impact factors, and projected GDP per-capita growth. Through an analysis of hidden potentials, demand hotspots, and market conditions that are most favorable to success, this method enables firms to focus on target countries, maximize returns, and global expansion with data, backed by accuracy.
By factoring in the projected importer demand gap that is currently unmet and could be potential opportunity, it identifies the potential for the Exporter (Country) among 190 countries, against the general trade analysis, which identifies the biggest importer or exporter.
To discover high-growth global markets and optimize your business strategy:
Click Here
Pricing
- Single User License$ 1,995
- Department License$ 2,400
- Site License$ 3,120
- Global License$ 3,795

Search
Thought Leadership and Analyst Meet


Our Clients
Latest Reports
- Canada Cloud CFD Market (2026-2032) | Size & Revenue, Industry, Growth, Competitive Landscape, Forecast, Segmentation, Value, Outlook, Trends, Share, Analysis, Companies
- Taiwan Food Delivery Platform Market (2026-2032) | Companies, Outlook, Analysis, Trends, Value, Revenue, Segmentation, Share, Forecast, Competitive Landscape, Growth, Size & Forecast
- United Kingdom (UK) Long-term Care Insurance Market (2026-2032) | Growth, Share, Consumer Insights, Drivers, Opportunities, Competition, Pricing Analysis, Segments, Restraints, Companies, Competitive, Value, Outlook, Size, Demand, Analysis, Challenges, Strategic Insights, Investment Trends, Revenue, Trends, Supply, Forecast
- United Kingdom (UK) Long Term Care Market (2026-2032) | Companies, Outlook, Analysis, Trends, Value, Revenue, Segmentation, Share, Forecast, Competitive Landscape, Growth, Size & Forecast
- Iraq Insulation and Waterproofing Market (2026-2032) | Outlook, Drivers, Growth, Size, Share, Industry, Revenue, Trends, Demand, Competitive, Strategic Insights, Opportunities, Segments, Companies, Challenges, Strategy, Consumer Insights, Analysis, Investment Trends, Value, Segmentation, Forecast, Restraints
- India Switchgear Market Outlook (2026-2032) | Size, Share, Trends, Growth, Revenue, Forecast, Analysis, Value, Outlook
- Pakistan Contraceptive Implants Market (2025-2031) | Demand, Growth, Size, Share, Industry, Pricing Analysis, Competitive, Strategic Insights, Strategy, Consumer Insights, Analysis, Investment Trends, Opportunities, Revenue, Segments, Value, Segmentation, Supply, Forecast, Restraints, Outlook, Competition, Drivers, Trends, Companies, Challenges
- Sri Lanka Packaging Market (2026-2032) | Outlook, Competition, Drivers, Trends, Demand, Pricing Analysis, Competitive, Strategic Insights, Companies, Challenges, Strategy, Consumer Insights, Analysis, Investment Trends, Opportunities, Growth, Size, Share, Industry, Revenue, Segments, Value, Segmentation, Supply, Forecast, Restraints
- India Kids Watches Market (2026-2032) | Strategy, Consumer Insights, Analysis, Investment Trends, Opportunities, Growth, Size, Share, Industry, Revenue, Segments, Value, Segmentation, Supply, Forecast, Restraints, Outlook, Competition, Drivers, Trends, Demand, Pricing Analysis, Competitive, Strategic Insights, Companies, Challenges
- Saudi Arabia Core Assurance Service Market (2025-2031) | Strategy, Consumer Insights, Analysis, Investment Trends, Opportunities, Growth, Size, Share, Industry, Revenue, Segments, Value, Segmentation, Supply, Forecast, Restraints, Outlook, Competition, Drivers, Trends, Demand, Pricing Analysis, Competitive, Strategic Insights, Companies, Challenges
Industry Events and Analyst Meet

India EV Show 2026

EV tech India Expo 2026

Auto Tech Asia 2026

Battery Tech India 2026

Smart Production Solutions Guangzhou 2026
Whitepaper
- Middle East & Africa Commercial Security Market Click here to view more.
- Middle East & Africa Fire Safety Systems & Equipment Market Click here to view more.
- GCC Drone Market Click here to view more.
- Middle East Lighting Fixture Market Click here to view more.
- GCC Physical & Perimeter Security Market Click here to view more.
6WResearch In News
- Doha a strategic location for EV manufacturing hub: IPA Qatar
- Demand for luxury TVs surging in the GCC, says Samsung
- Empowering Growth: The Thriving Journey of Bangladesh’s Cable Industry
- Demand for luxury TVs surging in the GCC, says Samsung
- Video call with a traditional healer? Once unthinkable, it’s now common in South Africa
- Intelligent Buildings To Smooth GCC’s Path To Net Zero