Lithuania Fructose Market (2026-2032) | Segmentation, Outlook, Forecast, Analysis, Growth, Revenue, Size, Value, Trends, Companies, Share & Industry
Market Forecast By Product (High Fructose Corn Syrup, Fructose Syrups, Fructose Solids), By Application (Beverages, Processed Foods, Dairy Products, Confectionary, Bakery & Cereals, Others) And Competitive Landscape
| Product Code: ETC4733396 | Publication Date: Nov 2023 | Updated Date: Apr 2026 | Product Type: Market Research Report | |
| Publisher: 6Wresearch | Author: Shubham Padhi | No. of Pages: 60 | No. of Figures: 30 | No. of Tables: 5 |
Lithuania Fructose Market Size (2020-2030)
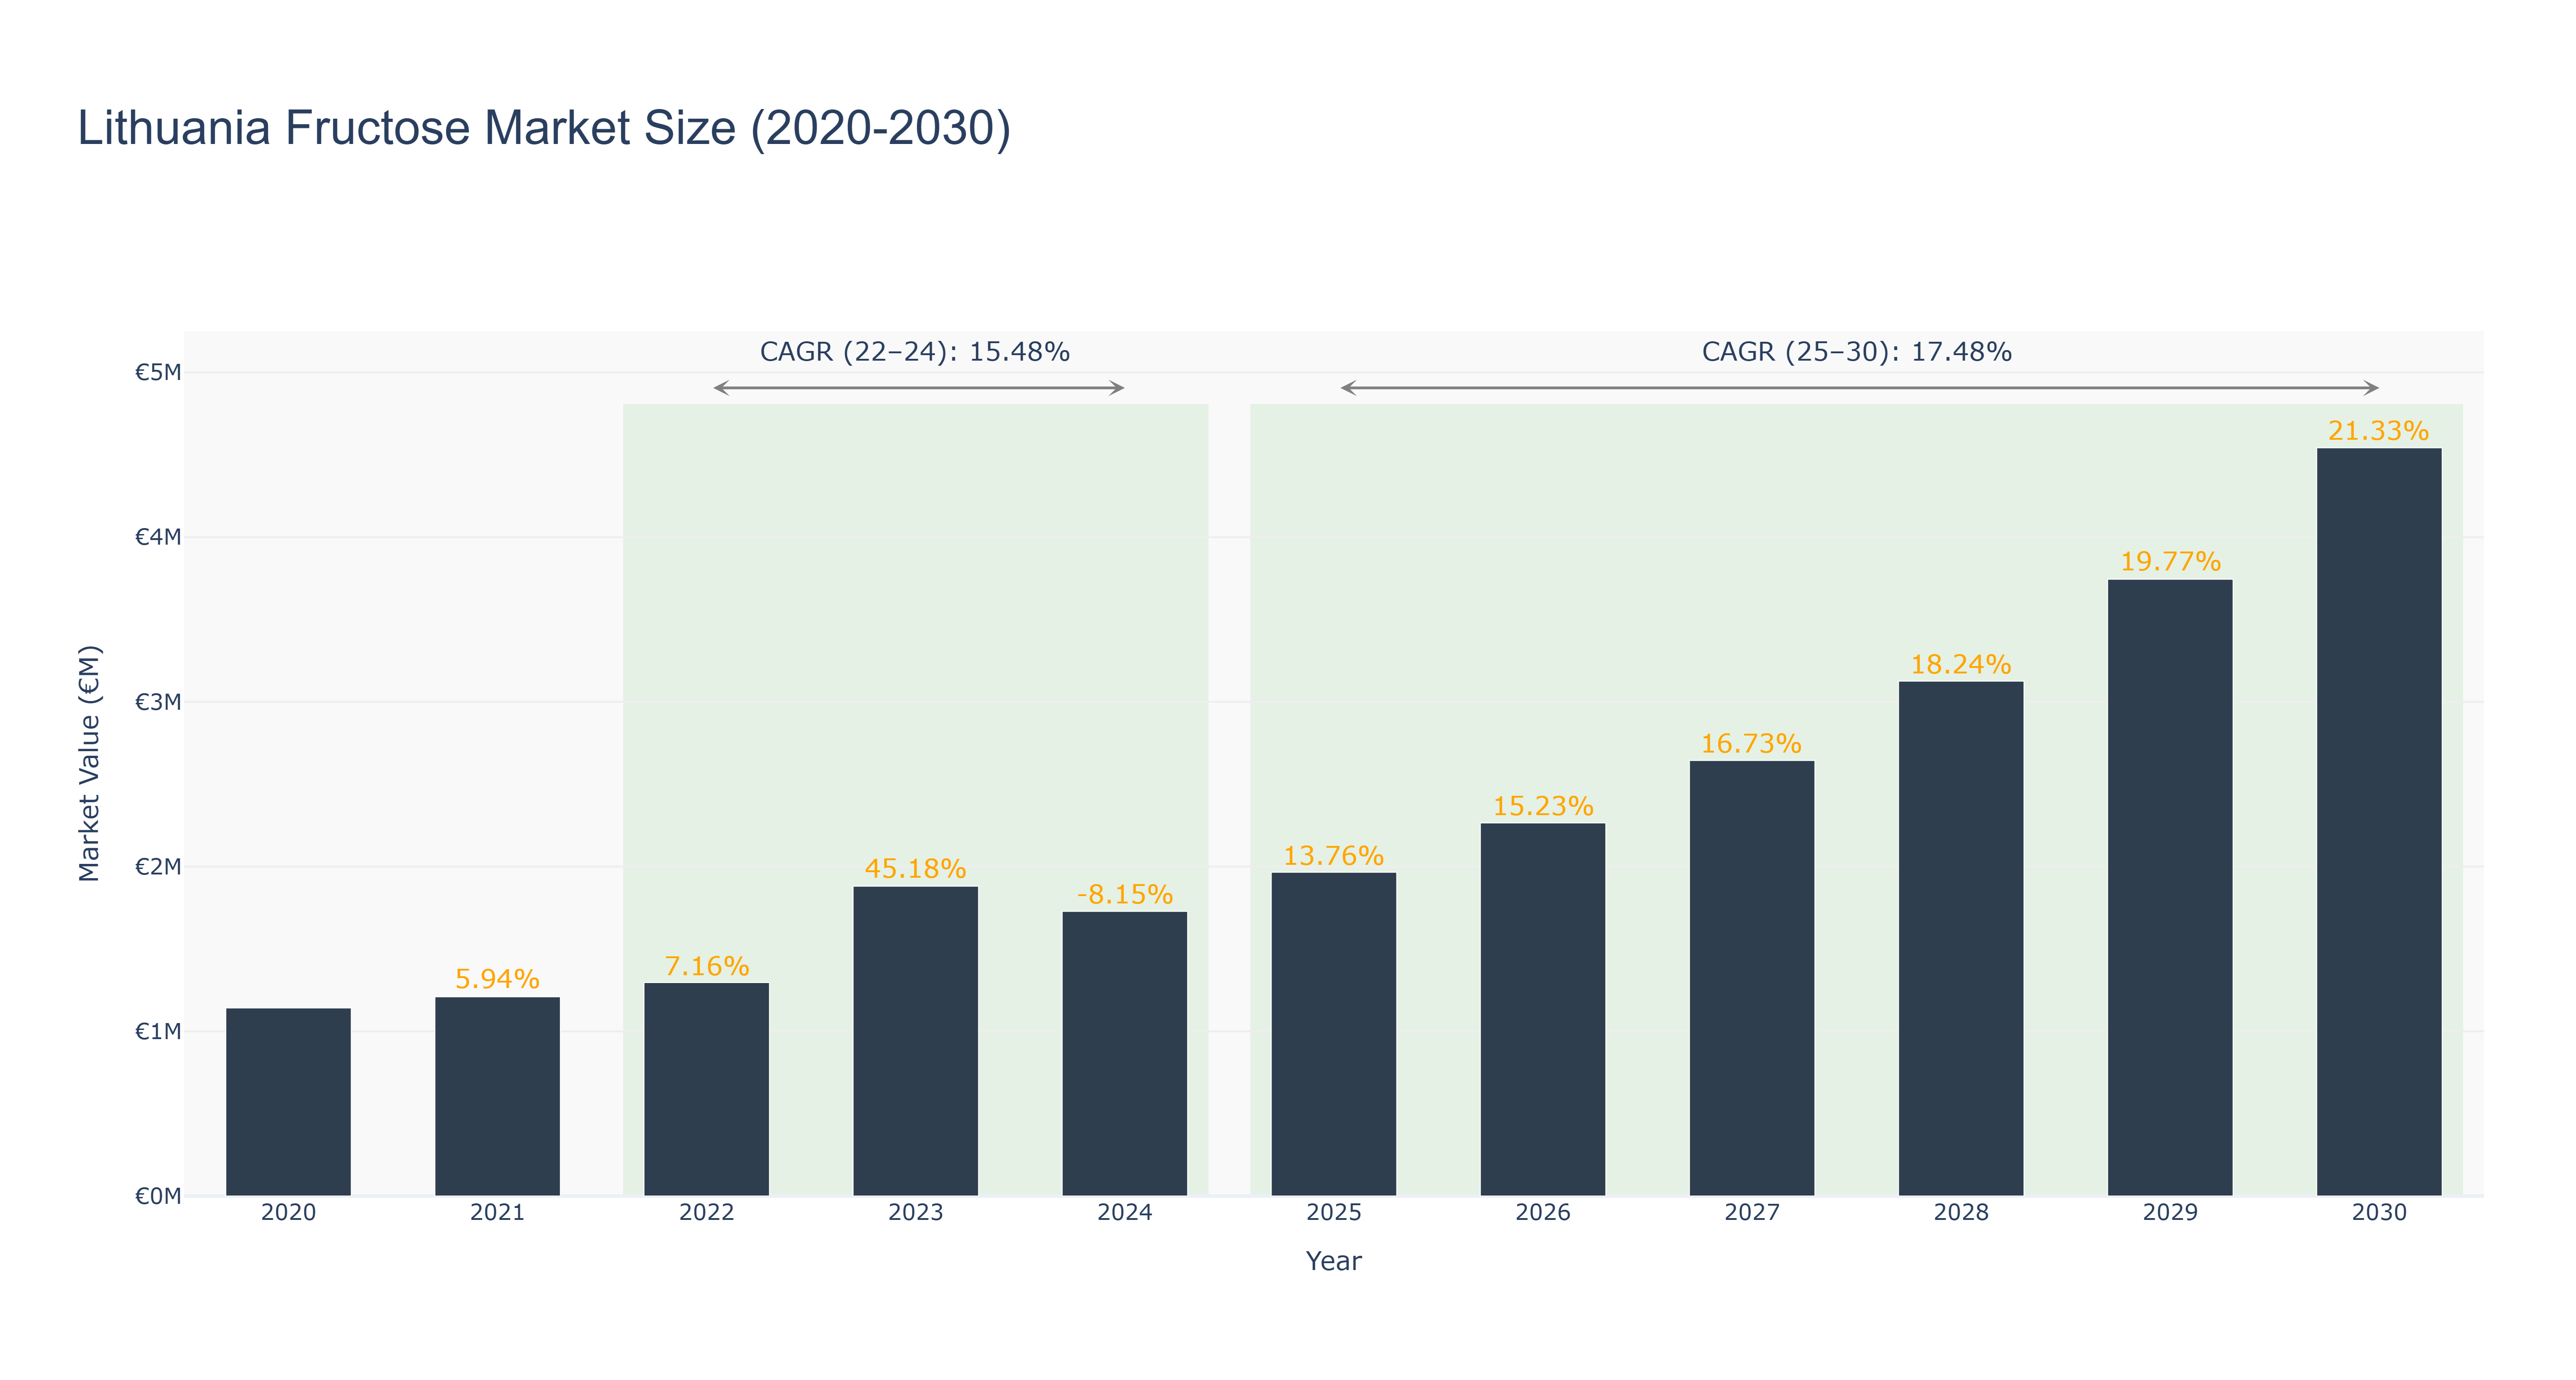
Lithuania Fructose Market has shown a notable growth trajectory over the years. The market peaked at €4.54 million in 2030, with a steady increase from €1.14 million in 2020. Notably, the market experienced a decline in 2024 to €1.73 million, attributed to a temporary market saturation and increased competition. However, subsequent years saw significant growth, driven by consumer demand for healthier alternatives and increased awareness of fructose benefits. The forecasted CAGR from 2025 to 2030 stands at 17.48%, indicating a promising future for the market. Recent developments in Lithuania's food industry, such as government initiatives to promote local produce and sustainable practices, are expected to further fuel the growth of the fructose market in the coming years.
Lithuania Fructose Market: Production & Trade Performance (2019-2025)
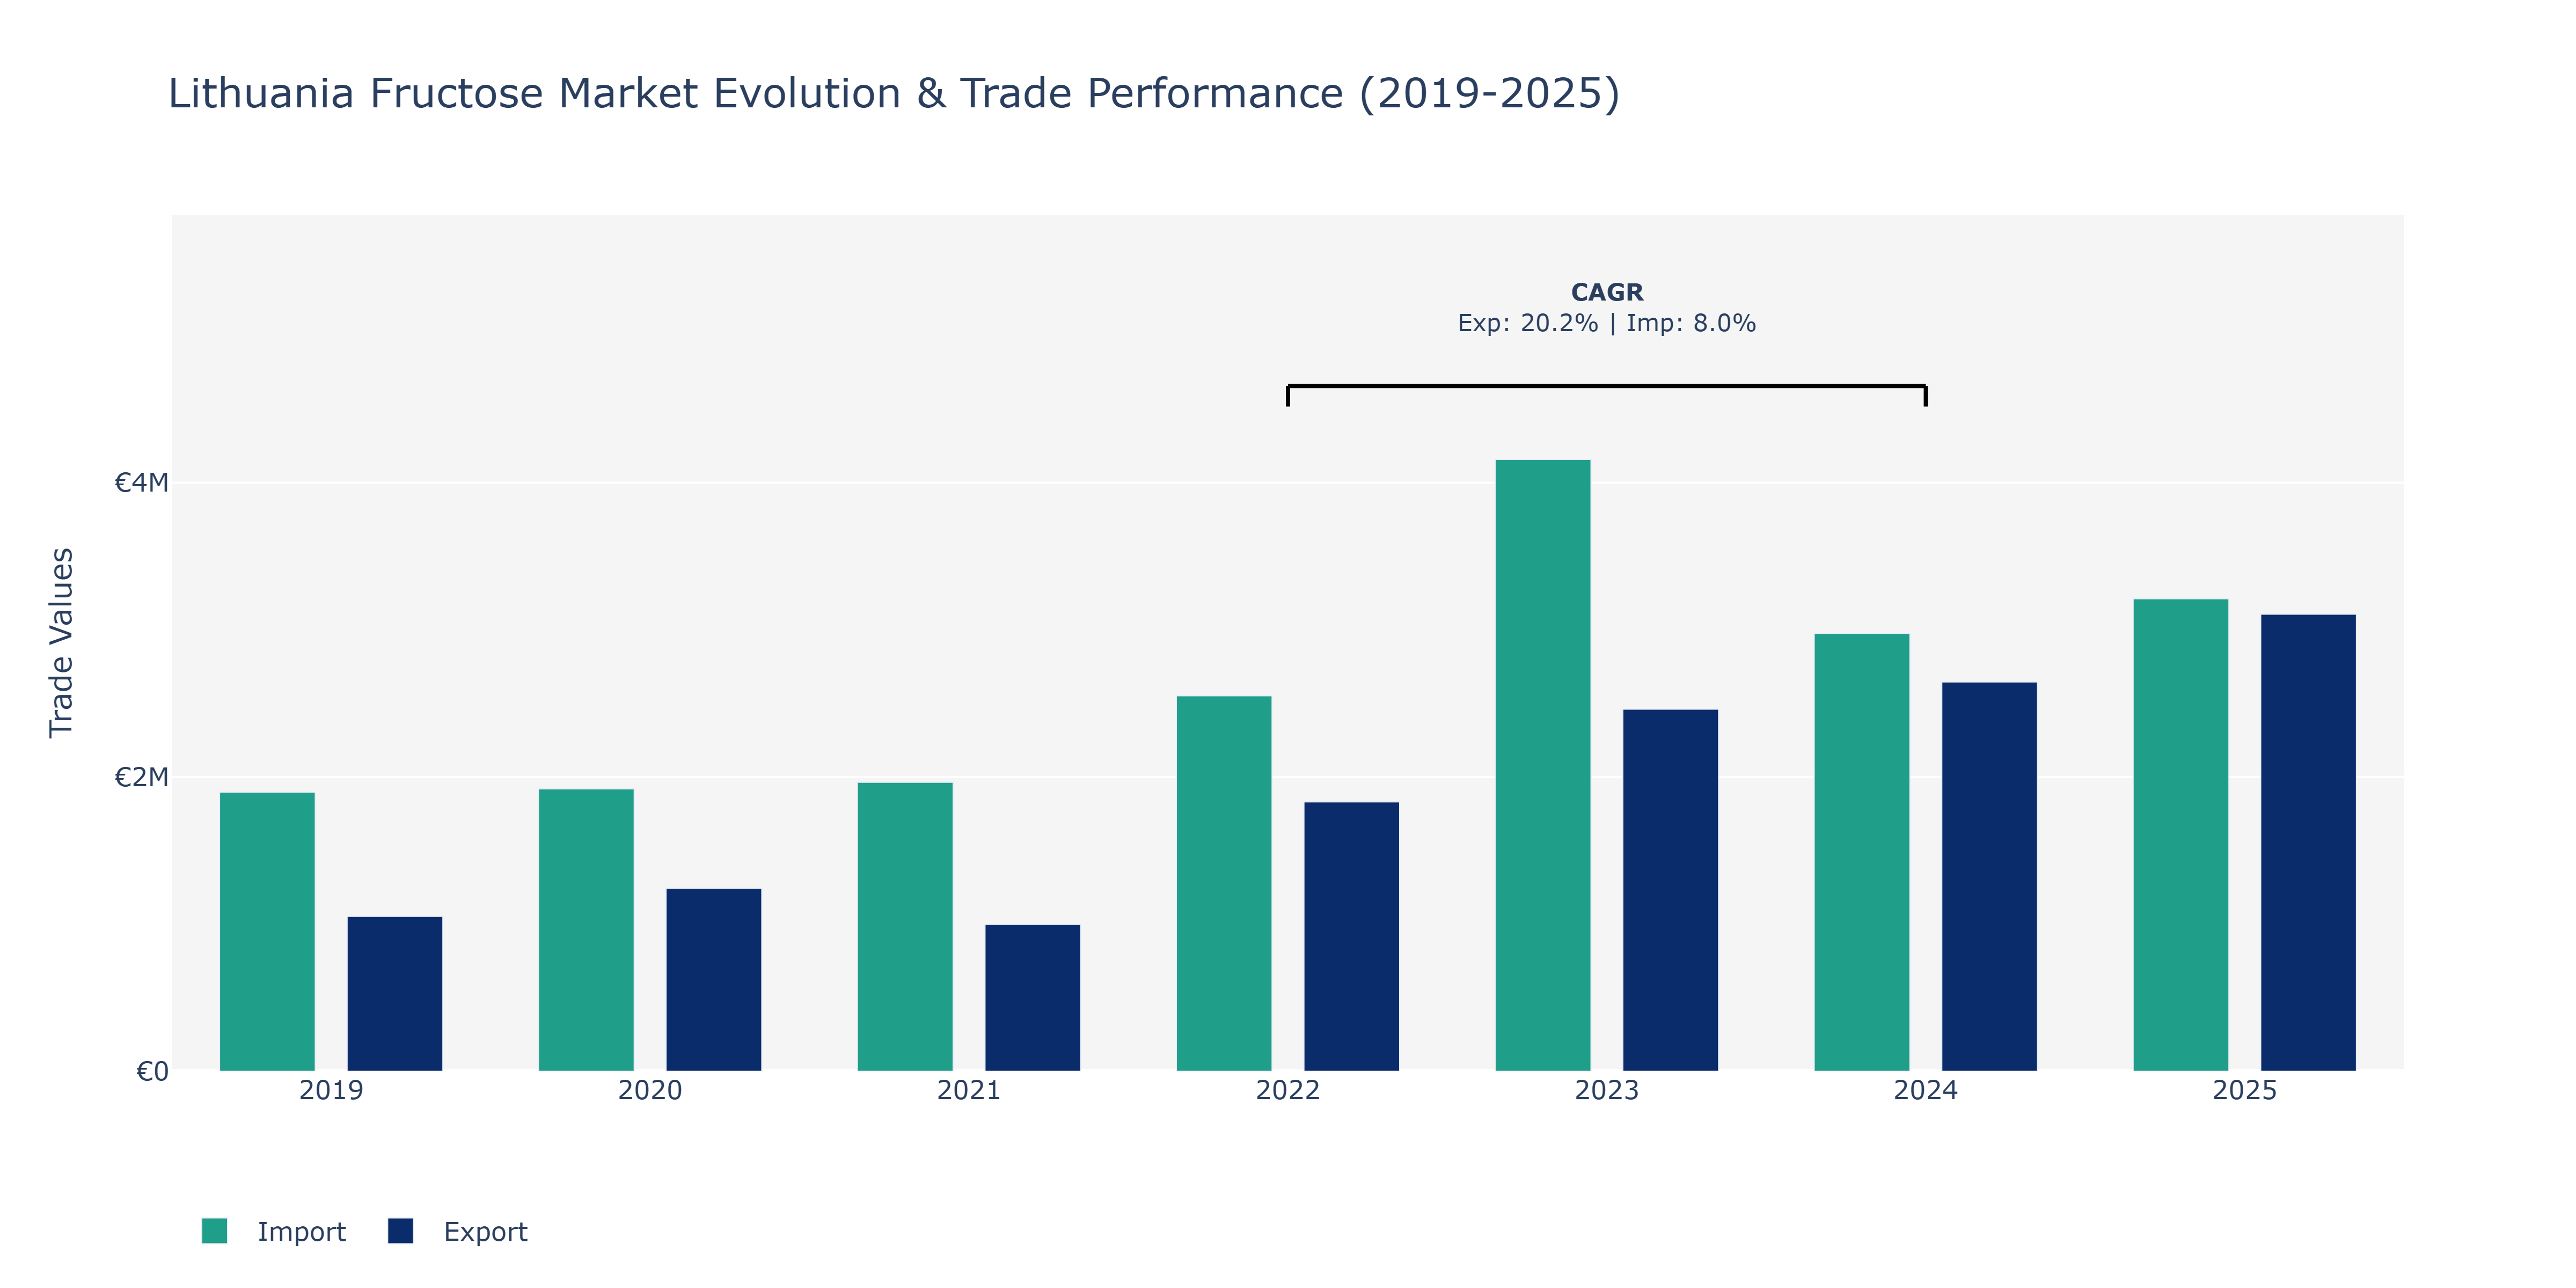
The Lithuania Fructose Market experienced fluctuations in both exports and imports from 2019 to 2025. Exports increased from €1.05 million in 2019 to €3.11 million in 2025, showing a consistent upward trend. The peak export value was reached in 2025, reflecting a substantial growth of €2.06 million compared to 2019. Imports, on the other hand, fluctuated over the years. After peaking at €4.16 million in 2023, imports declined to €2.98 million in 2024, before slightly increasing to €3.21 million in 2025. The market saw a notable shift in trade dynamics, possibly influenced by global demand patterns, local production capacities, and regulatory changes impacting import volumes. The growth in exports could be attributed to the rising popularity of fructose as a natural sweetener and the favorable trade agreements enhancing market access, while the fluctuations in imports might reflect changes in raw material sourcing strategies or shifts in domestic consumption patterns.
Key Highlights of the Report:
- Lithuania Fructose Market Outlook
- Market Size of Lithuania Fructose Market, 2025
- Forecast of Lithuania Fructose Market, 2032
- Historical Data and Forecast of Lithuania Fructose Revenues & Volume for the Period 2022 - 2032F
- Lithuania Fructose Market Trend Evolution
- Lithuania Fructose Market Drivers and Challenges
- Lithuania Fructose Price Trends
- Lithuania Fructose Porter`s Five Forces
- Lithuania Fructose Industry Life Cycle
- Historical Data and Forecast of Lithuania Fructose Market Revenues & Volume By Product for the Period 2022 - 2032F
- Historical Data and Forecast of Lithuania Fructose Market Revenues & Volume By High Fructose Corn Syrup for the Period 2022 - 2032F
- Historical Data and Forecast of Lithuania Fructose Market Revenues & Volume By Fructose Syrups for the Period 2022 - 2032F
- Historical Data and Forecast of Lithuania Fructose Market Revenues & Volume By Fructose Solids for the Period 2022 - 2032F
- Historical Data and Forecast of Lithuania Fructose Market Revenues & Volume By Application for the Period 2022 - 2032F
- Historical Data and Forecast of Lithuania Fructose Market Revenues & Volume By Beverages for the Period 2022 - 2032F
- Historical Data and Forecast of Lithuania Fructose Market Revenues & Volume By Processed Foods for the Period 2022 - 2032F
- Historical Data and Forecast of Lithuania Fructose Market Revenues & Volume By Dairy Products for the Period 2022 - 2032F
- Historical Data and Forecast of Lithuania Fructose Market Revenues & Volume By Confectionary for the Period 2022 - 2032F
- Historical Data and Forecast of Lithuania Fructose Market Revenues & Volume By Bakery & Cereals for the Period 2022 - 2032F
- Historical Data and Forecast of Lithuania Fructose Market Revenues & Volume By Others for the Period 2022 - 2032F
- Lithuania Fructose Import Export Trade Statistics
- Market Opportunity Assessment By Product
- Market Opportunity Assessment By Application
- Lithuania Fructose Top Companies Market Share
- Lithuania Fructose Competitive Benchmarking By Technical and Operational Parameters
- Lithuania Fructose Company Profiles
- Lithuania Fructose Key Strategic Recommendations
Frequently Asked Questions About the Market Study (FAQs):
6Wresearch actively monitors the Lithuania Fructose Market and publishes its comprehensive annual report, highlighting emerging trends, growth drivers, revenue analysis, and forecast outlook. Our insights help businesses to make data-backed strategic decisions with ongoing market dynamics. Our analysts track relevent industries related to the Lithuania Fructose Market, allowing our clients with actionable intelligence and reliable forecasts tailored to emerging regional needs.
Yes, we provide customisation as per your requirements. To learn more, feel free to contact us on sales@6wresearch.com
1 Executive Summary |
2 Introduction |
2.1 Key Highlights of the Report |
2.2 Report Description |
2.3 Market Scope & Segmentation |
2.4 Research Methodology |
2.5 Assumptions |
3 Lithuania Fructose Market Overview |
3.1 Lithuania Country Macro Economic Indicators |
3.2 Lithuania Fructose Market Revenues & Volume, 2022 & 2032F |
3.3 Lithuania Fructose Market - Industry Life Cycle |
3.4 Lithuania Fructose Market - Porter's Five Forces |
3.5 Lithuania Fructose Market Revenues & Volume Share, By Product, 2022 & 2032F |
3.6 Lithuania Fructose Market Revenues & Volume Share, By Application, 2022 & 2032F |
4 Lithuania Fructose Market Dynamics |
4.1 Impact Analysis |
4.2 Market Drivers |
4.2.1 Increasing health consciousness among consumers leading to a shift towards natural sweeteners like fructose |
4.2.2 Growing awareness about the negative impacts of high sugar consumption on health |
4.2.3 Rising demand for low-calorie and low-glycemic index food and beverage products |
4.3 Market Restraints |
4.3.1 Price volatility of raw materials used in fructose production |
4.3.2 Stringent regulations and quality standards governing the production and sale of fructose |
4.3.3 Competition from alternative sweeteners such as stevia and erythritol |
5 Lithuania Fructose Market Trends |
6 Lithuania Fructose Market Segmentations |
6.1 Lithuania Fructose Market, By Product |
6.1.1 Overview and Analysis |
6.1.2 Lithuania Fructose Market Revenues & Volume, By High Fructose Corn Syrup, 2022 - 2032F |
6.1.3 Lithuania Fructose Market Revenues & Volume, By Fructose Syrups, 2022 - 2032F |
6.1.4 Lithuania Fructose Market Revenues & Volume, By Fructose Solids, 2022 - 2032F |
6.2 Lithuania Fructose Market, By Application |
6.2.1 Overview and Analysis |
6.2.2 Lithuania Fructose Market Revenues & Volume, By Beverages, 2022 - 2032F |
6.2.3 Lithuania Fructose Market Revenues & Volume, By Processed Foods, 2022 - 2032F |
6.2.4 Lithuania Fructose Market Revenues & Volume, By Dairy Products, 2022 - 2032F |
6.2.5 Lithuania Fructose Market Revenues & Volume, By Confectionary, 2022 - 2032F |
6.2.6 Lithuania Fructose Market Revenues & Volume, By Bakery & Cereals, 2022 - 2032F |
6.2.7 Lithuania Fructose Market Revenues & Volume, By Others, 2022 - 2032F |
7 Lithuania Fructose Market Import-Export Trade Statistics |
7.1 Lithuania Fructose Market Export to Major Countries |
7.2 Lithuania Fructose Market Imports from Major Countries |
8 Lithuania Fructose Market Key Performance Indicators |
8.1 Consumer awareness and perception of fructose as a healthier alternative to traditional sugar |
8.2 Adoption rate of fructose by food and beverage manufacturers in new product development |
8.3 Number of new product launches featuring fructose as a key ingredient |
8.4 Growth in the number of health and wellness-focused stores carrying fructose products |
8.5 Percentage increase in fructose consumption among the target demographic |
9 Lithuania Fructose Market - Opportunity Assessment |
9.1 Lithuania Fructose Market Opportunity Assessment, By Product, 2022 & 2032F |
9.2 Lithuania Fructose Market Opportunity Assessment, By Application, 2022 & 2032F |
10 Lithuania Fructose Market - Competitive Landscape |
10.1 Lithuania Fructose Market Revenue Share, By Companies, 2025 |
10.2 Lithuania Fructose Market Competitive Benchmarking, By Operating and Technical Parameters |
11 Company Profiles |
12 Recommendations | 13 Disclaimer |
Global Go To Market Strategy - 2030
Export potential enables firms to identify high-growth global markets with greater confidence by combining advanced trade intelligence with a structured quantitative methodology. The framework analyzes emerging demand trends and country-level import patterns while integrating macroeconomic and trade datasets such as GDP and population forecasts, bilateral import–export flows, tariff structures, elasticity differentials between developed and developing economies, geographic distance, and import demand projections. Using weighted trade values from 2020–2024 as the base period to project country-to-country export potential for 2030, these inputs are operationalized through calculated drivers such as gravity model parameters, tariff impact factors, and projected GDP per-capita growth. Through an analysis of hidden potentials, demand hotspots, and market conditions that are most favorable to success, this method enables firms to focus on target countries, maximize returns, and global expansion with data, backed by accuracy.
By factoring in the projected importer demand gap that is currently unmet and could be potential opportunity, it identifies the potential for the Exporter (Country) among 190 countries, against the general trade analysis, which identifies the biggest importer or exporter.
To discover high-growth global markets and optimize your business strategy:
Click Here
Pricing
- Single User License$ 1,995
- Department License$ 2,400
- Site License$ 3,120
- Global License$ 3,795

Leadership Perspectives from Industry Events
Search
Thought Leadership and Analyst Meet


Our Clients
6WResearch In News
- Doha a strategic location for EV manufacturing hub: IPA Qatar
- Demand for luxury TVs surging in the GCC, says Samsung
- Empowering Growth: The Thriving Journey of Bangladesh’s Cable Industry
- Demand for luxury TVs surging in the GCC, says Samsung
- Video call with a traditional healer? Once unthinkable, it’s now common in South Africa
- Intelligent Buildings To Smooth GCC’s Path To Net Zero
Latest Reports
- Taiwan Airport Wireless Infrastructure Market (2026-2032)
- Vietnam Airport Wireless Infrastructure Market (2026-2032)
- Thailand Airport Wireless Infrastructure Market (2026-2032)
- South Korea Airport Wireless Infrastructure Market (2026-2032)
- Romania Airport Wireless Infrastructure Market (2026-2032)
- Qatar Airport Wireless Infrastructure Market (2026-2032)
- Philippines Airport Wireless Infrastructure Market (2026-2032)
- Japan Airport Wireless Infrastructure Market (2026-2032)
- Taiwan Airport Winter Services Market (2026-2032)
- Vietnam Airport Winter Services Market (2026-2032)
Industry Events and Analyst Meet

HIMTEX 2026

India Refining Summit 2026

India EV Show 2026

EV tech India Expo 2026

Auto Tech Asia 2026
Whitepaper
- Middle East & Africa Commercial Security Market Click here to view more.
- Middle East & Africa Fire Safety Systems & Equipment Market Click here to view more.
- GCC Drone Market Click here to view more.
- Middle East Lighting Fixture Market Click here to view more.
- GCC Physical & Perimeter Security Market Click here to view more.