Lithuania Glue Brush Market (2026-2032) | Segmentation, Revenue, Industry, Companies, Outlook, Size, Growth, Forecast, Trends, Analysis, Share & Value
Market Forecast By Type (Wheel Shape, Cotton Swab, Others), By Application (Business Use, Industrial Applications, Others) And Competitive Landscape
| Product Code: ETC5097417 | Publication Date: Nov 2023 | Updated Date: Apr 2026 | Product Type: Market Research Report | |
| Publisher: 6Wresearch | Author: Shubham Padhi | No. of Pages: 60 | No. of Figures: 30 | No. of Tables: 5 |
Lithuania Glue Brush Market Size (2020-2030)
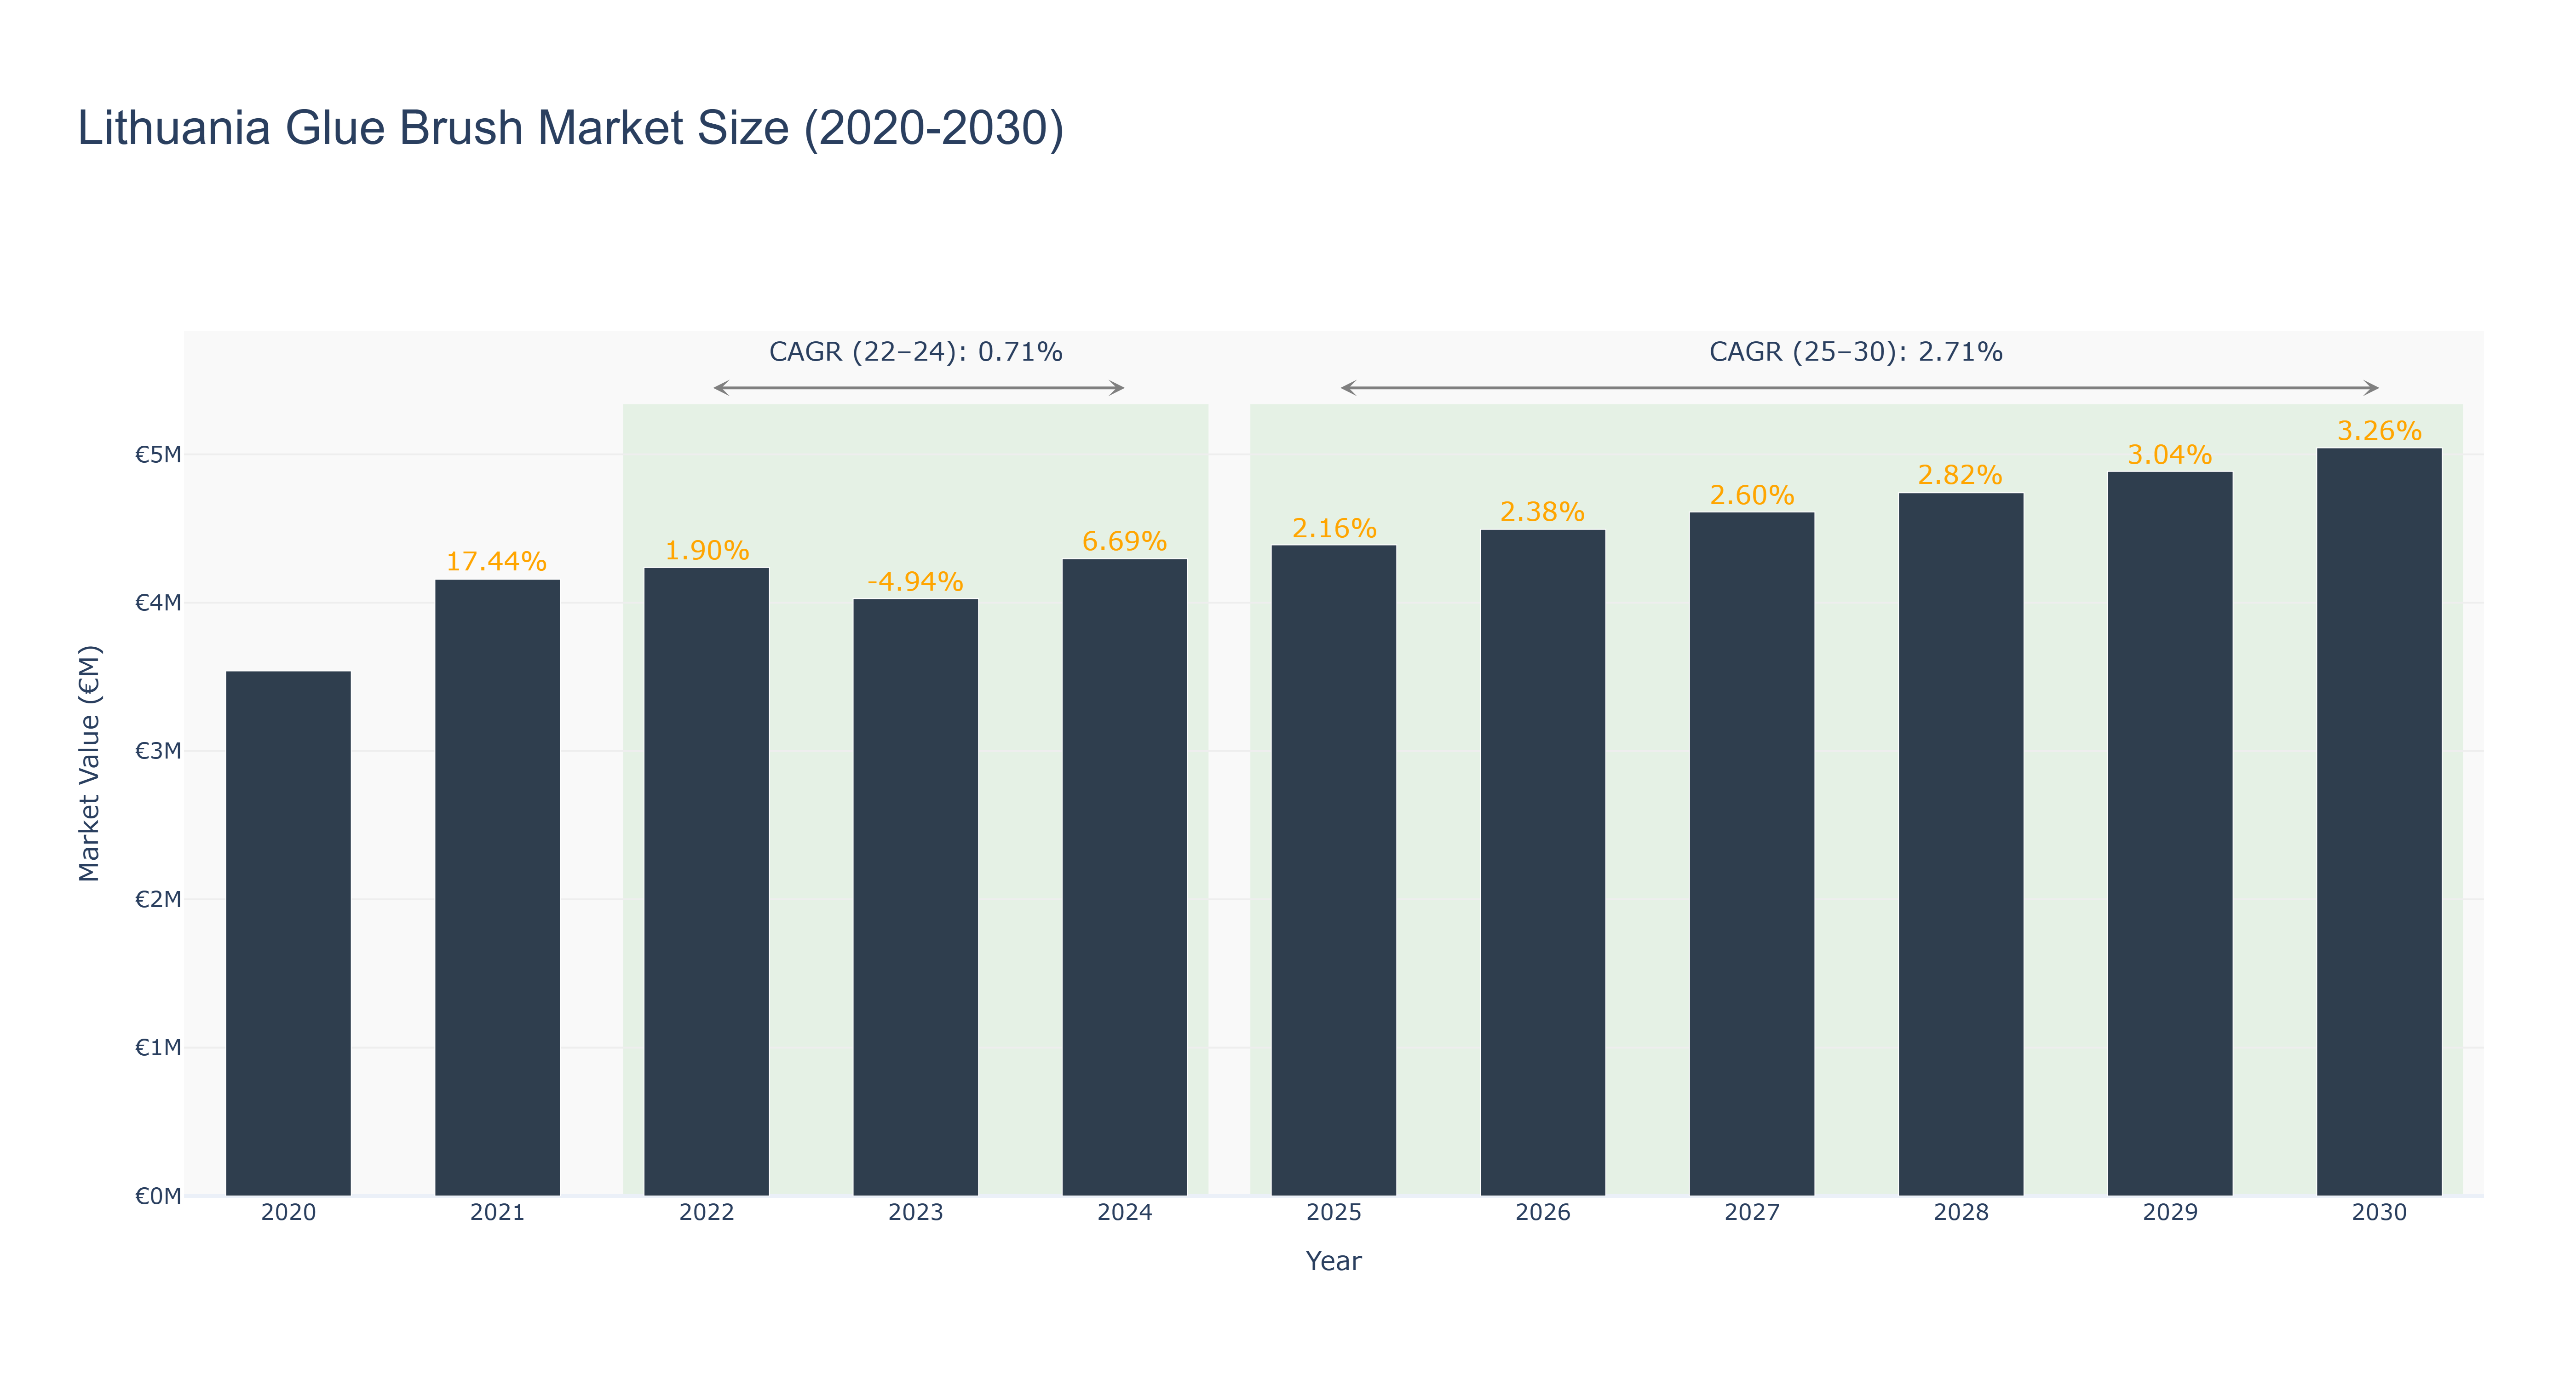
The Lithuania Glue Brush Market experienced noteworthy fluctuations from 2020 to 2024, peaking at €4.24 million in 2022 before declining to €4.03 million in 2023, marking a growth rate of -4.94%. This period displayed a modest compound annual growth rate (CAGR) of 0.71% from 2022 to 2024, influenced by shifting consumer preferences and supply chain disruptions. Looking ahead, the market is projected to recover and grow at a CAGR of 2.71% from 2025 to 2030, with an anticipated market size of €5.04 million by 2030. This growth will likely be supported by increasing DIY and crafting trends, as well as advancements in adhesive technologies, which may drive demand for specialized glue brushes. As the market stabilizes, investments in sustainable materials and eco-friendly products could further enhance market prospects in the coming years.
Lithuania Glue Brush Market: Production & Trade Performance (2019-2025)
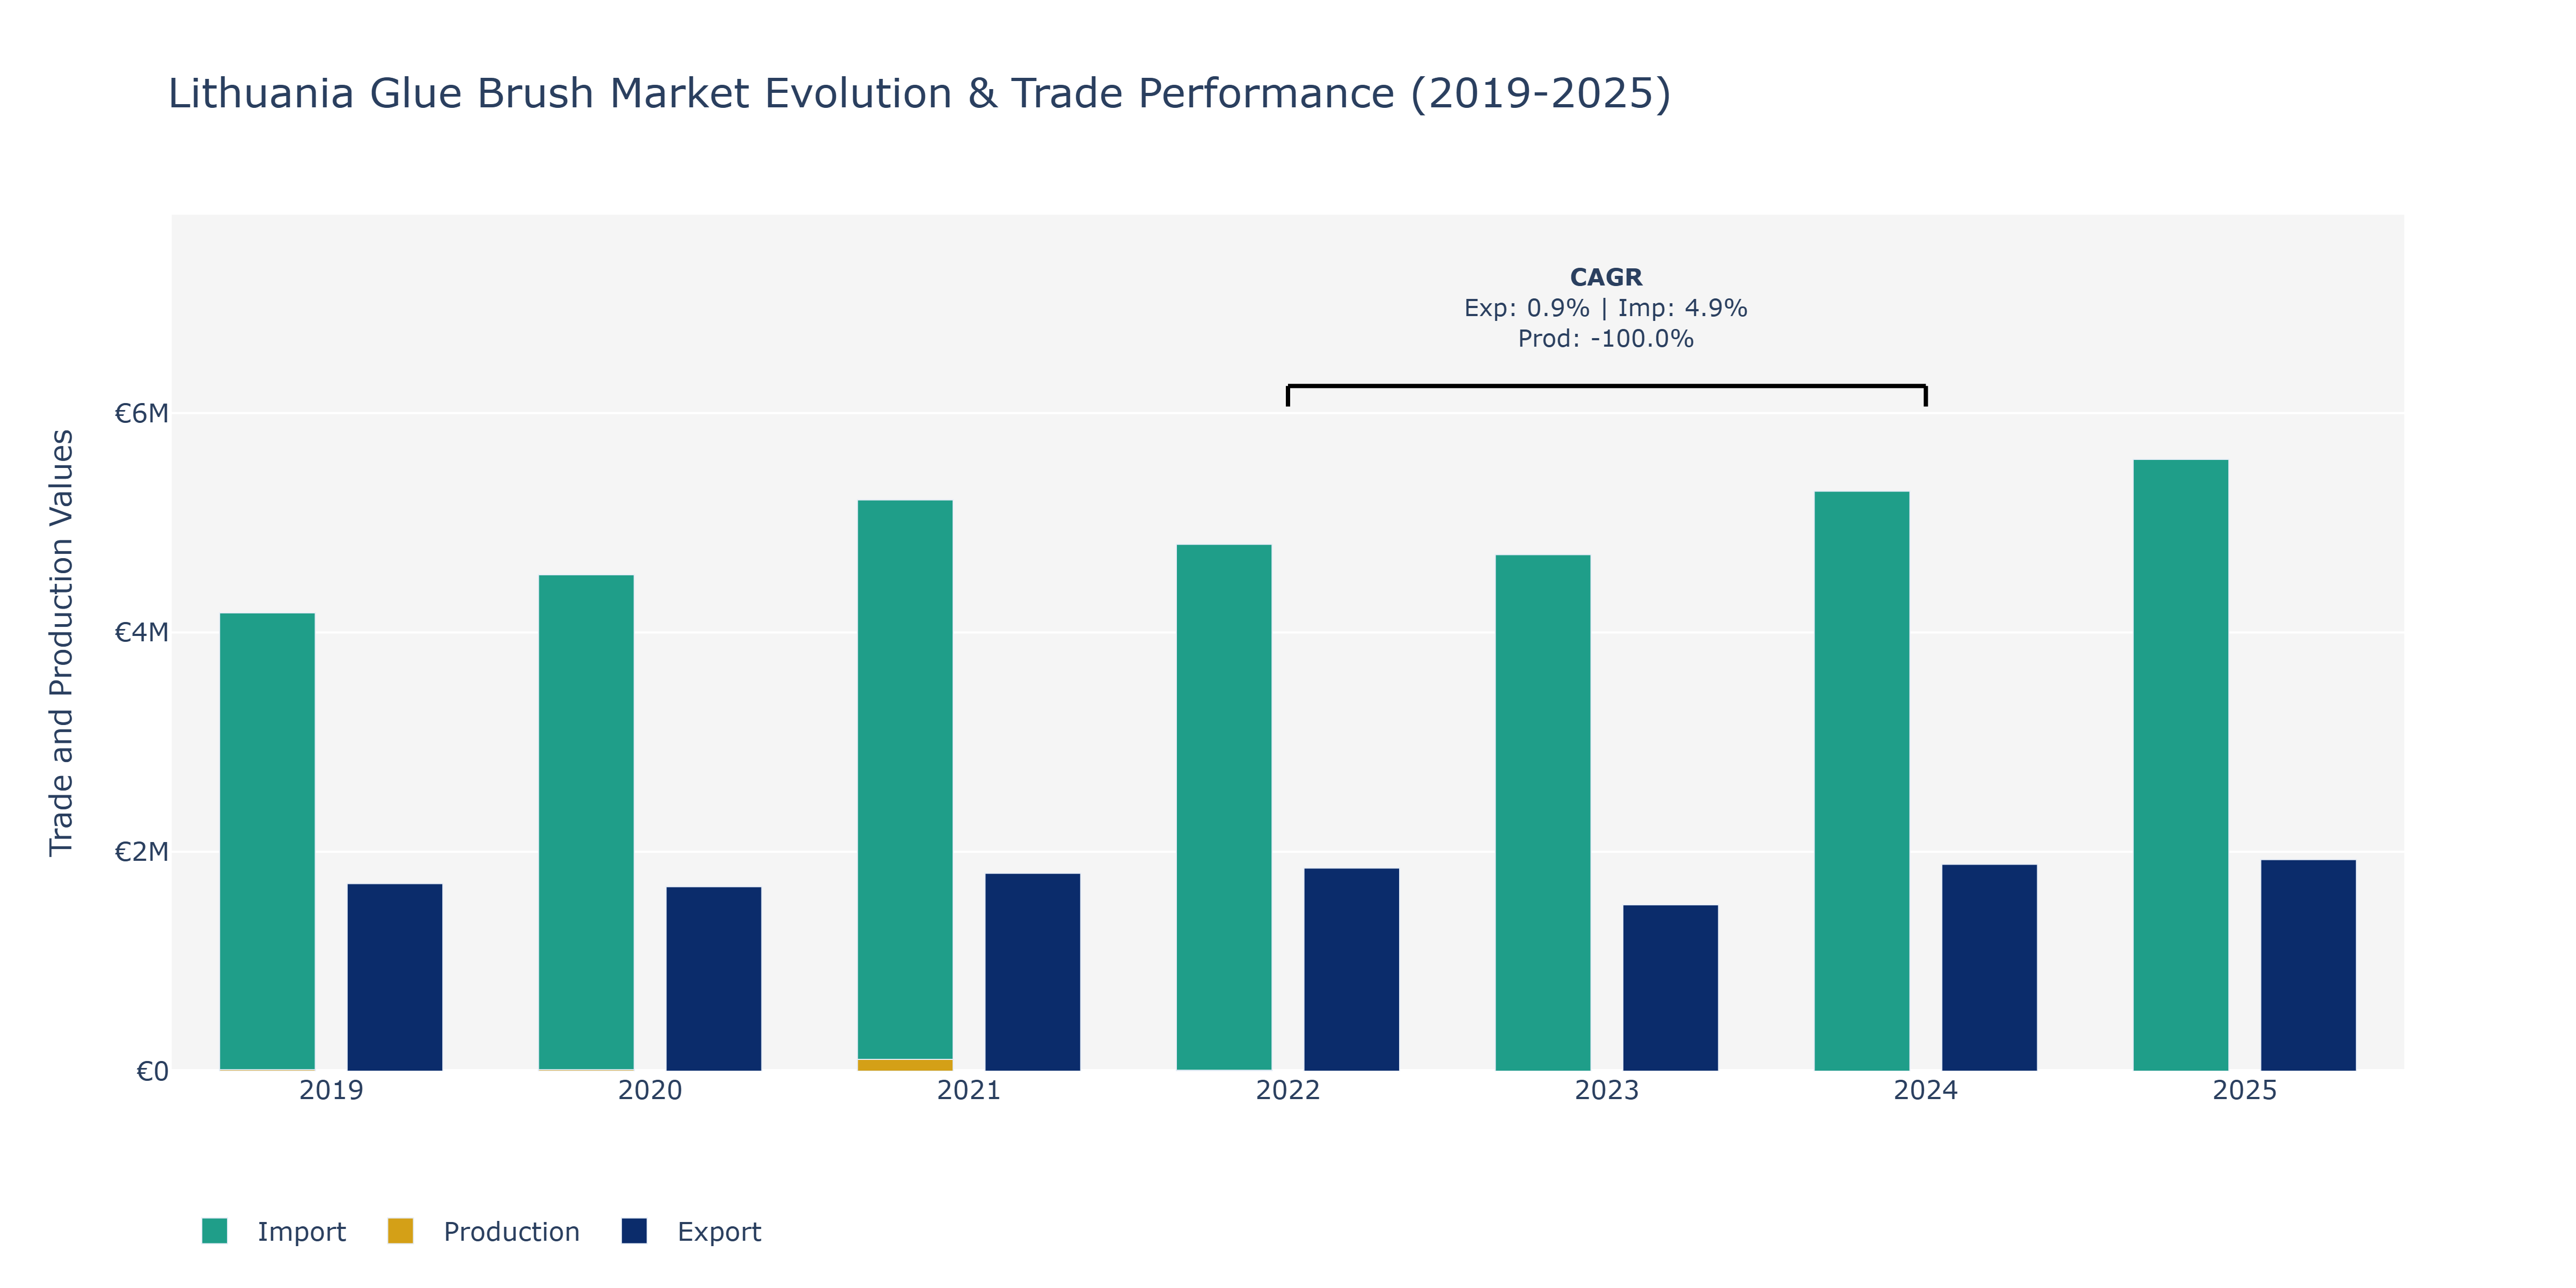
In the Lithuania Glue Brush Market, exports saw fluctuations over the years, reaching a peak in 2025 at approximately €1.93 million. Imports also displayed variability, with a peak in 2025 at around €5.58 million. Production experienced a drastic decline from 2021 to 2022, plummeting from €107 million to €8 million, showcasing a noteworthy shift. The rise in exports could be attributed to increased international demand for high-quality adhesive products from Lithuania, potentially driven by the country's reputation for reliable manufacturing processes. On the import side, the surge might be linked to the need for advanced raw materials or specialized components for the production of glue brushes. The considerable production decline in 2022 could be due to operational disruptions, market saturation, or strategic shifts towards outsourcing production. These trends reflect the market's dynamism and the adaptability of Lithuanian manufacturers to global demand fluctuations.
Key Highlights of the Report:
- Lithuania Glue Brush Market Outlook
- Market Size of Lithuania Glue Brush Market, 2025
- Forecast of Lithuania Glue Brush Market, 2032
- Historical Data and Forecast of Lithuania Glue Brush Revenues & Volume for the Period 2022 - 2032F
- Lithuania Glue Brush Market Trend Evolution
- Lithuania Glue Brush Market Drivers and Challenges
- Lithuania Glue Brush Price Trends
- Lithuania Glue Brush Porter`s Five Forces
- Lithuania Glue Brush Industry Life Cycle
- Historical Data and Forecast of Lithuania Glue Brush Market Revenues & Volume By Type for the Period 2022 - 2032F
- Historical Data and Forecast of Lithuania Glue Brush Market Revenues & Volume By Wheel Shape for the Period 2022 - 2032F
- Historical Data and Forecast of Lithuania Glue Brush Market Revenues & Volume By Cotton Swab for the Period 2022 - 2032F
- Historical Data and Forecast of Lithuania Glue Brush Market Revenues & Volume By Others for the Period 2022 - 2032F
- Historical Data and Forecast of Lithuania Glue Brush Market Revenues & Volume By Application for the Period 2022 - 2032F
- Historical Data and Forecast of Lithuania Glue Brush Market Revenues & Volume By Business Use for the Period 2022 - 2032F
- Historical Data and Forecast of Lithuania Glue Brush Market Revenues & Volume By Industrial Applications for the Period 2022 - 2032F
- Historical Data and Forecast of Lithuania Glue Brush Market Revenues & Volume By Others for the Period 2022 - 2032F
- Lithuania Glue Brush Import Export Trade Statistics
- Market Opportunity Assessment By Type
- Market Opportunity Assessment By Application
- Lithuania Glue Brush Top Companies Market Share
- Lithuania Glue Brush Competitive Benchmarking By Technical and Operational Parameters
- Lithuania Glue Brush Company Profiles
- Lithuania Glue Brush Key Strategic Recommendations
Frequently Asked Questions About the Market Study (FAQs):
6Wresearch actively monitors the Lithuania Glue Brush Market and publishes its comprehensive annual report, highlighting emerging trends, growth drivers, revenue analysis, and forecast outlook. Our insights help businesses to make data-backed strategic decisions with ongoing market dynamics. Our analysts track relevent industries related to the Lithuania Glue Brush Market, allowing our clients with actionable intelligence and reliable forecasts tailored to emerging regional needs.
Yes, we provide customisation as per your requirements. To learn more, feel free to contact us on sales@6wresearch.com
1 Executive Summary |
2 Introduction |
2.1 Key Highlights of the Report |
2.2 Report Description |
2.3 Market Scope & Segmentation |
2.4 Research Methodology |
2.5 Assumptions |
3 Lithuania Glue Brush Market Overview |
3.1 Lithuania Country Macro Economic Indicators |
3.2 Lithuania Glue Brush Market Revenues & Volume, 2022 & 2032F |
3.3 Lithuania Glue Brush Market - Industry Life Cycle |
3.4 Lithuania Glue Brush Market - Porter's Five Forces |
3.5 Lithuania Glue Brush Market Revenues & Volume Share, By Type, 2022 & 2032F |
3.6 Lithuania Glue Brush Market Revenues & Volume Share, By Application, 2022 & 2032F |
4 Lithuania Glue Brush Market Dynamics |
4.1 Impact Analysis |
4.2 Market Drivers |
4.2.1 Growth in the construction industry leading to increased demand for glue brushes |
4.2.2 Innovation in adhesive technologies driving the need for specialized glue brush products |
4.2.3 Rising awareness about DIY projects and home improvements boosting the sales of glue brushes |
4.3 Market Restraints |
4.3.1 Fluctuating raw material prices impacting the production cost of glue brushes |
4.3.2 Competition from alternative adhesive application methods such as spray adhesives |
4.3.3 Economic uncertainties affecting consumer spending on non-essential items like glue brushes |
5 Lithuania Glue Brush Market Trends |
6 Lithuania Glue Brush Market Segmentations |
6.1 Lithuania Glue Brush Market, By Type |
6.1.1 Overview and Analysis |
6.1.2 Lithuania Glue Brush Market Revenues & Volume, By Wheel Shape, 2022 - 2032F |
6.1.3 Lithuania Glue Brush Market Revenues & Volume, By Cotton Swab, 2022 - 2032F |
6.1.4 Lithuania Glue Brush Market Revenues & Volume, By Others, 2022 - 2032F |
6.2 Lithuania Glue Brush Market, By Application |
6.2.1 Overview and Analysis |
6.2.2 Lithuania Glue Brush Market Revenues & Volume, By Business Use, 2022 - 2032F |
6.2.3 Lithuania Glue Brush Market Revenues & Volume, By Industrial Applications, 2022 - 2032F |
6.2.4 Lithuania Glue Brush Market Revenues & Volume, By Others, 2022 - 2032F |
7 Lithuania Glue Brush Market Import-Export Trade Statistics |
7.1 Lithuania Glue Brush Market Export to Major Countries |
7.2 Lithuania Glue Brush Market Imports from Major Countries |
8 Lithuania Glue Brush Market Key Performance Indicators |
8.1 Number of new adhesive products launched in the market |
8.2 Percentage of revenue from specialized glue brush products |
8.3 Customer satisfaction ratings for glue brush quality and performance |
9 Lithuania Glue Brush Market - Opportunity Assessment |
9.1 Lithuania Glue Brush Market Opportunity Assessment, By Type, 2022 & 2032F |
9.2 Lithuania Glue Brush Market Opportunity Assessment, By Application, 2022 & 2032F |
10 Lithuania Glue Brush Market - Competitive Landscape |
10.1 Lithuania Glue Brush Market Revenue Share, By Companies, 2025 |
10.2 Lithuania Glue Brush Market Competitive Benchmarking, By Operating and Technical Parameters |
11 Company Profiles |
12 Recommendations | 13 Disclaimer |
Export potential assessment - trade Analytics for 2030
Export potential enables firms to identify high-growth global markets with greater confidence by combining advanced trade intelligence with a structured quantitative methodology. The framework analyzes emerging demand trends and country-level import patterns while integrating macroeconomic and trade datasets such as GDP and population forecasts, bilateral import–export flows, tariff structures, elasticity differentials between developed and developing economies, geographic distance, and import demand projections. Using weighted trade values from 2020–2024 as the base period to project country-to-country export potential for 2030, these inputs are operationalized through calculated drivers such as gravity model parameters, tariff impact factors, and projected GDP per-capita growth. Through an analysis of hidden potentials, demand hotspots, and market conditions that are most favorable to success, this method enables firms to focus on target countries, maximize returns, and global expansion with data, backed by accuracy.
By factoring in the projected importer demand gap that is currently unmet and could be potential opportunity, it identifies the potential for the Exporter (Country) among 190 countries, against the general trade analysis, which identifies the biggest importer or exporter.
To discover high-growth global markets and optimize your business strategy:
Click Here
Pricing
- Single User License$ 1,995
- Department License$ 2,400
- Site License$ 3,120
- Global License$ 3,795

Search
Thought Leadership and Analyst Meet


Our Clients
Latest Reports
- India Ultrasonic Smart Water Meter Market (2026-2032) | Outlook, Competition, Drivers, Trends, Demand, Competitive, Strategic Insights, Companies, Challenges, Strategy, Consumer Insights, Analysis, Opportunities, Growth, Size, Share, Industry, Revenue, Segments, Value, Segmentation, Supply, Forecast, Restraints,
- India Electromagnetic Bulk Flow Meter Market (2026-2032) | Analysis, Challenges, Strategic Insights, Supply, Forecast, Growth, Share, Consumer Insights, Competitive, Value, Outlook, Size & Demand,
- India Battery Powered Bulk Flow Meter Market (2026-2032) | Outlook, Analysis, Competitive Landscape, Growth, Size, Trends, Value, Revenue, Companies, Segmentation, Share & Forecast
- Bosnia and Herzegovina Fuel-Efficient Winglets Market (2026-2032) | Growth, Competition, Strategy, Restraints, Trends, Challenges, segmentation, Value, Outlook, Investment Opportunities, Analysis, Revenue, Companies, Insights, Pricing, Size, Drivers, Demand, Share, Forecast
- Canada Cloud CFD Market (2026-2032) | Size & Revenue, Industry, Growth, Competitive Landscape, Forecast, Segmentation, Value, Outlook, Trends, Share, Analysis, Companies
- Taiwan Food Delivery Platform Market (2026-2032) | Companies, Outlook, Analysis, Trends, Value, Revenue, Segmentation, Share, Forecast, Competitive Landscape, Growth, Size & Forecast
- United Kingdom (UK) Long-term Care Insurance Market (2026-2032) | Growth, Share, Consumer Insights, Drivers, Opportunities, Competition, Pricing Analysis, Segments, Restraints, Companies, Competitive, Value, Outlook, Size, Demand, Analysis, Challenges, Strategic Insights, Investment Trends, Revenue, Trends, Supply, Forecast
- United Kingdom (UK) Long Term Care Market (2026-2032) | Companies, Outlook, Analysis, Trends, Value, Revenue, Segmentation, Share, Forecast, Competitive Landscape, Growth, Size & Forecast
- Iraq Insulation and Waterproofing Market (2026-2032) | Outlook, Drivers, Growth, Size, Share, Industry, Revenue, Trends, Demand, Competitive, Strategic Insights, Opportunities, Segments, Companies, Challenges, Strategy, Consumer Insights, Analysis, Investment Trends, Value, Segmentation, Forecast, Restraints
- India Switchgear Market Outlook (2026-2032) | Size, Share, Trends, Growth, Revenue, Forecast, Analysis, Value, Outlook
Industry Events and Analyst Meet

HIMTEX 2026

India Refining Summit 2026

India EV Show 2026

EV tech India Expo 2026

Auto Tech Asia 2026
Whitepaper
- Middle East & Africa Commercial Security Market Click here to view more.
- Middle East & Africa Fire Safety Systems & Equipment Market Click here to view more.
- GCC Drone Market Click here to view more.
- Middle East Lighting Fixture Market Click here to view more.
- GCC Physical & Perimeter Security Market Click here to view more.
6WResearch In News
- Doha a strategic location for EV manufacturing hub: IPA Qatar
- Demand for luxury TVs surging in the GCC, says Samsung
- Empowering Growth: The Thriving Journey of Bangladesh’s Cable Industry
- Demand for luxury TVs surging in the GCC, says Samsung
- Video call with a traditional healer? Once unthinkable, it’s now common in South Africa
- Intelligent Buildings To Smooth GCC’s Path To Net Zero