Lithuania Green Beans Market (2026-2032) | Outlook, Segmentation, Size & Revenue, Growth, Share, Value, Analysis, Companies, Trends, Competitive Landscape, Forecast, Industry
Market Forecast By Product Type (Green Bean Granules, Green Bean Powder), By Application (Snacks and Savouries, Infant Food, Soups, Sauces and Dressings, Animal Feeds, Market Retail, Others), By Packaging Type (Plastic Bags, Cans, Jars, Others), By End Users (Households, Restaurants and Hotels, Flour Industry, Others), By Distribution Channel (Departmental Stores, Supermarkets, Specialty Stores, Conveniences Store, Online Stores, Others) And Competitive Landscape
| Product Code: ETC8042090 | Publication Date: Sep 2024 | Updated Date: Apr 2026 | Product Type: Market Research Report | |
| Publisher: 6Wresearch | Author: Shubham Padhi | No. of Pages: 75 | No. of Figures: 35 | No. of Tables: 20 |
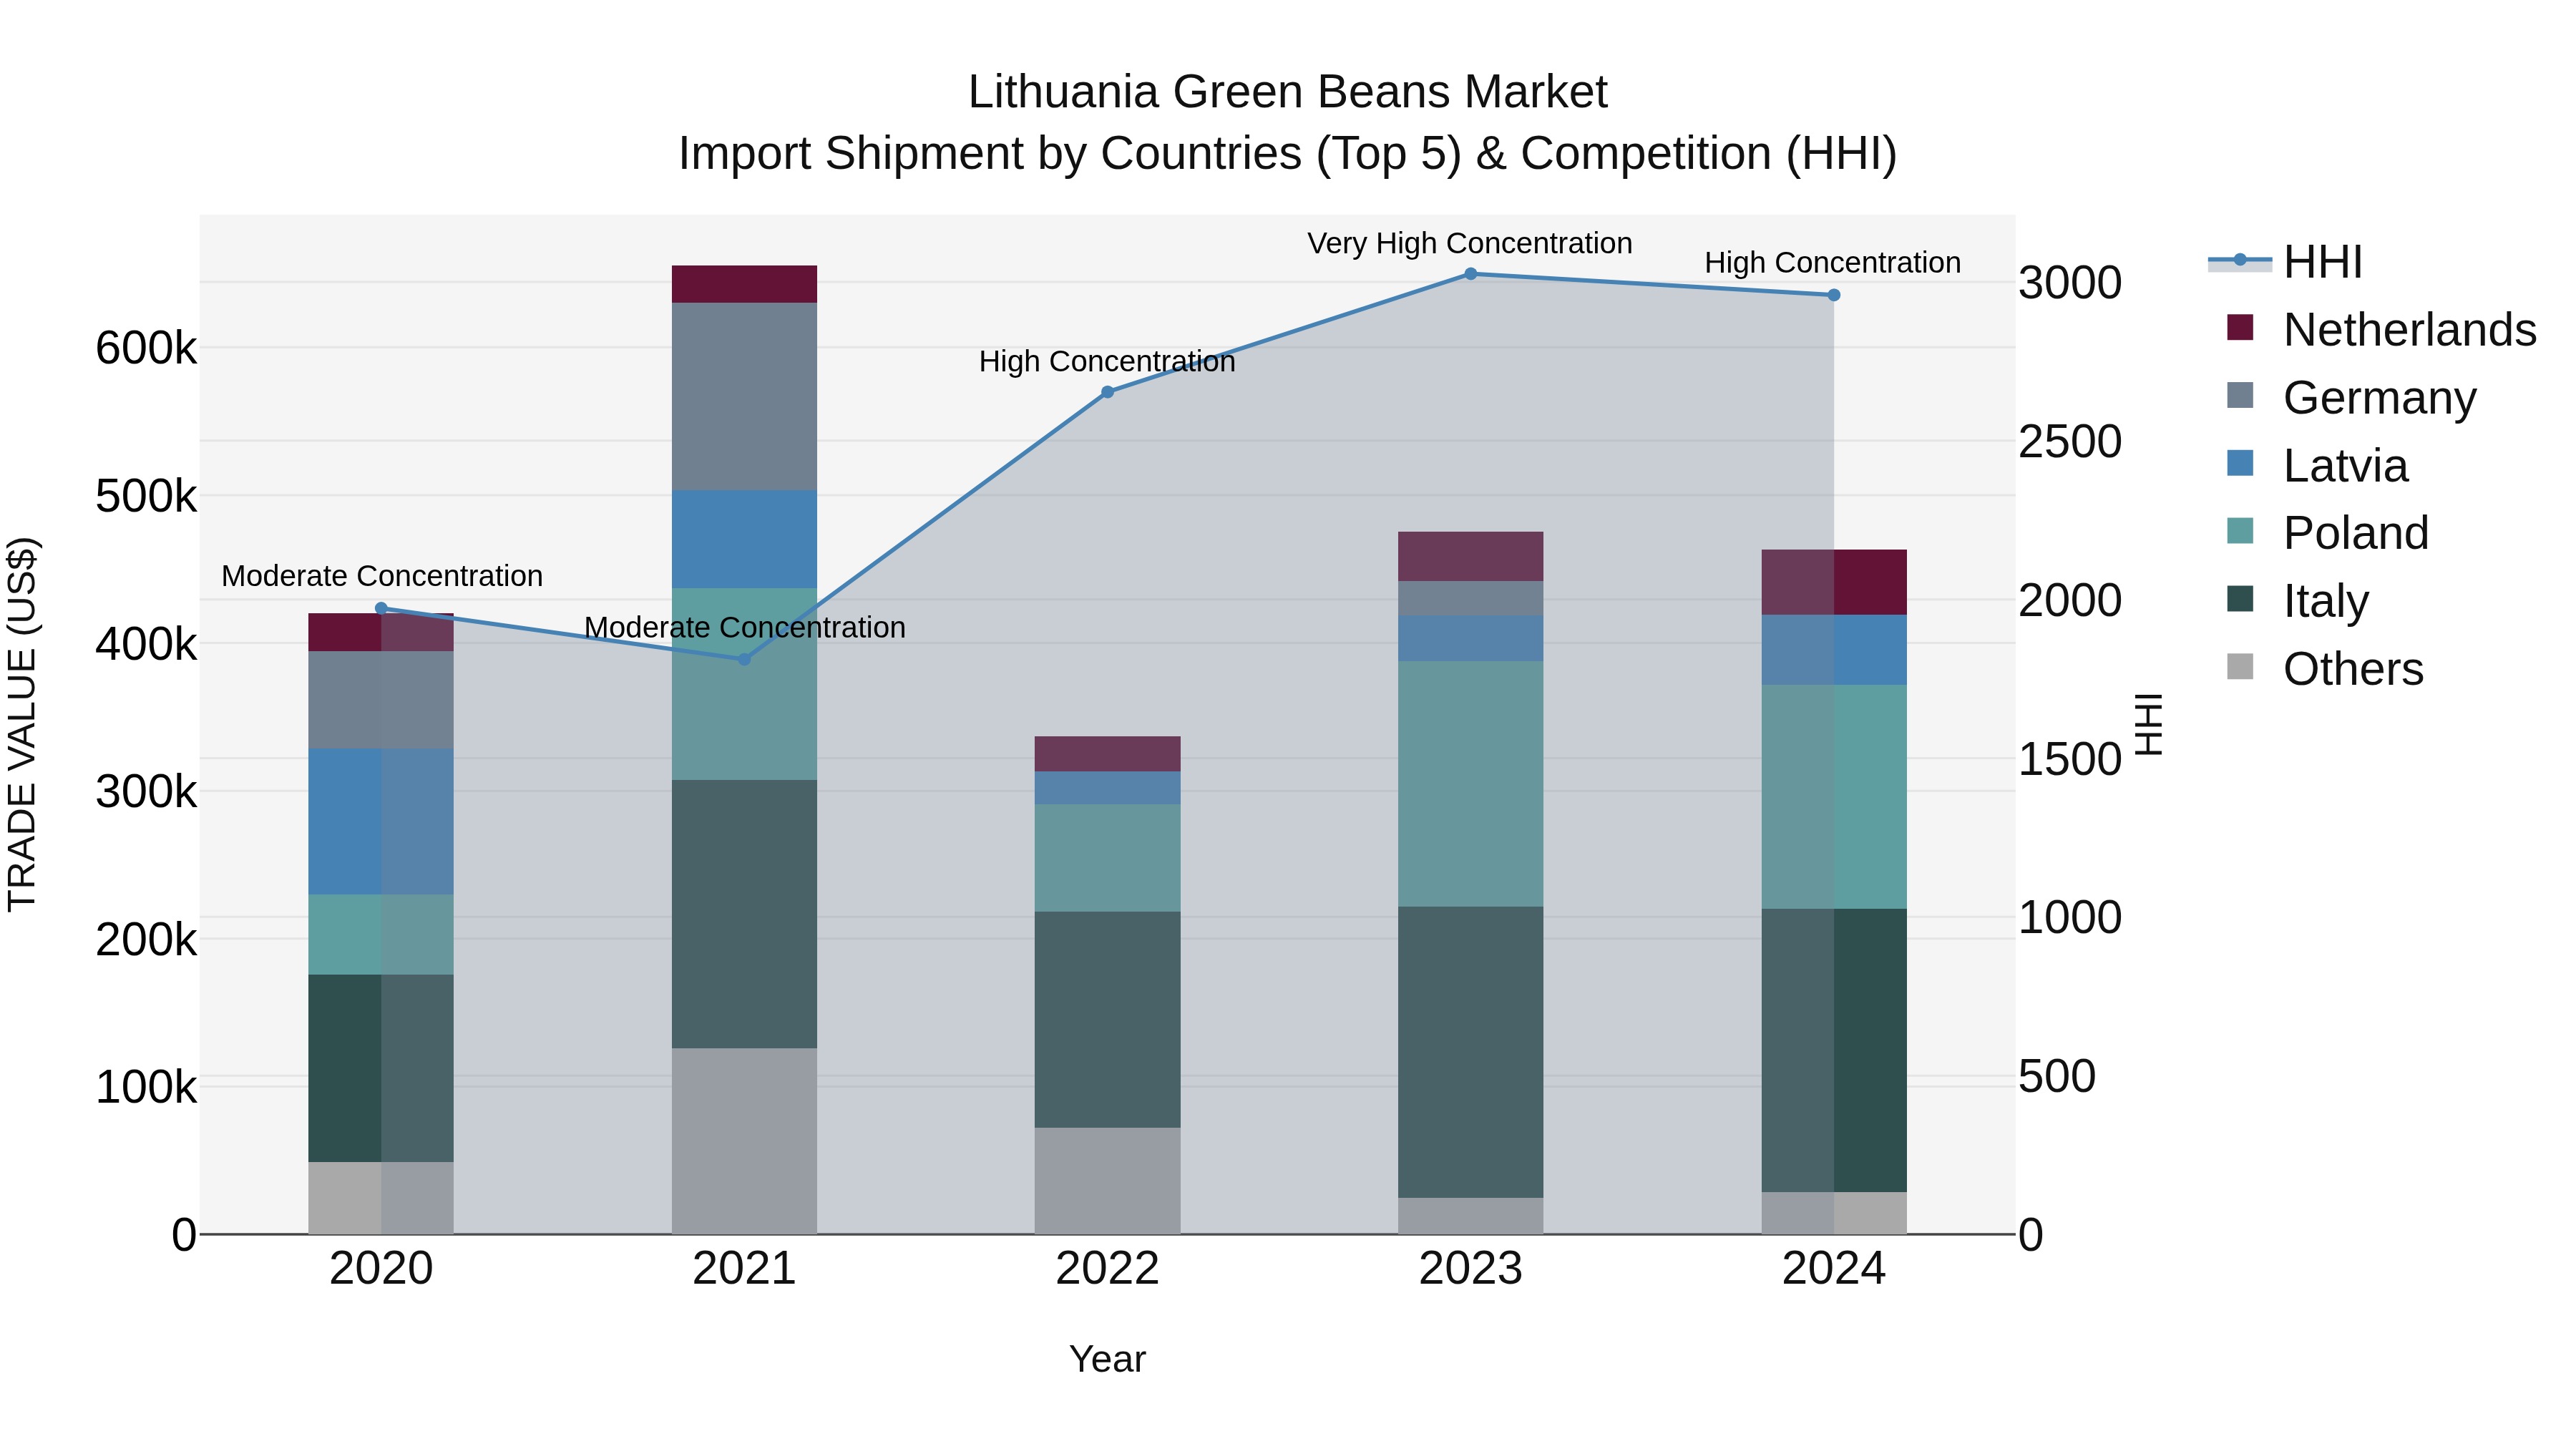
Lithuania Green Beans Market Top 5 Importing Countries and Market Competition (HHI) Analysis
The import market for green beans in Lithuania saw steady growth with a CAGR of 2.46% from 2020 to 2024, although a slight decline of -2.6% was observed from 2023 to 2024. The top exporting countries to Lithuania in 2024 include Italy, Poland, Latvia, Netherlands, and Belgium. Despite a decrease in the growth rate, the market concentration remained high in 2024, indicating a competitive landscape for green bean imports in Lithuania. It will be interesting to monitor how these trends evolve in the coming years.
Key Highlights of the Report:
- Lithuania Green Beans Market Outlook
- Market Size of Lithuania Green Beans Market, 2025
- Forecast of Lithuania Green Beans Market, 2032
- Historical Data and Forecast of Lithuania Green Beans Revenues & Volume for the Period 2022 - 2032
- Lithuania Green Beans Market Trend Evolution
- Lithuania Green Beans Market Drivers and Challenges
- Lithuania Green Beans Price Trends
- Lithuania Green Beans Porter's Five Forces
- Lithuania Green Beans Industry Life Cycle
- Historical Data and Forecast of Lithuania Green Beans Market Revenues & Volume By Product Type for the Period 2022 - 2032
- Historical Data and Forecast of Lithuania Green Beans Market Revenues & Volume By Green Bean Granules for the Period 2022 - 2032
- Historical Data and Forecast of Lithuania Green Beans Market Revenues & Volume By Green Bean Powder for the Period 2022 - 2032
- Historical Data and Forecast of Lithuania Green Beans Market Revenues & Volume By Application for the Period 2022 - 2032
- Historical Data and Forecast of Lithuania Green Beans Market Revenues & Volume By Snacks and Savouries for the Period 2022 - 2032
- Historical Data and Forecast of Lithuania Green Beans Market Revenues & Volume By Infant Food for the Period 2022 - 2032
- Historical Data and Forecast of Lithuania Green Beans Market Revenues & Volume By Soups for the Period 2022 - 2032
- Historical Data and Forecast of Lithuania Green Beans Market Revenues & Volume By Sauces and Dressings for the Period 2022 - 2032
- Historical Data and Forecast of Lithuania Green Beans Market Revenues & Volume By Animal Feeds for the Period 2022 - 2032
- Historical Data and Forecast of Lithuania Green Beans Market Revenues & Volume By Market Retail for the Period 2022 - 2032
- Historical Data and Forecast of Lithuania Green Beans Market Revenues & Volume By Others for the Period 2022 - 2032
- Historical Data and Forecast of Lithuania Green Beans Market Revenues & Volume By Packaging Type for the Period 2022 - 2032
- Historical Data and Forecast of Lithuania Green Beans Market Revenues & Volume By Plastic Bags for the Period 2022 - 2032
- Historical Data and Forecast of Lithuania Green Beans Market Revenues & Volume By Cans for the Period 2022 - 2032
- Historical Data and Forecast of Lithuania Green Beans Market Revenues & Volume By Jars for the Period 2022 - 2032
- Historical Data and Forecast of Lithuania Green Beans Market Revenues & Volume By Others for the Period 2022 - 2032
- Historical Data and Forecast of Lithuania Green Beans Market Revenues & Volume By End Users for the Period 2022 - 2032
- Historical Data and Forecast of Lithuania Green Beans Market Revenues & Volume By Households for the Period 2022 - 2032
- Historical Data and Forecast of Lithuania Green Beans Market Revenues & Volume By Restaurants and Hotels for the Period 2022 - 2032
- Historical Data and Forecast of Lithuania Green Beans Market Revenues & Volume By Flour Industry for the Period 2022 - 2032
- Historical Data and Forecast of Lithuania Green Beans Market Revenues & Volume By Others for the Period 2022 - 2032
- Historical Data and Forecast of Lithuania Green Beans Market Revenues & Volume By Distribution Channel for the Period 2022 - 2032
- Historical Data and Forecast of Lithuania Green Beans Market Revenues & Volume By Departmental Stores for the Period 2022 - 2032
- Historical Data and Forecast of Lithuania Green Beans Market Revenues & Volume By Supermarkets for the Period 2022 - 2032
- Historical Data and Forecast of Lithuania Green Beans Market Revenues & Volume By Specialty Stores for the Period 2022 - 2032
- Historical Data and Forecast of Lithuania Green Beans Market Revenues & Volume By Conveniences Store for the Period 2022 - 2032
- Historical Data and Forecast of Lithuania Green Beans Market Revenues & Volume By Online Stores for the Period 2022 - 2032
- Historical Data and Forecast of Lithuania Green Beans Market Revenues & Volume By Others for the Period 2022 - 2032
- Lithuania Green Beans Import Export Trade Statistics
- Market Opportunity Assessment By Product Type
- Market Opportunity Assessment By Application
- Market Opportunity Assessment By Packaging Type
- Market Opportunity Assessment By End Users
- Market Opportunity Assessment By Distribution Channel
- Lithuania Green Beans Top Companies Market Share
- Lithuania Green Beans Competitive Benchmarking By Technical and Operational Parameters
- Lithuania Green Beans Company Profiles
- Lithuania Green Beans Key Strategic Recommendations
Frequently Asked Questions About the Market Study (FAQs):
6Wresearch actively monitors the Lithuania Green Beans Market and publishes its comprehensive annual report, highlighting emerging trends, growth drivers, revenue analysis, and forecast outlook. Our insights help businesses to make data-backed strategic decisions with ongoing market dynamics. Our analysts track relevent industries related to the Lithuania Green Beans Market, allowing our clients with actionable intelligence and reliable forecasts tailored to emerging regional needs.
Yes, we provide customisation as per your requirements. To learn more, feel free to contact us on sales@6wresearch.com
1 Executive Summary |
2 Introduction |
2.1 Key Highlights of the Report |
2.2 Report Description |
2.3 Market Scope & Segmentation |
2.4 Research Methodology |
2.5 Assumptions |
3 Lithuania Green Beans Market Overview |
3.1 Lithuania Country Macro Economic Indicators |
3.2 Lithuania Green Beans Market Revenues & Volume, 2022 & 2032F |
3.3 Lithuania Green Beans Market - Industry Life Cycle |
3.4 Lithuania Green Beans Market - Porter's Five Forces |
3.5 Lithuania Green Beans Market Revenues & Volume Share, By Product Type, 2022 & 2032F |
3.6 Lithuania Green Beans Market Revenues & Volume Share, By Application, 2022 & 2032F |
3.7 Lithuania Green Beans Market Revenues & Volume Share, By Packaging Type, 2022 & 2032F |
3.8 Lithuania Green Beans Market Revenues & Volume Share, By End Users, 2022 & 2032F |
3.9 Lithuania Green Beans Market Revenues & Volume Share, By Distribution Channel, 2022 & 2032F |
4 Lithuania Green Beans Market Dynamics |
4.1 Impact Analysis |
4.2 Market Drivers |
4.2.1 Increasing consumer awareness and demand for organic and sustainable food products |
4.2.2 Growing focus on healthy eating habits and plant-based diets |
4.2.3 Government initiatives and support towards promoting agriculture and exports |
4.3 Market Restraints |
4.3.1 Seasonality of green beans production leading to supply fluctuations |
4.3.2 Price volatility due to factors like weather conditions and transportation costs |
5 Lithuania Green Beans Market Trends |
6 Lithuania Green Beans Market, By Types |
6.1 Lithuania Green Beans Market, By Product Type |
6.1.1 Overview and Analysis |
6.1.2 Lithuania Green Beans Market Revenues & Volume, By Product Type, 2022 - 2032F |
6.1.3 Lithuania Green Beans Market Revenues & Volume, By Green Bean Granules, 2022 - 2032F |
6.1.4 Lithuania Green Beans Market Revenues & Volume, By Green Bean Powder, 2022 - 2032F |
6.2 Lithuania Green Beans Market, By Application |
6.2.1 Overview and Analysis |
6.2.2 Lithuania Green Beans Market Revenues & Volume, By Snacks and Savouries, 2022 - 2032F |
6.2.3 Lithuania Green Beans Market Revenues & Volume, By Infant Food, 2022 - 2032F |
6.2.4 Lithuania Green Beans Market Revenues & Volume, By Soups, 2022 - 2032F |
6.2.5 Lithuania Green Beans Market Revenues & Volume, By Sauces and Dressings, 2022 - 2032F |
6.2.6 Lithuania Green Beans Market Revenues & Volume, By Animal Feeds, 2022 - 2032F |
6.2.7 Lithuania Green Beans Market Revenues & Volume, By Market Retail, 2022 - 2032F |
6.3 Lithuania Green Beans Market, By Packaging Type |
6.3.1 Overview and Analysis |
6.3.2 Lithuania Green Beans Market Revenues & Volume, By Plastic Bags, 2022 - 2032F |
6.3.3 Lithuania Green Beans Market Revenues & Volume, By Cans, 2022 - 2032F |
6.3.4 Lithuania Green Beans Market Revenues & Volume, By Jars, 2022 - 2032F |
6.3.5 Lithuania Green Beans Market Revenues & Volume, By Others, 2022 - 2032F |
6.4 Lithuania Green Beans Market, By End Users |
6.4.1 Overview and Analysis |
6.4.2 Lithuania Green Beans Market Revenues & Volume, By Households, 2022 - 2032F |
6.4.3 Lithuania Green Beans Market Revenues & Volume, By Restaurants and Hotels, 2022 - 2032F |
6.4.4 Lithuania Green Beans Market Revenues & Volume, By Flour Industry, 2022 - 2032F |
6.4.5 Lithuania Green Beans Market Revenues & Volume, By Others, 2022 - 2032F |
6.5 Lithuania Green Beans Market, By Distribution Channel |
6.5.1 Overview and Analysis |
6.5.2 Lithuania Green Beans Market Revenues & Volume, By Departmental Stores, 2022 - 2032F |
6.5.3 Lithuania Green Beans Market Revenues & Volume, By Supermarkets, 2022 - 2032F |
6.5.4 Lithuania Green Beans Market Revenues & Volume, By Specialty Stores, 2022 - 2032F |
6.5.5 Lithuania Green Beans Market Revenues & Volume, By Conveniences Store, 2022 - 2032F |
6.5.6 Lithuania Green Beans Market Revenues & Volume, By Online Stores, 2022 - 2032F |
6.5.7 Lithuania Green Beans Market Revenues & Volume, By Others, 2022 - 2032F |
7 Lithuania Green Beans Market Import-Export Trade Statistics |
7.1 Lithuania Green Beans Market Export to Major Countries |
7.2 Lithuania Green Beans Market Imports from Major Countries |
8 Lithuania Green Beans Market Key Performance Indicators |
8.1 Average yield per acre of green beans |
8.2 Adoption rate of sustainable farming practices among green beans farmers |
8.3 Percentage of green beans exports meeting quality standards |
8.4 Consumer perception and awareness of green beans as a healthy food option |
8.5 Number of new green beans farming initiatives supported by government incentives |
9 Lithuania Green Beans Market - Opportunity Assessment |
9.1 Lithuania Green Beans Market Opportunity Assessment, By Product Type, 2022 & 2032F |
9.2 Lithuania Green Beans Market Opportunity Assessment, By Application, 2022 & 2032F |
9.3 Lithuania Green Beans Market Opportunity Assessment, By Packaging Type, 2022 & 2032F |
9.4 Lithuania Green Beans Market Opportunity Assessment, By End Users, 2022 & 2032F |
9.5 Lithuania Green Beans Market Opportunity Assessment, By Distribution Channel, 2022 & 2032F |
10 Lithuania Green Beans Market - Competitive Landscape |
10.1 Lithuania Green Beans Market Revenue Share, By Companies, 2025 |
10.2 Lithuania Green Beans Market Competitive Benchmarking, By Operating and Technical Parameters |
11 Company Profiles |
12 Recommendations |
13 Disclaimer |
Global Go To Market Strategy - 2030
Export potential enables firms to identify high-growth global markets with greater confidence by combining advanced trade intelligence with a structured quantitative methodology. The framework analyzes emerging demand trends and country-level import patterns while integrating macroeconomic and trade datasets such as GDP and population forecasts, bilateral import–export flows, tariff structures, elasticity differentials between developed and developing economies, geographic distance, and import demand projections. Using weighted trade values from 2020–2024 as the base period to project country-to-country export potential for 2030, these inputs are operationalized through calculated drivers such as gravity model parameters, tariff impact factors, and projected GDP per-capita growth. Through an analysis of hidden potentials, demand hotspots, and market conditions that are most favorable to success, this method enables firms to focus on target countries, maximize returns, and global expansion with data, backed by accuracy.
By factoring in the projected importer demand gap that is currently unmet and could be potential opportunity, it identifies the potential for the Exporter (Country) among 190 countries, against the general trade analysis, which identifies the biggest importer or exporter.
To discover high-growth global markets and optimize your business strategy:
Click Here
Pricing
- Single User License$ 1,995
- Department License$ 2,400
- Site License$ 3,120
- Global License$ 3,795

Leadership Perspectives from Industry Events
Search
Thought Leadership and Analyst Meet


Our Clients
6WResearch In News
- Doha a strategic location for EV manufacturing hub: IPA Qatar
- Demand for luxury TVs surging in the GCC, says Samsung
- Empowering Growth: The Thriving Journey of Bangladesh’s Cable Industry
- Demand for luxury TVs surging in the GCC, says Samsung
- Video call with a traditional healer? Once unthinkable, it’s now common in South Africa
- Intelligent Buildings To Smooth GCC’s Path To Net Zero
Latest Reports
- New Zealand Aseptic Manufacturing Market (2026-2032)
- Netherlands Aseptic Manufacturing Market (2026-2032)
- Nauru Aseptic Manufacturing Market (2026-2032)
- Namibia Aseptic Manufacturing Market (2026-2032)
- Mozambique Aseptic Manufacturing Market (2026-2032)
- Montenegro Aseptic Manufacturing Market (2026-2032)
- Mongolia Aseptic Manufacturing Market (2026-2032)
- Monaco Aseptic Manufacturing Market (2026-2032)
- Micronesia Aseptic Manufacturing Market (2026-2032)
- Mauritius Aseptic Manufacturing Market (2026-2032)
Industry Events and Analyst Meet

HIMTEX 2026

India Refining Summit 2026

India EV Show 2026

EV tech India Expo 2026

Auto Tech Asia 2026
Whitepaper
- Middle East & Africa Commercial Security Market Click here to view more.
- Middle East & Africa Fire Safety Systems & Equipment Market Click here to view more.
- GCC Drone Market Click here to view more.
- Middle East Lighting Fixture Market Click here to view more.
- GCC Physical & Perimeter Security Market Click here to view more.