Lithuania Hair Colorants Market (2026-2032) | Industry, Investment Trends, Companies, Forecast, Value, Competition, Drivers, Share, Segmentation, Consumer Insights, Trends, Analysis, Supply, Restraints, Opportunities, Outlook, Challenges, Strategy, Competitive, Demand, Segments, Size, Revenue, Pricing Analysis, Strategic Insights, Growth
Market Forecast By Type (Permanent, Semi-Permanent, Temporary), By Form (Gel, Foam, Powder), By Application (Salon Use, Home Use, Fashion Coloring), By Age Group (Adults, Teens, Elderly), By Distribution Channel (Beauty Stores, Online Stores, Pharmacies) And Competitive Landscape
| Product Code: ETC12405498 | Publication Date: Apr 2025 | Updated Date: Apr 2026 | Product Type: Market Research Report | |
| Publisher: 6Wresearch | No. of Pages: 65 | No. of Figures: 34 | No. of Tables: 19 | |
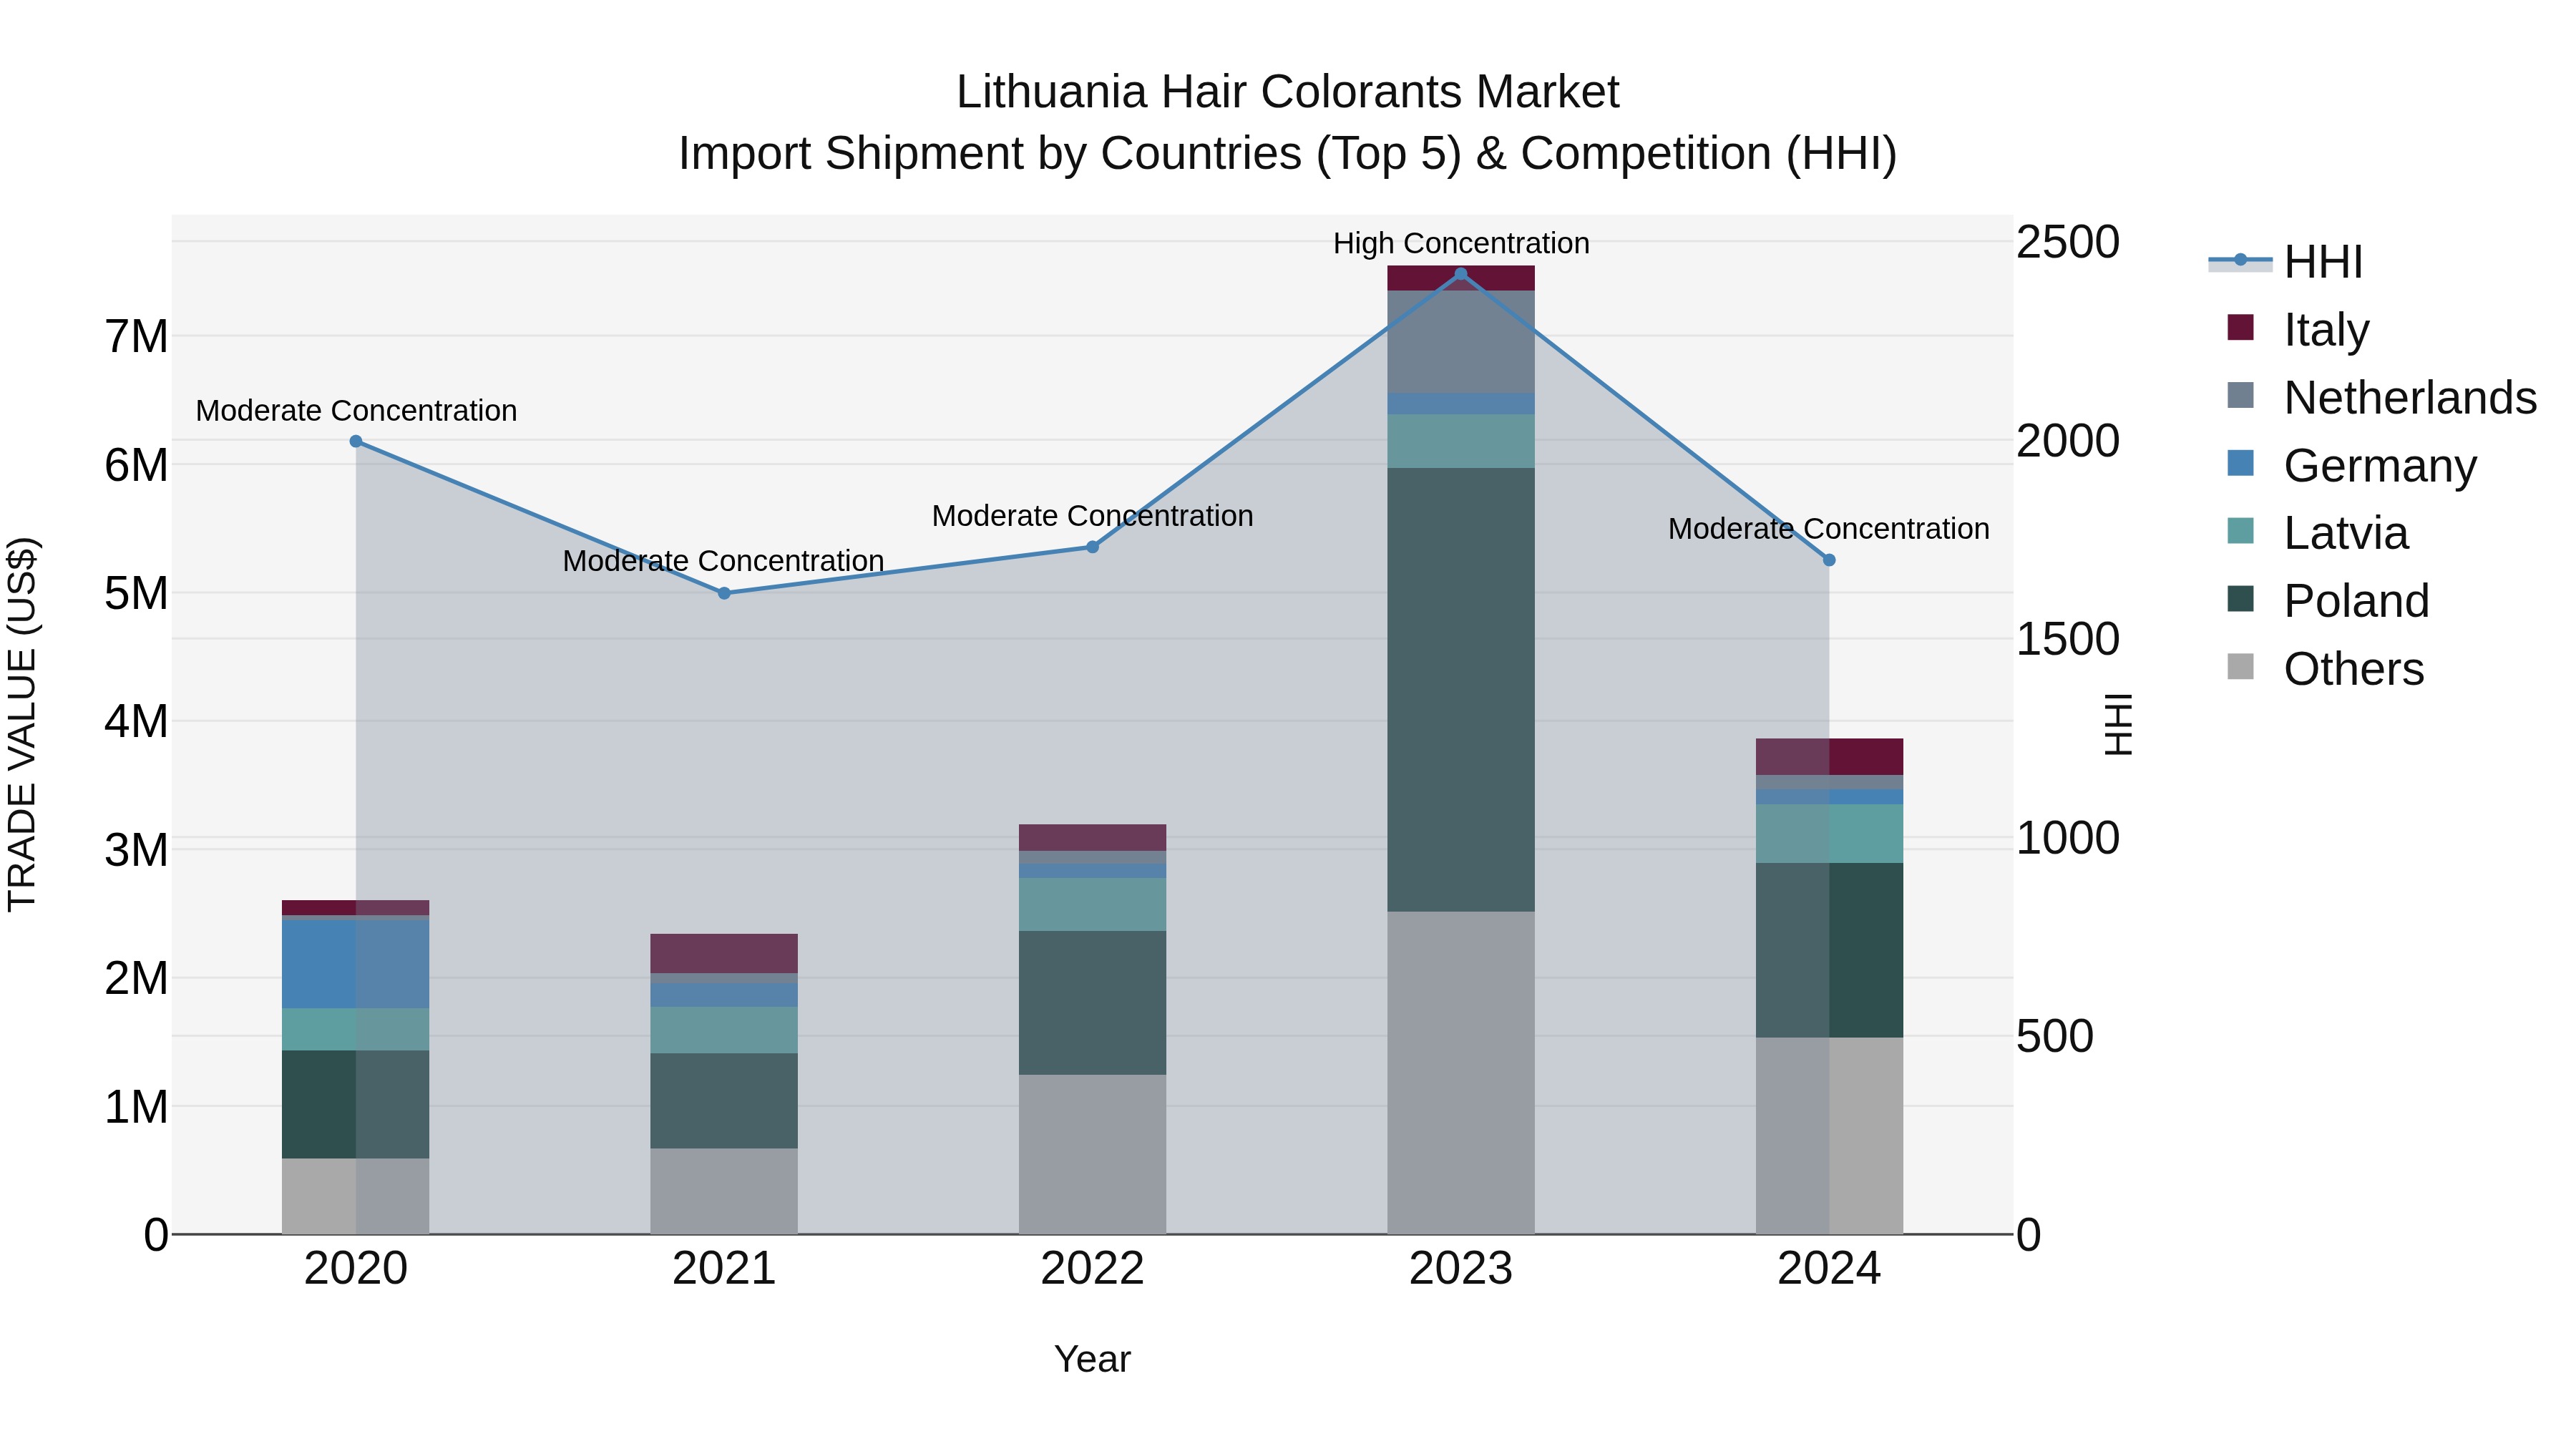
Lithuania Hair Colorants Market Top 5 Importing Countries and Market Competition (HHI) Analysis
In 2024, Lithuania witnessed a significant shift in hair colorants import trends, with top exporters including Poland, Latvia, Czechia, USA, and Italy. The market showed a notable decrease in concentration levels, transitioning from high concentration in 2023 to moderate concentration in 2024. Despite a negative growth rate of -48.78% in 2024, the compound annual growth rate (CAGR) for the period 2020-2024 stood at a promising 10.38%. This suggests a dynamic and evolving market landscape for hair colorants in Lithuania, with potential opportunities for both domestic and international suppliers.
Key Highlights of the Report:
- Lithuania Hair Colorants Market Outlook
- Market Size of Lithuania Hair Colorants Market, 2025
- Forecast of Lithuania Hair Colorants Market, 2032
- Historical Data and Forecast of Lithuania Hair Colorants Revenues & Volume for the Period 2022 - 2032F
- Lithuania Hair Colorants Market Trend Evolution
- Lithuania Hair Colorants Market Drivers and Challenges
- Lithuania Hair Colorants Price Trends
- Lithuania Hair Colorants Porter's Five Forces
- Lithuania Hair Colorants Industry Life Cycle
- Historical Data and Forecast of Lithuania Hair Colorants Market Revenues & Volume By Type for the Period 2022 - 2032F
- Historical Data and Forecast of Lithuania Hair Colorants Market Revenues & Volume By Permanent for the Period 2022 - 2032F
- Historical Data and Forecast of Lithuania Hair Colorants Market Revenues & Volume By Semi-Permanent for the Period 2022 - 2032F
- Historical Data and Forecast of Lithuania Hair Colorants Market Revenues & Volume By Temporary for the Period 2022 - 2032F
- Historical Data and Forecast of Lithuania Hair Colorants Market Revenues & Volume By Form for the Period 2022 - 2032F
- Historical Data and Forecast of Lithuania Hair Colorants Market Revenues & Volume By Gel for the Period 2022 - 2032F
- Historical Data and Forecast of Lithuania Hair Colorants Market Revenues & Volume By Foam for the Period 2022 - 2032F
- Historical Data and Forecast of Lithuania Hair Colorants Market Revenues & Volume By Powder for the Period 2022 - 2032F
- Historical Data and Forecast of Lithuania Hair Colorants Market Revenues & Volume By Application for the Period 2022 - 2032F
- Historical Data and Forecast of Lithuania Hair Colorants Market Revenues & Volume By Salon Use for the Period 2022 - 2032F
- Historical Data and Forecast of Lithuania Hair Colorants Market Revenues & Volume By Home Use for the Period 2022 - 2032F
- Historical Data and Forecast of Lithuania Hair Colorants Market Revenues & Volume By Fashion Coloring for the Period 2022 - 2032F
- Historical Data and Forecast of Lithuania Hair Colorants Market Revenues & Volume By Age Group for the Period 2022 - 2032F
- Historical Data and Forecast of Lithuania Hair Colorants Market Revenues & Volume By Adults for the Period 2022 - 2032F
- Historical Data and Forecast of Lithuania Hair Colorants Market Revenues & Volume By Teens for the Period 2022 - 2032F
- Historical Data and Forecast of Lithuania Hair Colorants Market Revenues & Volume By Elderly for the Period 2022 - 2032F
- Historical Data and Forecast of Lithuania Hair Colorants Market Revenues & Volume By Distribution Channel for the Period 2022 - 2032F
- Historical Data and Forecast of Lithuania Hair Colorants Market Revenues & Volume By Beauty Stores for the Period 2022 - 2032F
- Historical Data and Forecast of Lithuania Hair Colorants Market Revenues & Volume By Online Stores for the Period 2022 - 2032F
- Historical Data and Forecast of Lithuania Hair Colorants Market Revenues & Volume By Pharmacies for the Period 2022 - 2032F
- Lithuania Hair Colorants Import Export Trade Statistics
- Market Opportunity Assessment By Type
- Market Opportunity Assessment By Form
- Market Opportunity Assessment By Application
- Market Opportunity Assessment By Age Group
- Market Opportunity Assessment By Distribution Channel
- Lithuania Hair Colorants Top Companies Market Share
- Lithuania Hair Colorants Competitive Benchmarking By Technical and Operational Parameters
- Lithuania Hair Colorants Company Profiles
- Lithuania Hair Colorants Key Strategic Recommendations
Frequently Asked Questions About the Market Study (FAQs):
6Wresearch actively monitors the Lithuania Hair Colorants Market and publishes its comprehensive annual report, highlighting emerging trends, growth drivers, revenue analysis, and forecast outlook. Our insights help businesses to make data-backed strategic decisions with ongoing market dynamics. Our analysts track relevent industries related to the Lithuania Hair Colorants Market, allowing our clients with actionable intelligence and reliable forecasts tailored to emerging regional needs.
Yes, we provide customisation as per your requirements. To learn more, feel free to contact us on sales@6wresearch.com
1 Executive Summary |
2 Introduction |
2.1 Key Highlights of the Report |
2.2 Report Description |
2.3 Market Scope & Segmentation |
2.4 Research Methodology |
2.5 Assumptions |
3 Lithuania Hair Colorants Market Overview |
3.1 Lithuania Country Macro Economic Indicators |
3.2 Lithuania Hair Colorants Market Revenues & Volume, 2022 & 2032F |
3.3 Lithuania Hair Colorants Market - Industry Life Cycle |
3.4 Lithuania Hair Colorants Market - Porter's Five Forces |
3.5 Lithuania Hair Colorants Market Revenues & Volume Share, By Type, 2022 & 2032F |
3.6 Lithuania Hair Colorants Market Revenues & Volume Share, By Form, 2022 & 2032F |
3.7 Lithuania Hair Colorants Market Revenues & Volume Share, By Application, 2022 & 2032F |
3.8 Lithuania Hair Colorants Market Revenues & Volume Share, By Age Group, 2022 & 2032F |
3.9 Lithuania Hair Colorants Market Revenues & Volume Share, By Distribution Channel, 2022 & 2032F |
4 Lithuania Hair Colorants Market Dynamics |
4.1 Impact Analysis |
4.2 Market Drivers |
4.2.1 Increasing disposable income of consumers in Lithuania leading to higher spending on personal care products including hair colorants. |
4.2.2 Growing trend of self-care and personal grooming among the population driving the demand for hair colorants. |
4.2.3 Innovation in product formulations, such as organic and natural ingredients, attracting more consumers towards hair colorants. |
4.3 Market Restraints |
4.3.1 Potential health concerns associated with the use of chemical-based hair colorants may deter some consumers from using these products. |
4.3.2 Competition from alternative hair coloring options like henna or hair dyes from neighboring countries impacting the market growth. |
4.3.3 Economic uncertainty or fluctuations in the market affecting consumer purchasing power and willingness to spend on non-essential products like hair colorants. |
5 Lithuania Hair Colorants Market Trends |
6 Lithuania Hair Colorants Market, By Types |
6.1 Lithuania Hair Colorants Market, By Type |
6.1.1 Overview and Analysis |
6.1.2 Lithuania Hair Colorants Market Revenues & Volume, By Type, 2022 - 2032F |
6.1.3 Lithuania Hair Colorants Market Revenues & Volume, By Permanent, 2022 - 2032F |
6.1.4 Lithuania Hair Colorants Market Revenues & Volume, By Semi-Permanent, 2022 - 2032F |
6.1.5 Lithuania Hair Colorants Market Revenues & Volume, By Temporary, 2022 - 2032F |
6.2 Lithuania Hair Colorants Market, By Form |
6.2.1 Overview and Analysis |
6.2.2 Lithuania Hair Colorants Market Revenues & Volume, By Gel, 2022 - 2032F |
6.2.3 Lithuania Hair Colorants Market Revenues & Volume, By Foam, 2022 - 2032F |
6.2.4 Lithuania Hair Colorants Market Revenues & Volume, By Powder, 2022 - 2032F |
6.3 Lithuania Hair Colorants Market, By Application |
6.3.1 Overview and Analysis |
6.3.2 Lithuania Hair Colorants Market Revenues & Volume, By Salon Use, 2022 - 2032F |
6.3.3 Lithuania Hair Colorants Market Revenues & Volume, By Home Use, 2022 - 2032F |
6.3.4 Lithuania Hair Colorants Market Revenues & Volume, By Fashion Coloring, 2022 - 2032F |
6.4 Lithuania Hair Colorants Market, By Age Group |
6.4.1 Overview and Analysis |
6.4.2 Lithuania Hair Colorants Market Revenues & Volume, By Adults, 2022 - 2032F |
6.4.3 Lithuania Hair Colorants Market Revenues & Volume, By Teens, 2022 - 2032F |
6.4.4 Lithuania Hair Colorants Market Revenues & Volume, By Elderly, 2022 - 2032F |
6.5 Lithuania Hair Colorants Market, By Distribution Channel |
6.5.1 Overview and Analysis |
6.5.2 Lithuania Hair Colorants Market Revenues & Volume, By Beauty Stores, 2022 - 2032F |
6.5.3 Lithuania Hair Colorants Market Revenues & Volume, By Online Stores, 2022 - 2032F |
6.5.4 Lithuania Hair Colorants Market Revenues & Volume, By Pharmacies, 2022 - 2032F |
7 Lithuania Hair Colorants Market Import-Export Trade Statistics |
7.1 Lithuania Hair Colorants Market Export to Major Countries |
7.2 Lithuania Hair Colorants Market Imports from Major Countries |
8 Lithuania Hair Colorants Market Key Performance Indicators |
8.1 Number of new product launches in the hair colorants market in Lithuania. |
8.2 Consumer awareness and interest in sustainable and natural hair colorant products. |
8.3 Percentage of repeat purchases or customer loyalty towards specific hair colorant brands in Lithuania. |
9 Lithuania Hair Colorants Market - Opportunity Assessment |
9.1 Lithuania Hair Colorants Market Opportunity Assessment, By Type, 2022 & 2032F |
9.2 Lithuania Hair Colorants Market Opportunity Assessment, By Form, 2022 & 2032F |
9.3 Lithuania Hair Colorants Market Opportunity Assessment, By Application, 2022 & 2032F |
9.4 Lithuania Hair Colorants Market Opportunity Assessment, By Age Group, 2022 & 2032F |
9.5 Lithuania Hair Colorants Market Opportunity Assessment, By Distribution Channel, 2022 & 2032F |
10 Lithuania Hair Colorants Market - Competitive Landscape |
10.1 Lithuania Hair Colorants Market Revenue Share, By Companies, 2025 |
10.2 Lithuania Hair Colorants Market Competitive Benchmarking, By Operating and Technical Parameters |
11 Company Profiles |
12 Recommendations |
13 Disclaimer |
Export potential assessment - trade Analytics for 2030
Export potential enables firms to identify high-growth global markets with greater confidence by combining advanced trade intelligence with a structured quantitative methodology. The framework analyzes emerging demand trends and country-level import patterns while integrating macroeconomic and trade datasets such as GDP and population forecasts, bilateral import–export flows, tariff structures, elasticity differentials between developed and developing economies, geographic distance, and import demand projections. Using weighted trade values from 2020–2024 as the base period to project country-to-country export potential for 2030, these inputs are operationalized through calculated drivers such as gravity model parameters, tariff impact factors, and projected GDP per-capita growth. Through an analysis of hidden potentials, demand hotspots, and market conditions that are most favorable to success, this method enables firms to focus on target countries, maximize returns, and global expansion with data, backed by accuracy.
By factoring in the projected importer demand gap that is currently unmet and could be potential opportunity, it identifies the potential for the Exporter (Country) among 190 countries, against the general trade analysis, which identifies the biggest importer or exporter.
To discover high-growth global markets and optimize your business strategy:
Click Here
Pricing
- Single User License$ 1,995
- Department License$ 2,400
- Site License$ 3,120
- Global License$ 3,795

Search
Thought Leadership and Analyst Meet


Our Clients
Latest Reports
- China Electric Appliance Rental Market (2026-2032) | Trends, Revenue, Growth, Challenges, Size, Value, Outlook, Pricing, Strategy, Insights, Restraints, segmentation, Companies, Investment Opportunities, Analysis, Demand, Drivers, Competition, Forecast, Share
- Chile Electric Appliance Rental Market (2026-2032) | Outlook, Competition, Drivers, Strategy, Revenue, Analysis, Value, Pricing, Restraints, Size, Demand, Share, Growth, Forecast, Challenges, Insights, Investment Opportunities, Companies, Trends, segmentation
- Cambodia Electric Appliance Rental Market (2026-2032) | Companies, Analysis, Restraints, Pricing, Insights, Challenges, Outlook, Strategy, Forecast, Trends, Competition, Value, Revenue, Investment Opportunities, segmentation, Drivers, Size, Demand, Growth, Share
- Brazil Electric Appliance Rental Market (2026-2032) | Revenue, Strategy, Forecast, Companies, segmentation, Competition, Size, Investment Opportunities, Pricing, Restraints, Outlook, Challenges, Analysis, Drivers, Value, Demand, Insights, Trends, Growth, Share
- Bangladesh Electric Appliance Rental Market (2026-2032) | Drivers, Forecast, Investment Opportunities, Strategy, Insights, Demand, Challenges, Outlook, Trends, Competition, Value, Revenue, Size, Pricing, Analysis, Companies, Restraints, segmentation, Share, Growth
- Bahrain Electric Appliance Rental Market (2026-2032) | Outlook, Size, Competition, Restraints, Drivers, Value, Trends, Investment Opportunities, Insights, Forecast, Revenue, Strategy, Growth, Share, Demand, Analysis, Challenges, Companies, segmentation, Pricing
- Azerbaijan Electric Appliance Rental Market (2026-2032) | Trends, Investment Opportunities, Restraints, Insights, Strategy, Competition, Value, Growth, Demand, Drivers, Analysis, Forecast, Size, Share, Outlook, segmentation, Pricing, Challenges, Revenue, Companies
- Australia Electric Appliance Rental Market (2026-2032) | Challenges, Restraints, Forecast, Demand, Size, Competition, Pricing, Investment Opportunities, Revenue, Trends, Drivers, Growth, Outlook, Analysis, Strategy, Value, segmentation, Insights, Companies, Share
- Argentina Electric Appliance Rental Market (2026-2032) | Growth, Trends, Insights, Outlook, Forecast, Size, Drivers, Analysis, Restraints, Challenges, Share, Revenue, Investment Opportunities, Strategy, Demand, Value, Companies, segmentation, Competition, Pricing
- Algeria Electric Appliance Rental Market (2026-2032) | Share, Size, Value, Strategy, Competition, Outlook, Challenges, Companies, Trends, Pricing, Insights, Forecast, Investment Opportunities, Revenue, Growth, Restraints, segmentation, Analysis, Demand, Drivers
Industry Events and Analyst Meet

HIMTEX 2026

India Refining Summit 2026

India EV Show 2026

EV tech India Expo 2026

Auto Tech Asia 2026
Whitepaper
- Middle East & Africa Commercial Security Market Click here to view more.
- Middle East & Africa Fire Safety Systems & Equipment Market Click here to view more.
- GCC Drone Market Click here to view more.
- Middle East Lighting Fixture Market Click here to view more.
- GCC Physical & Perimeter Security Market Click here to view more.
6WResearch In News
- Doha a strategic location for EV manufacturing hub: IPA Qatar
- Demand for luxury TVs surging in the GCC, says Samsung
- Empowering Growth: The Thriving Journey of Bangladesh’s Cable Industry
- Demand for luxury TVs surging in the GCC, says Samsung
- Video call with a traditional healer? Once unthinkable, it’s now common in South Africa
- Intelligent Buildings To Smooth GCC’s Path To Net Zero