Lithuania High Purity Pig Iron Market (2026-2032) | Industry, Companies, Outlook, Trends, Growth, Forecast, Competitive Landscape, Segmentation, Share, Size & Revenue, Analysis, Value
Market Forecast By Application (Energy, Industrial, Automotive & Transportation) And Competitive Landscape
| Product Code: ETC8042722 | Publication Date: Sep 2024 | Updated Date: Apr 2026 | Product Type: Market Research Report | |
| Publisher: 6Wresearch | Author: Dhaval Chaurasia | No. of Pages: 75 | No. of Figures: 35 | No. of Tables: 20 |
Lithuania High Purity Pig Iron Market Size (2020-2030)
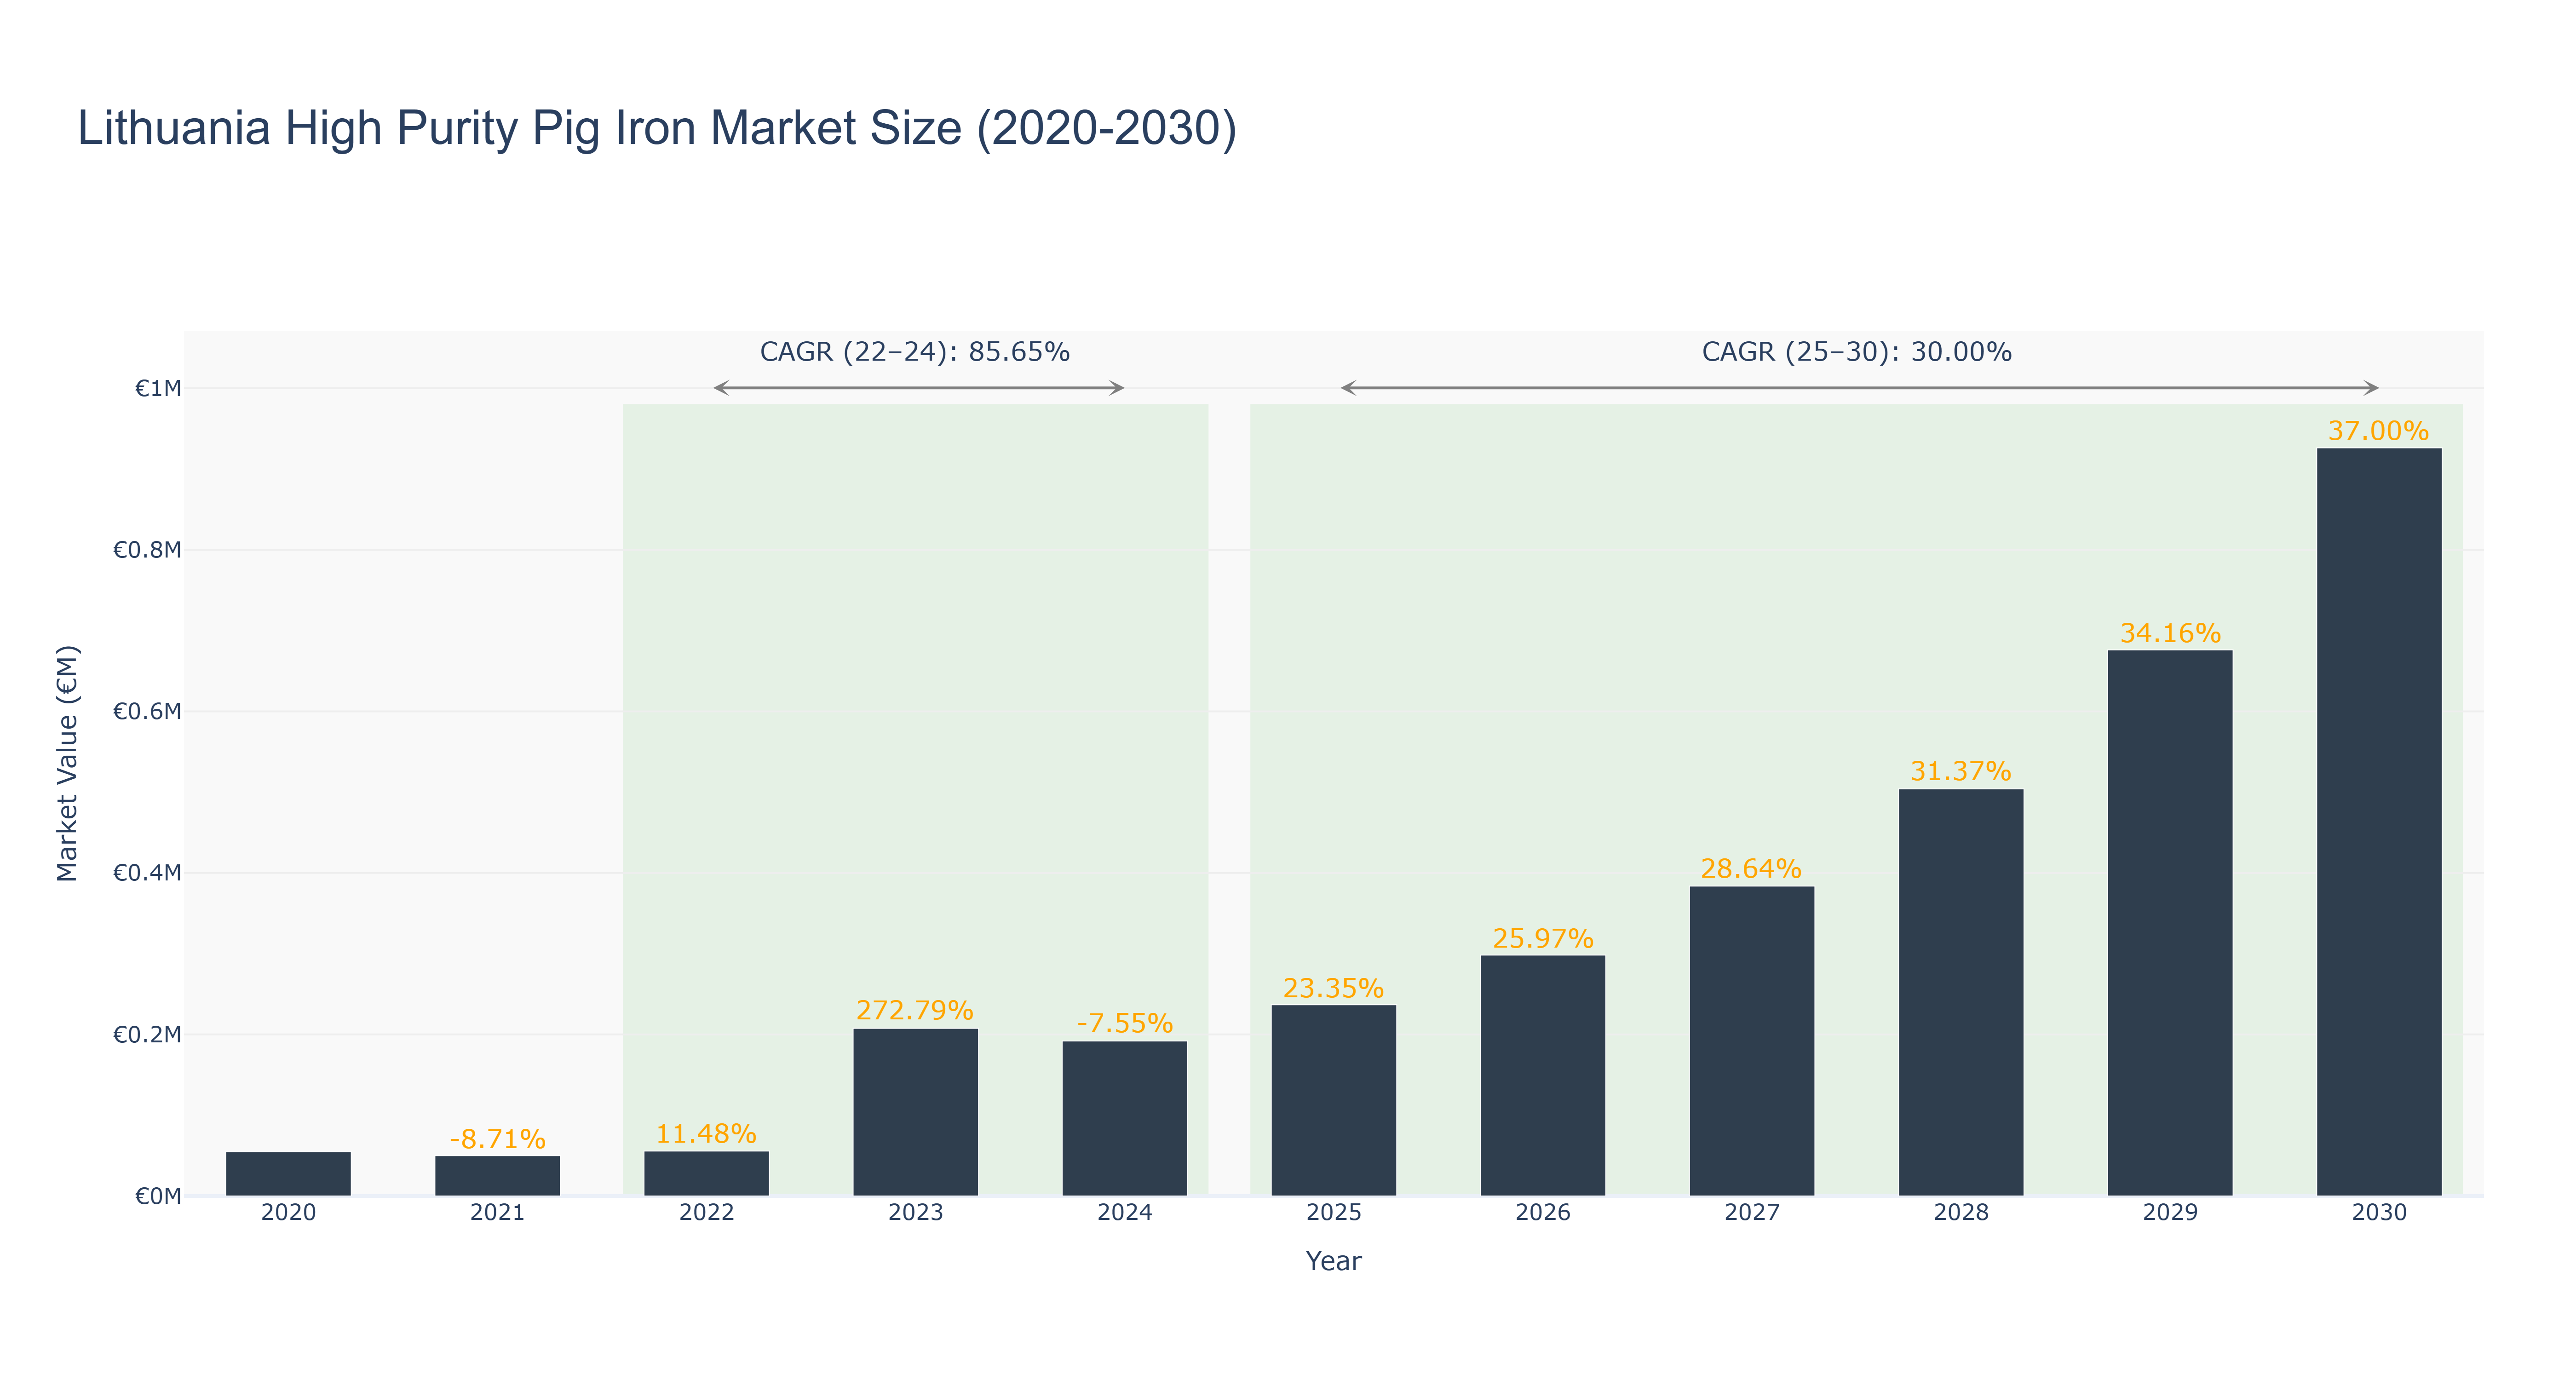
The Lithuania High Purity Pig Iron Market experienced significant fluctuations between 2020 and 2024, with a peak market size of €207.58 thousand in 2023, reflecting an extraordinary growth rate of 272.79%. Following a decline in 2021, the market rebounded in 2022, growing by 11.48%, before facing a slight contraction of 7.55% in 2024. The compound annual growth rate (CAGR) for the actual period from 2022 to 2024 stands at an impressive 85.65%. Looking ahead, the forecasted values from 2025 to 2030 indicate a robust growth trajectory, with projected market sizes reaching €926.34 thousand by 2030 and a CAGR of 30.00%. Factors driving this growth include increasing demand for high purity materials in various industrial applications and potential investments in production facilities. The ongoing emphasis on sustainable practices and advancements in metallurgical processes are likely to further support market expansion in the years to come.
Lithuania High Purity Pig Iron Market: Production & Trade Performance (2019-2025)
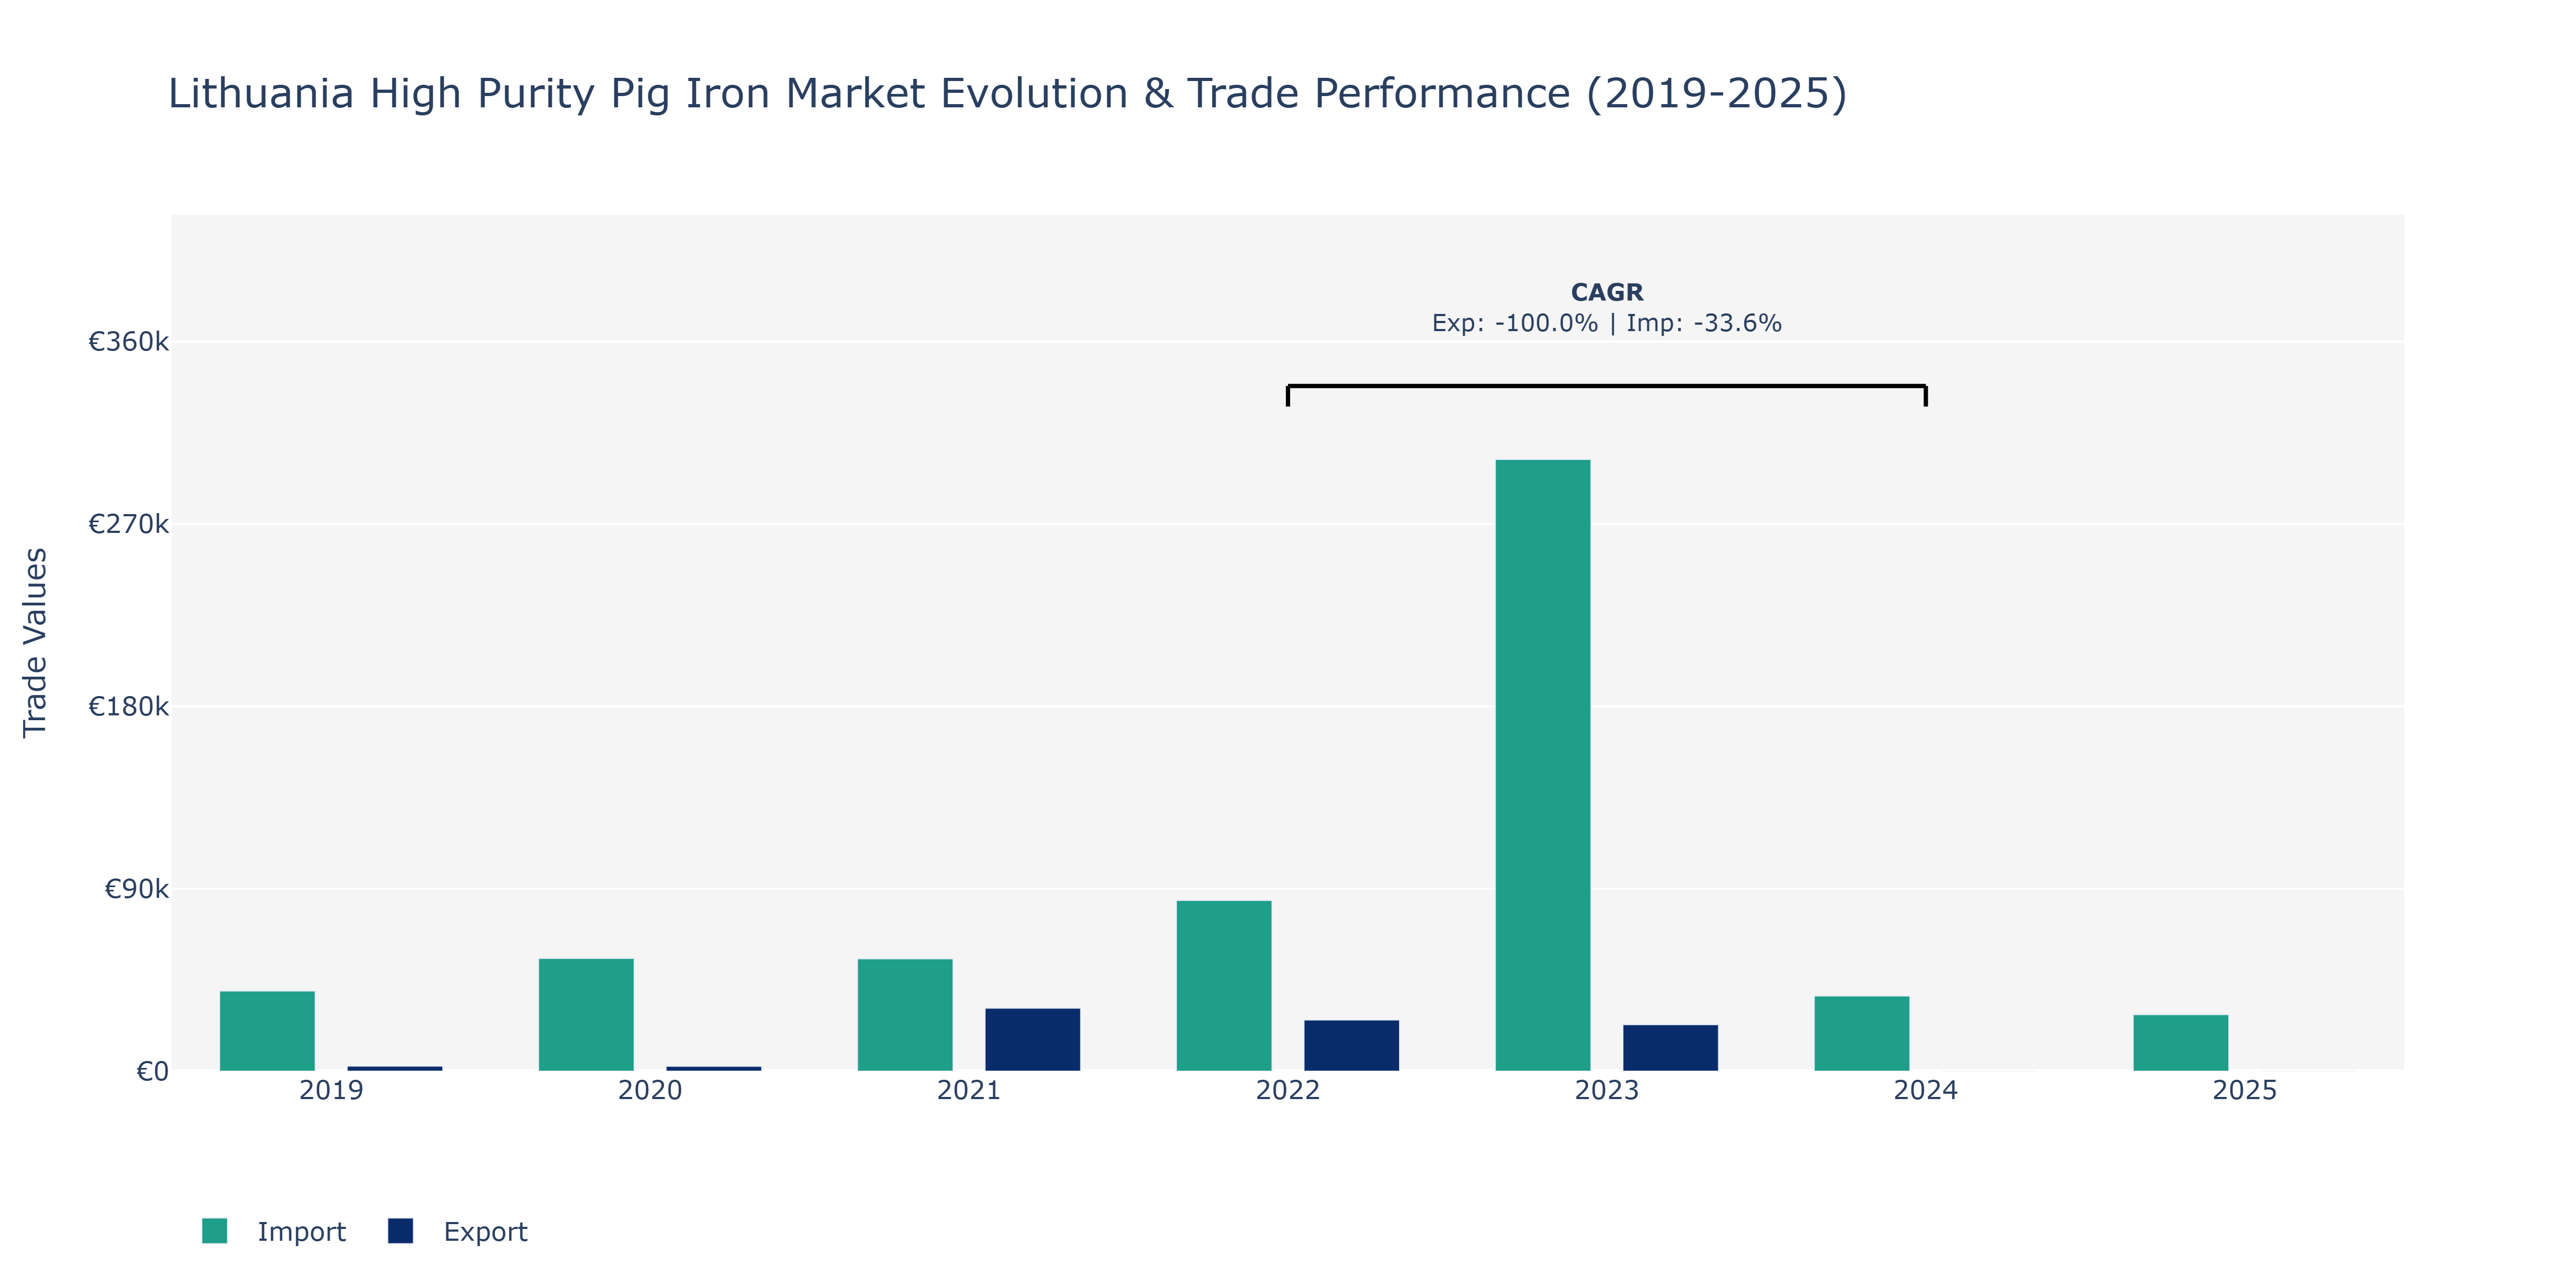
Between 2019 and 2025, Lithuania's High Purity Pig Iron Market saw varying trends in exports and imports. Exports experienced fluctuations, starting at €2.52 thousand in 2019, dropping to €2.44 thousand in 2020, then sharply increasing to €31.1 thousand in 2021 before decreasing to €25.26 thousand in 2022 and further to €22.99 thousand in 2023. No Export value was provided for 2024 and 2025. On the other hand, imports showed a consistent upward trajectory from €39.62 thousand in 2019 to €301.89 thousand in 2023. However, imports declined to €37.13 thousand in 2024 and €27.91 thousand in 2025. The sudden surge in 2023 imports could be attributed to increased demand for high-quality pig iron in Lithuania's manufacturing sector. The fluctuations in exports might be linked to global market demand shifts and domestic production capacity changes. This indicates the market's sensitivity to international trade dynamics and the need for strategic adaptation to maintain competitiveness.
Key Highlights of the Report:
- Lithuania High Purity Pig Iron Market Outlook
- Market Size of Lithuania High Purity Pig Iron Market, 2025
- Forecast of Lithuania High Purity Pig Iron Market, 2032
- Historical Data and Forecast of Lithuania High Purity Pig Iron Revenues & Volume for the Period 2022 - 2032
- Lithuania High Purity Pig Iron Market Trend Evolution
- Lithuania High Purity Pig Iron Market Drivers and Challenges
- Lithuania High Purity Pig Iron Price Trends
- Lithuania High Purity Pig Iron Porter's Five Forces
- Lithuania High Purity Pig Iron Industry Life Cycle
- Historical Data and Forecast of Lithuania High Purity Pig Iron Market Revenues & Volume By Application for the Period 2022 - 2032
- Historical Data and Forecast of Lithuania High Purity Pig Iron Market Revenues & Volume By Energy for the Period 2022 - 2032
- Historical Data and Forecast of Lithuania High Purity Pig Iron Market Revenues & Volume By Industrial for the Period 2022 - 2032
- Historical Data and Forecast of Lithuania High Purity Pig Iron Market Revenues & Volume By Automotive & Transportation for the Period 2022 - 2032
- Lithuania High Purity Pig Iron Import Export Trade Statistics
- Market Opportunity Assessment By Application
- Lithuania High Purity Pig Iron Top Companies Market Share
- Lithuania High Purity Pig Iron Competitive Benchmarking By Technical and Operational Parameters
- Lithuania High Purity Pig Iron Company Profiles
- Lithuania High Purity Pig Iron Key Strategic Recommendations
Frequently Asked Questions About the Market Study (FAQs):
6Wresearch actively monitors the Lithuania High Purity Pig Iron Market and publishes its comprehensive annual report, highlighting emerging trends, growth drivers, revenue analysis, and forecast outlook. Our insights help businesses to make data-backed strategic decisions with ongoing market dynamics. Our analysts track relevent industries related to the Lithuania High Purity Pig Iron Market, allowing our clients with actionable intelligence and reliable forecasts tailored to emerging regional needs.
Yes, we provide customisation as per your requirements. To learn more, feel free to contact us on sales@6wresearch.com
1 Executive Summary |
2 Introduction |
2.1 Key Highlights of the Report |
2.2 Report Description |
2.3 Market Scope & Segmentation |
2.4 Research Methodology |
2.5 Assumptions |
3 Lithuania High Purity Pig Iron Market Overview |
3.1 Lithuania Country Macro Economic Indicators |
3.2 Lithuania High Purity Pig Iron Market Revenues & Volume, 2022 & 2032F |
3.3 Lithuania High Purity Pig Iron Market - Industry Life Cycle |
3.4 Lithuania High Purity Pig Iron Market - Porter's Five Forces |
3.5 Lithuania High Purity Pig Iron Market Revenues & Volume Share, By Application, 2022 & 2032F |
4 Lithuania High Purity Pig Iron Market Dynamics |
4.1 Impact Analysis |
4.2 Market Drivers |
4.2.1 Increasing demand for high-quality pig iron in the steel industry |
4.2.2 Growing focus on environmentally friendly production processes |
4.2.3 Favorable government policies supporting the iron and steel sector |
4.3 Market Restraints |
4.3.1 Fluctuating prices of raw materials such as iron ore and coke |
4.3.2 Intense competition from other pig iron producers |
4.3.3 Volatility in global steel prices impacting the profitability of pig iron production |
5 Lithuania High Purity Pig Iron Market Trends |
6 Lithuania High Purity Pig Iron Market, By Types |
6.1 Lithuania High Purity Pig Iron Market, By Application |
6.1.1 Overview and Analysis |
6.1.2 Lithuania High Purity Pig Iron Market Revenues & Volume, By Application, 2022 - 2032F |
6.1.3 Lithuania High Purity Pig Iron Market Revenues & Volume, By Energy, 2022 - 2032F |
6.1.4 Lithuania High Purity Pig Iron Market Revenues & Volume, By Industrial, 2022 - 2032F |
6.1.5 Lithuania High Purity Pig Iron Market Revenues & Volume, By Automotive & Transportation, 2022 - 2032F |
7 Lithuania High Purity Pig Iron Market Import-Export Trade Statistics |
7.1 Lithuania High Purity Pig Iron Market Export to Major Countries |
7.2 Lithuania High Purity Pig Iron Market Imports from Major Countries |
8 Lithuania High Purity Pig Iron Market Key Performance Indicators |
8.1 Percentage of recycled materials used in pig iron production |
8.2 Energy efficiency metrics in pig iron manufacturing processes |
8.3 Number of new partnerships or collaborations with steel manufacturers for pig iron supply |
8.4 Research and development investment in innovative pig iron production technologies |
8.5 Employee training and development initiatives to enhance production efficiency and quality |
9 Lithuania High Purity Pig Iron Market - Opportunity Assessment |
9.1 Lithuania High Purity Pig Iron Market Opportunity Assessment, By Application, 2022 & 2032F |
10 Lithuania High Purity Pig Iron Market - Competitive Landscape |
10.1 Lithuania High Purity Pig Iron Market Revenue Share, By Companies, 2025 |
10.2 Lithuania High Purity Pig Iron Market Competitive Benchmarking, By Operating and Technical Parameters |
11 Company Profiles |
12 Recommendations |
13 Disclaimer |
Export potential assessment - trade Analytics for 2030
Export potential enables firms to identify high-growth global markets with greater confidence by combining advanced trade intelligence with a structured quantitative methodology. The framework analyzes emerging demand trends and country-level import patterns while integrating macroeconomic and trade datasets such as GDP and population forecasts, bilateral import–export flows, tariff structures, elasticity differentials between developed and developing economies, geographic distance, and import demand projections. Using weighted trade values from 2020–2024 as the base period to project country-to-country export potential for 2030, these inputs are operationalized through calculated drivers such as gravity model parameters, tariff impact factors, and projected GDP per-capita growth. Through an analysis of hidden potentials, demand hotspots, and market conditions that are most favorable to success, this method enables firms to focus on target countries, maximize returns, and global expansion with data, backed by accuracy.
By factoring in the projected importer demand gap that is currently unmet and could be potential opportunity, it identifies the potential for the Exporter (Country) among 190 countries, against the general trade analysis, which identifies the biggest importer or exporter.
To discover high-growth global markets and optimize your business strategy:
Click Here
Pricing
- Single User License$ 1,995
- Department License$ 2,400
- Site License$ 3,120
- Global License$ 3,795

Search
Thought Leadership and Analyst Meet


Our Clients
Latest Reports
- France Thermally Conductive Filler Dispersants Market (2026-2032) | Challenges, Restraints, Value, Share, Size, segmentation, Analysis, Trends, Investment Opportunities, Outlook, Pricing, Demand, Forecast, Revenue, Companies, Growth, Drivers, Strategy, Insights, Competition
- Egypt Thermally Conductive Filler Dispersants Market (2026-2032) | Competition, Forecast, Strategy, Value, Insights, Outlook, Investment Opportunities, Pricing, Demand, Share, segmentation, Drivers, Size, Companies, Restraints, Growth, Trends, Revenue, Challenges, Analysis
- Czech Republic Thermally Conductive Filler Dispersants Market (2026-2032) | Forecast, Pricing, Analysis, Drivers, Insights, Size, Demand, Growth, Challenges, segmentation, Competition, Outlook, Trends, Investment Opportunities, Companies, Strategy, Revenue, Share, Value, Restraints
- Colombia Thermally Conductive Filler Dispersants Market (2026-2032) | segmentation, Trends, Share, Drivers, Strategy, Companies, Demand, Insights, Size, Challenges, Value, Competition, Analysis, Growth, Revenue, Restraints, Forecast, Pricing, Outlook, Investment Opportunities
- China Thermally Conductive Filler Dispersants Market (2026-2032) | Restraints, Investment Opportunities, Pricing, Companies, Share, Size, Challenges, Trends, Outlook, Value, Analysis, Competition, Revenue, Drivers, Forecast, Demand, Insights, Growth, Strategy, segmentation
- Chile Thermally Conductive Filler Dispersants Market (2026-2032) | Investment Opportunities, Trends, Value, Restraints, Share, Companies, Forecast, segmentation, Pricing, Challenges, Demand, Size, Analysis, Drivers, Outlook, Growth, Competition, Strategy, Revenue, Insights
- Cambodia Thermally Conductive Filler Dispersants Market (2026-2032) | Analysis, Share, Outlook, Strategy, Pricing, Demand, Size, Growth, segmentation, Insights, Revenue, Forecast, Challenges, Competition, Companies, Investment Opportunities, Trends, Restraints, Value, Drivers
- Brazil Thermally Conductive Filler Dispersants Market (2026-2032) | Restraints, Forecast, Competition, Size, Revenue, Value, Investment Opportunities, Trends, Insights, Outlook, Growth, Analysis, Drivers, segmentation, Pricing, Challenges, Strategy, Share, Companies, Demand
- Bangladesh Thermally Conductive Filler Dispersants Market (2026-2032) | Restraints, Trends, Analysis, Competition, Insights, Forecast, Value, Investment Opportunities, Pricing, Share, Demand, Outlook, Revenue, segmentation, Companies, Drivers, Growth, Size, Challenges, Strategy
- Bahrain Thermally Conductive Filler Dispersants Market (2026-2032) | Trends, Outlook, Pricing, Demand, Value, Competition, Forecast, Growth, segmentation, Revenue, Companies, Analysis, Insights, Size, Drivers, Challenges, Strategy, Investment Opportunities, Share, Restraints
Industry Events and Analyst Meet

HIMTEX 2026

India Refining Summit 2026

India EV Show 2026

EV tech India Expo 2026

Auto Tech Asia 2026
Whitepaper
- Middle East & Africa Commercial Security Market Click here to view more.
- Middle East & Africa Fire Safety Systems & Equipment Market Click here to view more.
- GCC Drone Market Click here to view more.
- Middle East Lighting Fixture Market Click here to view more.
- GCC Physical & Perimeter Security Market Click here to view more.
6WResearch In News
- Doha a strategic location for EV manufacturing hub: IPA Qatar
- Demand for luxury TVs surging in the GCC, says Samsung
- Empowering Growth: The Thriving Journey of Bangladesh’s Cable Industry
- Demand for luxury TVs surging in the GCC, says Samsung
- Video call with a traditional healer? Once unthinkable, it’s now common in South Africa
- Intelligent Buildings To Smooth GCC’s Path To Net Zero