Lithuania Hosiery Market (2026-2032) | Trends, Analysis, Revenue, Value, Companies, Segmentation, Forecast, Share, Outlook, Growth, Industry & Size
Market Forecast By Product (Body Stockings, Compression Stockings, Knee Highs, Hold-ups, Stockings, Socks, Tights, Toe Socks), By Gender (Men, Women), By Size (Small, Medium, Large, Plus), By Price Range (Premium, Medium, Low), By Distribution Channel (Mass Merchant, Mono Brand Outlet, Online Store, Departmental Store, Others) And Competitive Landscape
| Product Code: ETC5525924 | Publication Date: Nov 2023 | Updated Date: Apr 2026 | Product Type: Market Research Report | |
| Publisher: 6Wresearch | Author: Ravi Bhandari | No. of Pages: 60 | No. of Figures: 30 | No. of Tables: 5 |
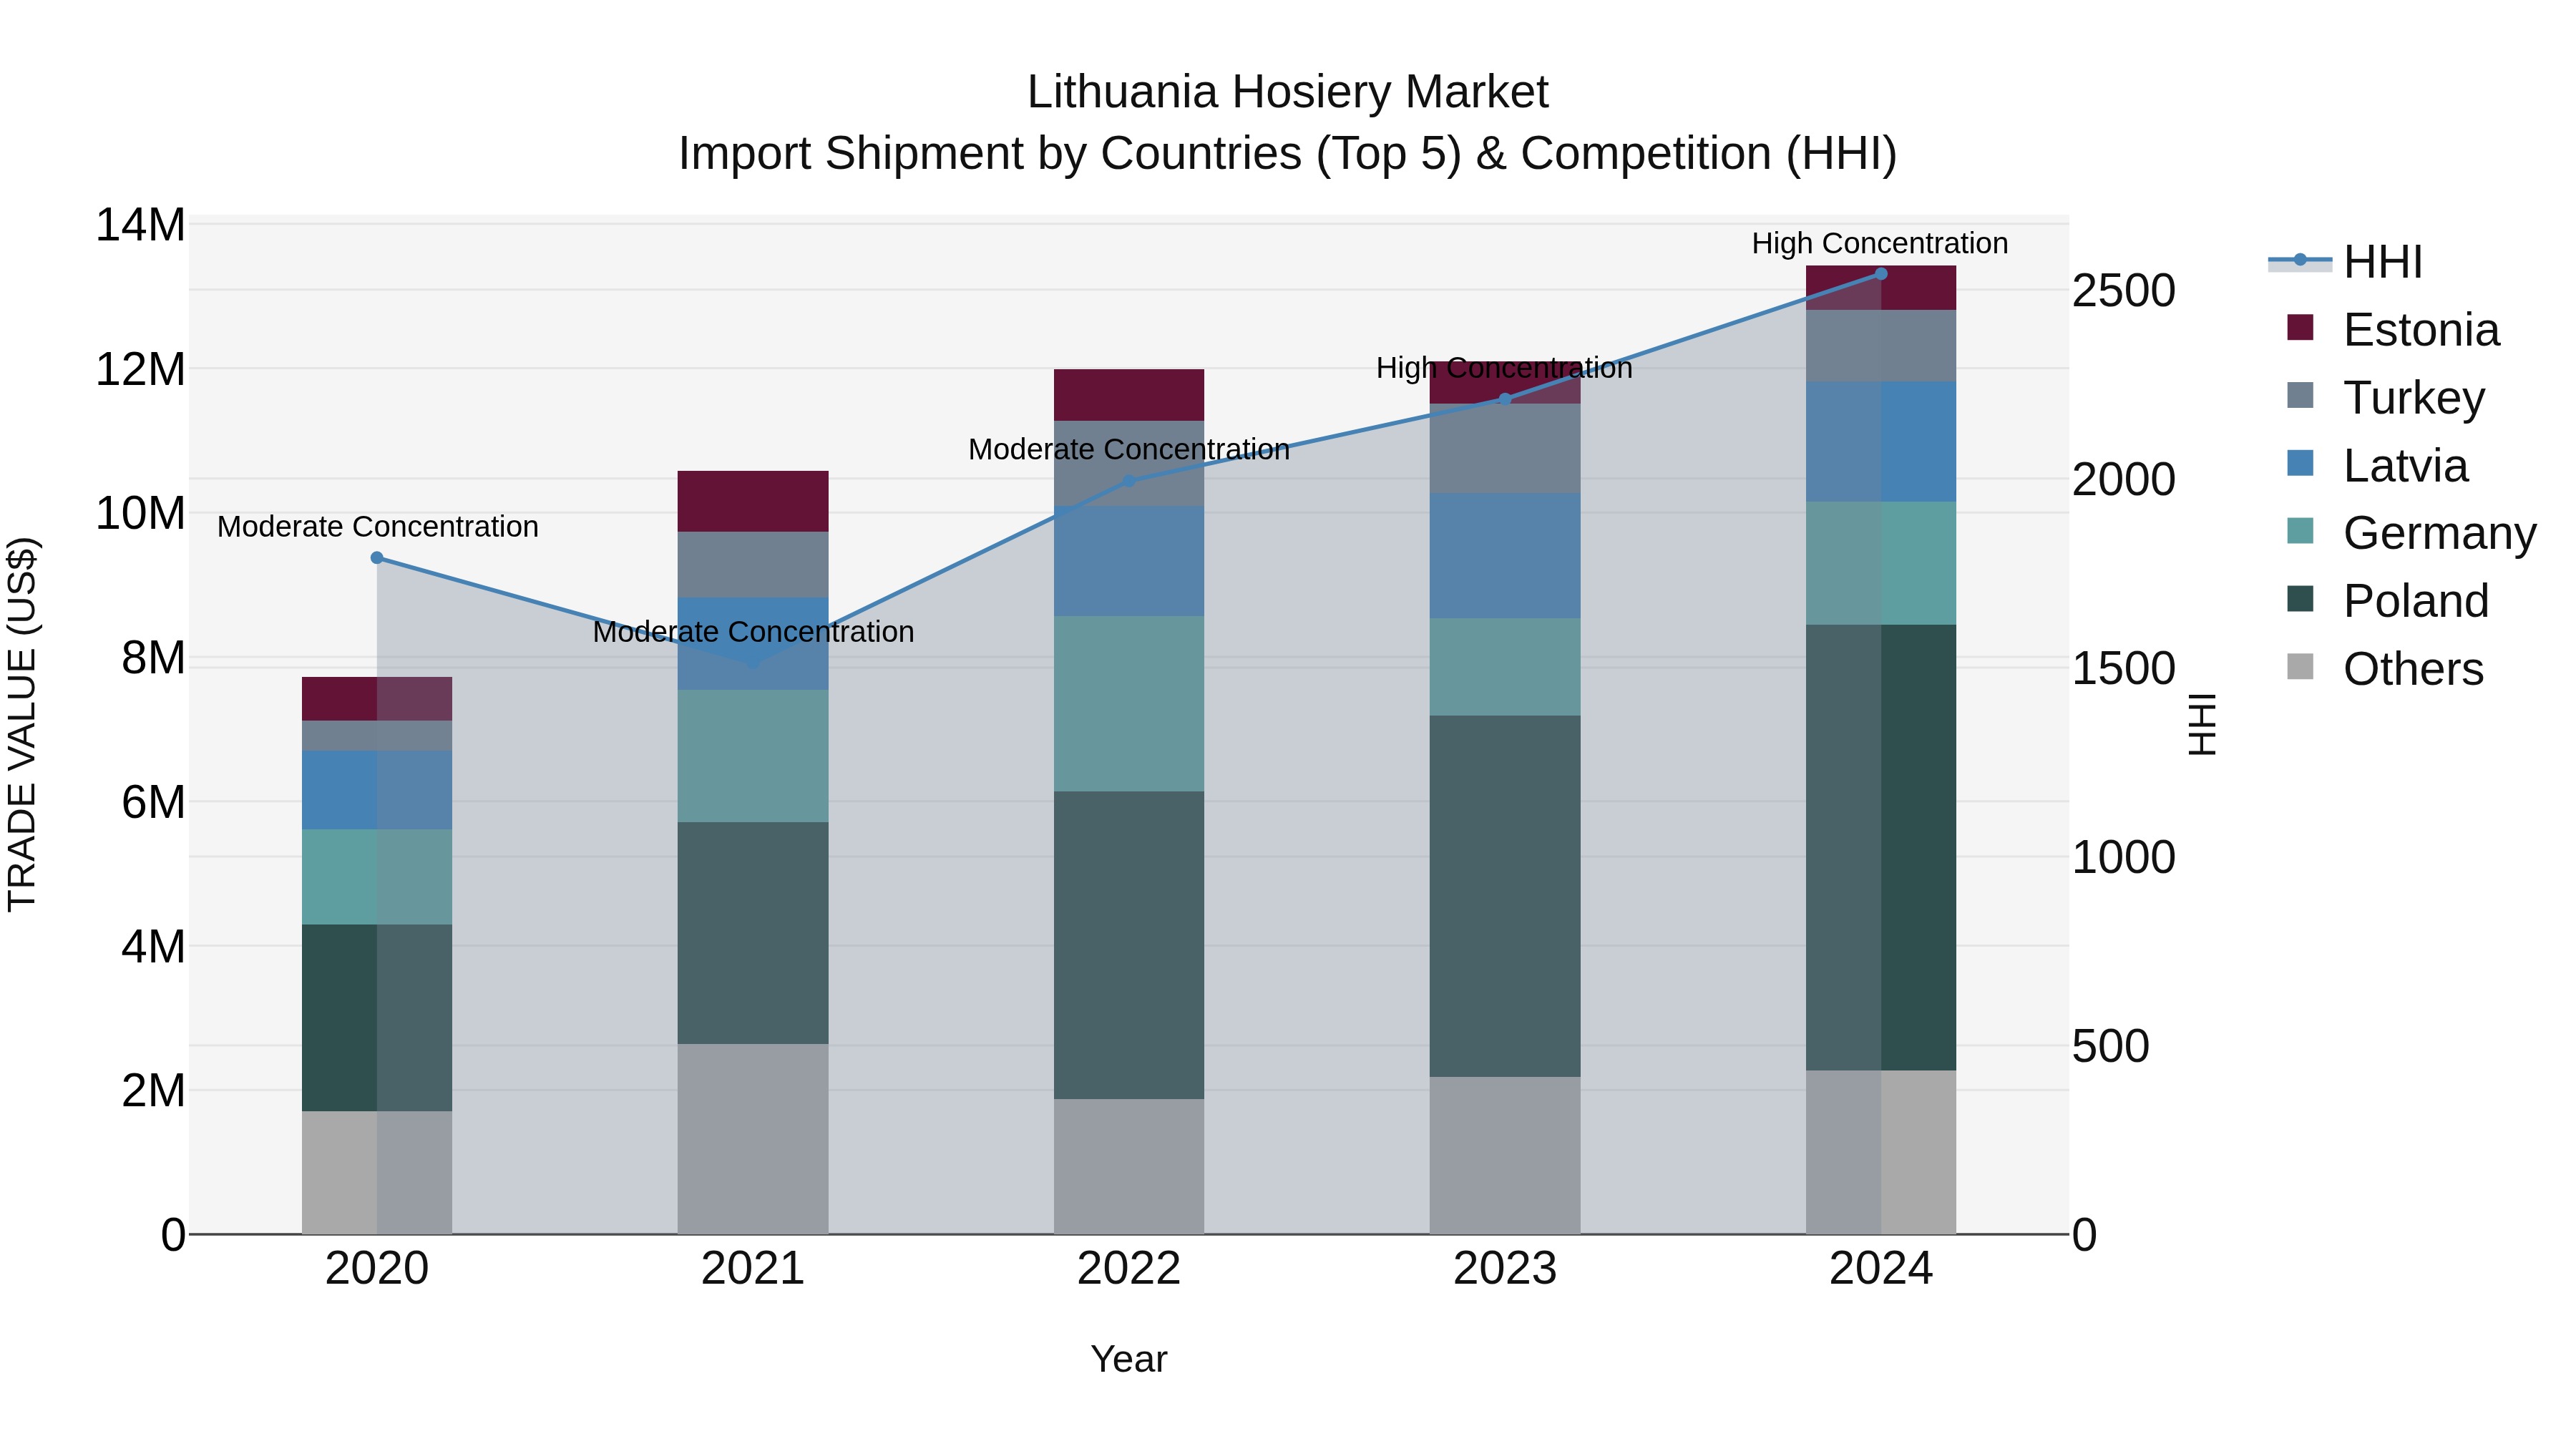
Lithuania Hosiery Market Top 5 Importing Countries and Market Competition (HHI) Analysis
Lithuania`s hosiery import market in 2024 continued to see strong growth, with top exporters being Poland, Germany, Latvia, Turkey, and Estonia. The high Herfindahl-Hirschman Index (HHI) indicates a concentrated market, highlighting the dominance of key players. The compound annual growth rate (CAGR) from 2020 to 2024 stood at an impressive 14.82%, showcasing sustained expansion. Furthermore, the growth rate in 2024 alone was notable at 10.93%, reflecting the increasing demand for hosiery imports in Lithuania. These trends suggest a vibrant and dynamic market landscape with significant opportunities for further development.
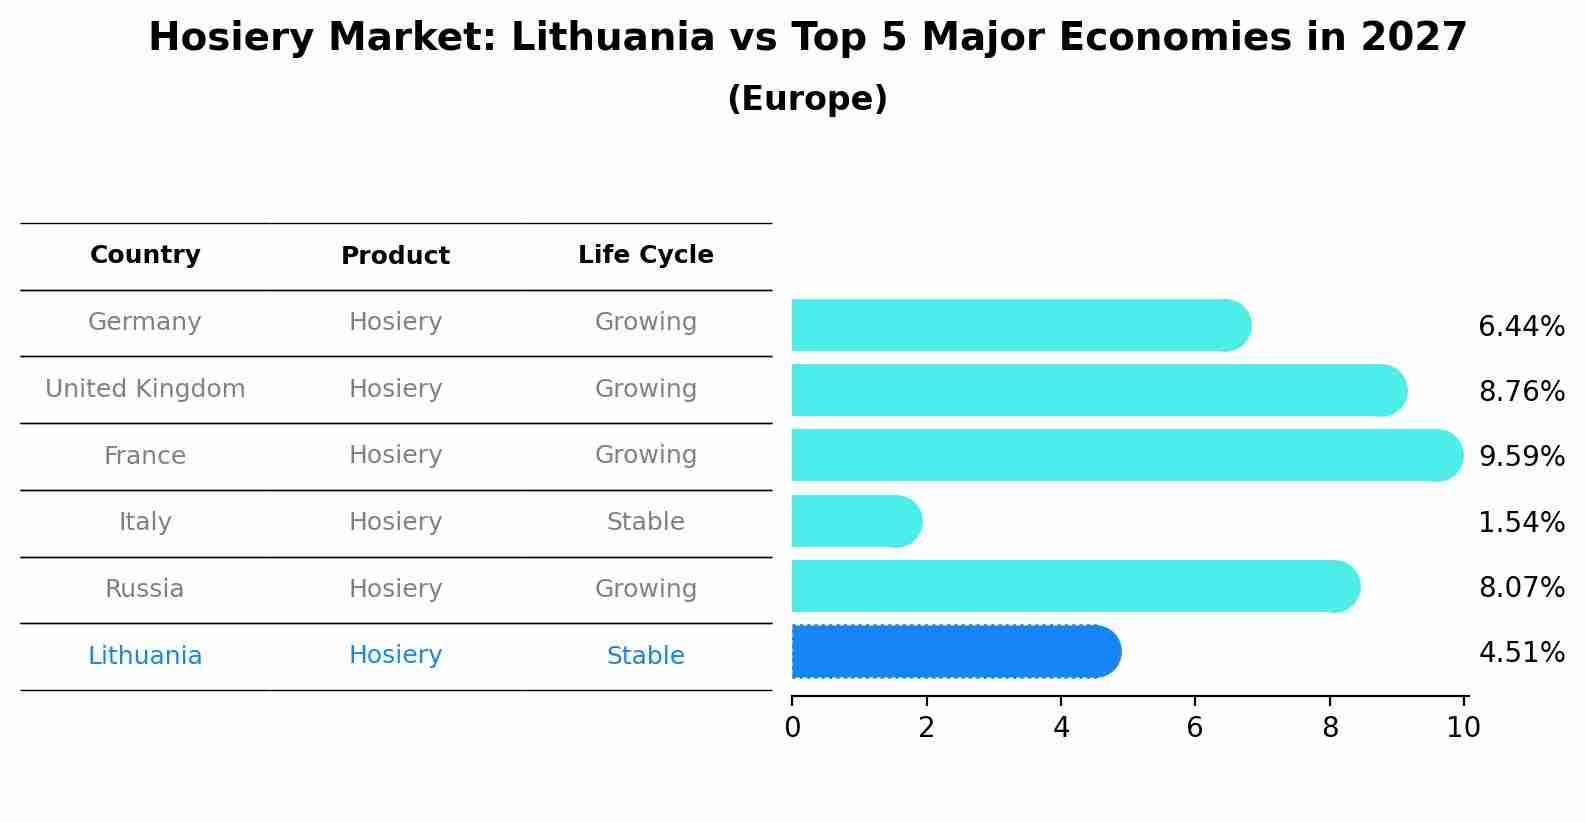
Hosiery Market: Lithuania vs Top 5 Major Economies in 2027 (Europe)
By 2027, Lithuania's Hosiery market is forecasted to achieve a stable growth rate of 4.51%, with Germany leading the Europe region, followed by United Kingdom, France, Italy and Russia.
Key Highlights of the Report:
- Lithuania Hosiery Market Outlook
- Market Size of Lithuania Hosiery Market, 2025
- Forecast of Lithuania Hosiery Market, 2032
- Historical Data and Forecast of Lithuania Hosiery Revenues & Volume for the Period 2022 - 2032F
- Lithuania Hosiery Market Trend Evolution
- Lithuania Hosiery Market Drivers and Challenges
- Lithuania Hosiery Price Trends
- Lithuania Hosiery Porter`s Five Forces
- Lithuania Hosiery Industry Life Cycle
- Historical Data and Forecast of Lithuania Hosiery Market Revenues & Volume By Product for the Period 2022 - 2032F
- Historical Data and Forecast of Lithuania Hosiery Market Revenues & Volume By Body Stockings for the Period 2022 - 2032F
- Historical Data and Forecast of Lithuania Hosiery Market Revenues & Volume By Compression Stockings for the Period 2022 - 2032F
- Historical Data and Forecast of Lithuania Hosiery Market Revenues & Volume By Knee Highs, Hold-ups for the Period 2022 - 2032F
- Historical Data and Forecast of Lithuania Hosiery Market Revenues & Volume By Stockings for the Period 2022 - 2032F
- Historical Data and Forecast of Lithuania Hosiery Market Revenues & Volume By Socks for the Period 2022 - 2032F
- Historical Data and Forecast of Lithuania Hosiery Market Revenues & Volume By Tights for the Period 2022 - 2032F
- Historical Data and Forecast of Lithuania Hosiery Market Revenues & Volume By Toe Socks for the Period 2022 - 2032F
- Historical Data and Forecast of Lithuania Hosiery Market Revenues & Volume By Gender for the Period 2022 - 2032F
- Historical Data and Forecast of Lithuania Hosiery Market Revenues & Volume By Men for the Period 2022 - 2032F
- Historical Data and Forecast of Lithuania Hosiery Market Revenues & Volume By Women for the Period 2022 - 2032F
- Historical Data and Forecast of Lithuania Hosiery Market Revenues & Volume By Size for the Period 2022 - 2032F
- Historical Data and Forecast of Lithuania Hosiery Market Revenues & Volume By Small for the Period 2022 - 2032F
- Historical Data and Forecast of Lithuania Hosiery Market Revenues & Volume By Medium for the Period 2022 - 2032F
- Historical Data and Forecast of Lithuania Hosiery Market Revenues & Volume By Large for the Period 2022 - 2032F
- Historical Data and Forecast of Lithuania Hosiery Market Revenues & Volume By Plus for the Period 2022 - 2032F
- Historical Data and Forecast of Lithuania Hosiery Market Revenues & Volume By Price Range for the Period 2022 - 2032F
- Historical Data and Forecast of Lithuania Hosiery Market Revenues & Volume By Premium for the Period 2022 - 2032F
- Historical Data and Forecast of Lithuania Hosiery Market Revenues & Volume By Medium for the Period 2022 - 2032F
- Historical Data and Forecast of Lithuania Hosiery Market Revenues & Volume By Low for the Period 2022 - 2032F
- Historical Data and Forecast of Lithuania Hosiery Market Revenues & Volume By Distribution Channel for the Period 2022 - 2032F
- Historical Data and Forecast of Lithuania Hosiery Market Revenues & Volume By Mass Merchant for the Period 2022 - 2032F
- Historical Data and Forecast of Lithuania Hosiery Market Revenues & Volume By Mono Brand Outlet for the Period 2022 - 2032F
- Historical Data and Forecast of Lithuania Hosiery Market Revenues & Volume By Online Store for the Period 2022 - 2032F
- Historical Data and Forecast of Lithuania Hosiery Market Revenues & Volume By Departmental Store for the Period 2022 - 2032F
- Historical Data and Forecast of Lithuania Hosiery Market Revenues & Volume By Others for the Period 2022 - 2032F
- Lithuania Hosiery Import Export Trade Statistics
- Market Opportunity Assessment By Product
- Market Opportunity Assessment By Gender
- Market Opportunity Assessment By Size
- Market Opportunity Assessment By Price Range
- Market Opportunity Assessment By Distribution Channel
- Lithuania Hosiery Top Companies Market Share
- Lithuania Hosiery Competitive Benchmarking By Technical and Operational Parameters
- Lithuania Hosiery Company Profiles
- Lithuania Hosiery Key Strategic Recommendations
Frequently Asked Questions About the Market Study (FAQs):
6Wresearch actively monitors the Lithuania Hosiery Market and publishes its comprehensive annual report, highlighting emerging trends, growth drivers, revenue analysis, and forecast outlook. Our insights help businesses to make data-backed strategic decisions with ongoing market dynamics. Our analysts track relevent industries related to the Lithuania Hosiery Market, allowing our clients with actionable intelligence and reliable forecasts tailored to emerging regional needs.
Yes, we provide customisation as per your requirements. To learn more, feel free to contact us on sales@6wresearch.com
1 Executive Summary |
2 Introduction |
2.1 Key Highlights of the Report |
2.2 Report Description |
2.3 Market Scope & Segmentation |
2.4 Research Methodology |
2.5 Assumptions |
3 Lithuania Hosiery Market Overview |
3.1 Lithuania Country Macro Economic Indicators |
3.2 Lithuania Hosiery Market Revenues & Volume, 2022 & 2032F |
3.3 Lithuania Hosiery Market - Industry Life Cycle |
3.4 Lithuania Hosiery Market - Porter's Five Forces |
3.5 Lithuania Hosiery Market Revenues & Volume Share, By End-User, 2022 & 2032F |
3.6 Lithuania Hosiery Market Revenues & Volume Share, By Distribution Channel, 2022 & 2032F |
4 Lithuania Hosiery Market Dynamics |
4.1 Impact Analysis |
4.2 Market Drivers |
4.2.1 Increasing disposable income of consumers in Lithuania leading to higher spending on clothing and fashion items. |
4.2.2 Growing awareness about fashion trends and the importance of accessorizing outfits with hosiery. |
4.2.3 Rising demand for specialized hosiery products such as compression stockings for medical purposes. |
4.3 Market Restraints |
4.3.1 Seasonal fluctuations in demand for hosiery due to weather conditions in Lithuania. |
4.3.2 Competition from other clothing accessories like leggings and socks impacting hosiery sales. |
4.3.3 Price sensitivity among consumers affecting purchase decisions in a price-competitive market. |
5 Lithuania Hosiery Market Trends |
6 Lithuania Hosiery Market Segmentations |
6.1 Lithuania Hosiery Market, By End-User |
6.1.1 Overview and Analysis |
6.1.2 Lithuania Hosiery Market Revenues & Volume, By Men, 2022 - 2032F |
6.1.3 Lithuania Hosiery Market Revenues & Volume, By Women, 2022 - 2032F |
6.2 Lithuania Hosiery Market, By Distribution Channel |
6.2.1 Overview and Analysis |
6.2.2 Lithuania Hosiery Market Revenues & Volume, By Offline, 2022 - 2032F |
6.2.3 Lithuania Hosiery Market Revenues & Volume, By Online, 2022 - 2032F |
7 Lithuania Hosiery Market Import-Export Trade Statistics |
7.1 Lithuania Hosiery Market Export to Major Countries |
7.2 Lithuania Hosiery Market Imports from Major Countries |
8 Lithuania Hosiery Market Key Performance Indicators |
8.1 Average selling price of hosiery products. |
8.2 Percentage of repeat customers purchasing hosiery. |
8.3 Website traffic and engagement metrics for online hosiery retailers. |
9 Lithuania Hosiery Market - Opportunity Assessment |
9.1 Lithuania Hosiery Market Opportunity Assessment, By End-User, 2022 & 2032F |
9.2 Lithuania Hosiery Market Opportunity Assessment, By Distribution Channel, 2022 & 2032F |
10 Lithuania Hosiery Market - Competitive Landscape |
10.1 Lithuania Hosiery Market Revenue Share, By Companies, 2025 |
10.2 Lithuania Hosiery Market Competitive Benchmarking, By Operating and Technical Parameters |
11 Company Profiles |
12 Recommendations | 13 Disclaimer |
Global Go To Market Strategy - 2030
Export potential enables firms to identify high-growth global markets with greater confidence by combining advanced trade intelligence with a structured quantitative methodology. The framework analyzes emerging demand trends and country-level import patterns while integrating macroeconomic and trade datasets such as GDP and population forecasts, bilateral import–export flows, tariff structures, elasticity differentials between developed and developing economies, geographic distance, and import demand projections. Using weighted trade values from 2020–2024 as the base period to project country-to-country export potential for 2030, these inputs are operationalized through calculated drivers such as gravity model parameters, tariff impact factors, and projected GDP per-capita growth. Through an analysis of hidden potentials, demand hotspots, and market conditions that are most favorable to success, this method enables firms to focus on target countries, maximize returns, and global expansion with data, backed by accuracy.
By factoring in the projected importer demand gap that is currently unmet and could be potential opportunity, it identifies the potential for the Exporter (Country) among 190 countries, against the general trade analysis, which identifies the biggest importer or exporter.
To discover high-growth global markets and optimize your business strategy:
Click Here
Pricing
- Single User License$ 1,995
- Department License$ 2,400
- Site License$ 3,120
- Global License$ 3,795

Leadership Perspectives from Industry Events
Search
Thought Leadership and Analyst Meet


Our Clients
6WResearch In News
- Doha a strategic location for EV manufacturing hub: IPA Qatar
- Demand for luxury TVs surging in the GCC, says Samsung
- Empowering Growth: The Thriving Journey of Bangladesh’s Cable Industry
- Demand for luxury TVs surging in the GCC, says Samsung
- Video call with a traditional healer? Once unthinkable, it’s now common in South Africa
- Intelligent Buildings To Smooth GCC’s Path To Net Zero
Latest Reports
- Cape Verde Portable Hand-Thrown Extinguisher Market (2026-2032)
- Canada Portable Hand-Thrown Extinguisher Market (2026-2032)
- Cameroon Portable Hand-Thrown Extinguisher Market (2026-2032)
- Burundi Portable Hand-Thrown Extinguisher Market (2026-2032)
- Burkina Faso Portable Hand-Thrown Extinguisher Market (2026-2032)
- Bulgaria Portable Hand-Thrown Extinguisher Market (2026-2032)
- Brunei Portable Hand-Thrown Extinguisher Market (2026-2032)
- Botswana Portable Hand-Thrown Extinguisher Market (2026-2032)
- Bosnia and Herzegovina Portable Hand-Thrown Extinguisher Market (2026-2032)
- Bolivia Portable Hand-Thrown Extinguisher Market (2026-2032)
Industry Events and Analyst Meet

HIMTEX 2026

India Refining Summit 2026

India EV Show 2026

EV tech India Expo 2026

Auto Tech Asia 2026
Whitepaper
- Middle East & Africa Commercial Security Market Click here to view more.
- Middle East & Africa Fire Safety Systems & Equipment Market Click here to view more.
- GCC Drone Market Click here to view more.
- Middle East Lighting Fixture Market Click here to view more.
- GCC Physical & Perimeter Security Market Click here to view more.