Lithuania Icing Sugar Market (2026-2032) | Competitive, Restraints, Segments, Investment Trends, Analysis, Demand, Value, Revenue, Trends, Drivers, Segmentation, Opportunities, Companies, Competition, Growth, Industry, Supply, Outlook, Strategic Insights, Share, Size, Consumer Insights, Pricing Analysis, Forecast, Strategy, Challenges
Market Forecast By Type (Confectioners™ Sugar, Powdered Sugar, Icing Mixtures, Organic Icing Sugar, Decorators™ Sugar), By Particle Size (Fine Powder, Extra Fine Powder, Ultra-Fine Powder, Coarse Powder, Micro-Powder), By Application (Bakery, Desserts, Beverages, Confectionery, Industrial Baking), By Sales Channel (Direct Sales, Distributors, Online, Bulk Procurement, Retail Stores), By Sweetening Source (Cane Sugar, Beet Sugar, Artificial Sweetener, Honey-Based, Natural Sugars) And Competitive Landscape
| Product Code: ETC12457722 | Publication Date: Apr 2025 | Updated Date: Apr 2026 | Product Type: Market Research Report | |
| Publisher: 6Wresearch | No. of Pages: 65 | No. of Figures: 34 | No. of Tables: 19 | |
Lithuania Icing Sugar Market Size (2020-2030)
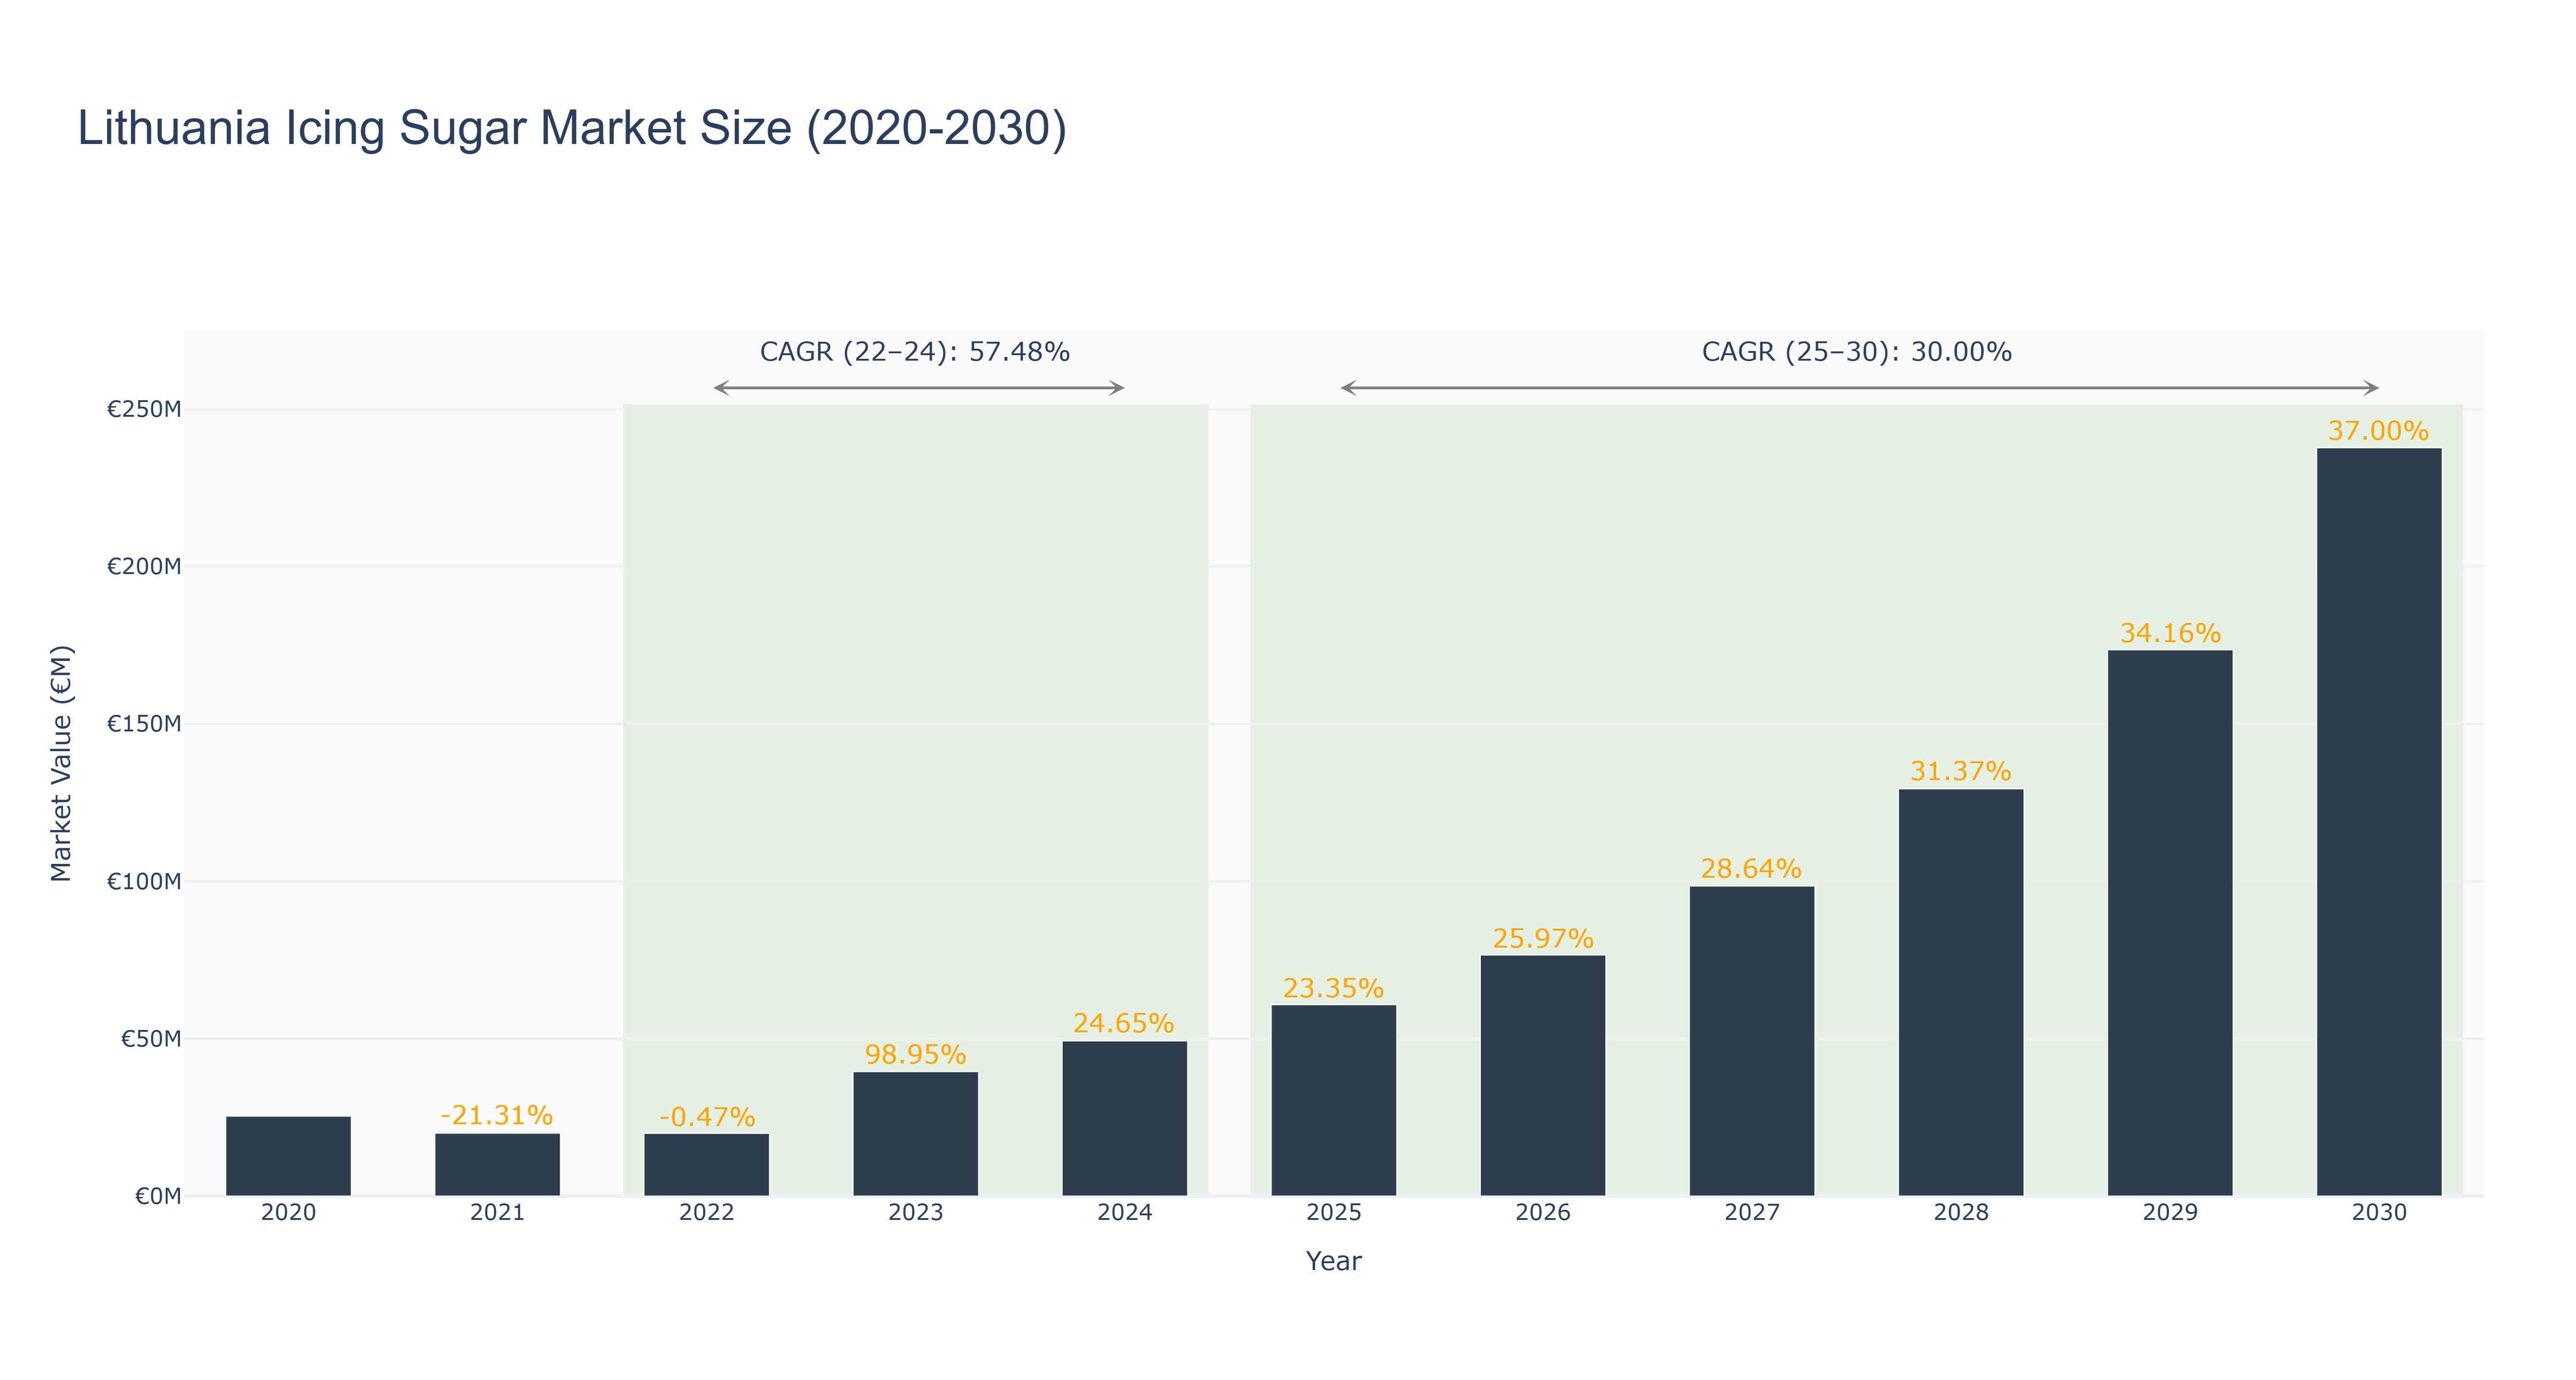
The Lithuania Icing Sugar Market experienced notable fluctuations between 2020 and 2024. Following a peak market size of €25.35 million in 2020, the market faced a significant decline to €19.95 million in 2021, reflecting a growth rate of -21.31%. This downturn continued into 2022, with a slight decrease to €19.86 million (-0.47%). However, 2023 marked a remarkable rebound, with the market expanding to €39.51 million, showcasing a growth rate of 98.95%, followed by a further increase to €49.25 million in 2024 (24.65% growth). Looking ahead, the forecasted period from 2025 to 2030 anticipates steady growth, with a projected CAGR of 30.00%, reaching a market size of €237.72 million by 2030. Key drivers for this growth include increasing demand for confectionery products and innovations in food production. This upward trajectory suggests a robust recovery and expanding opportunities in the Lithuanian icing sugar sector.
Lithuania Icing Sugar Market: Production & Trade Performance (2019-2025)
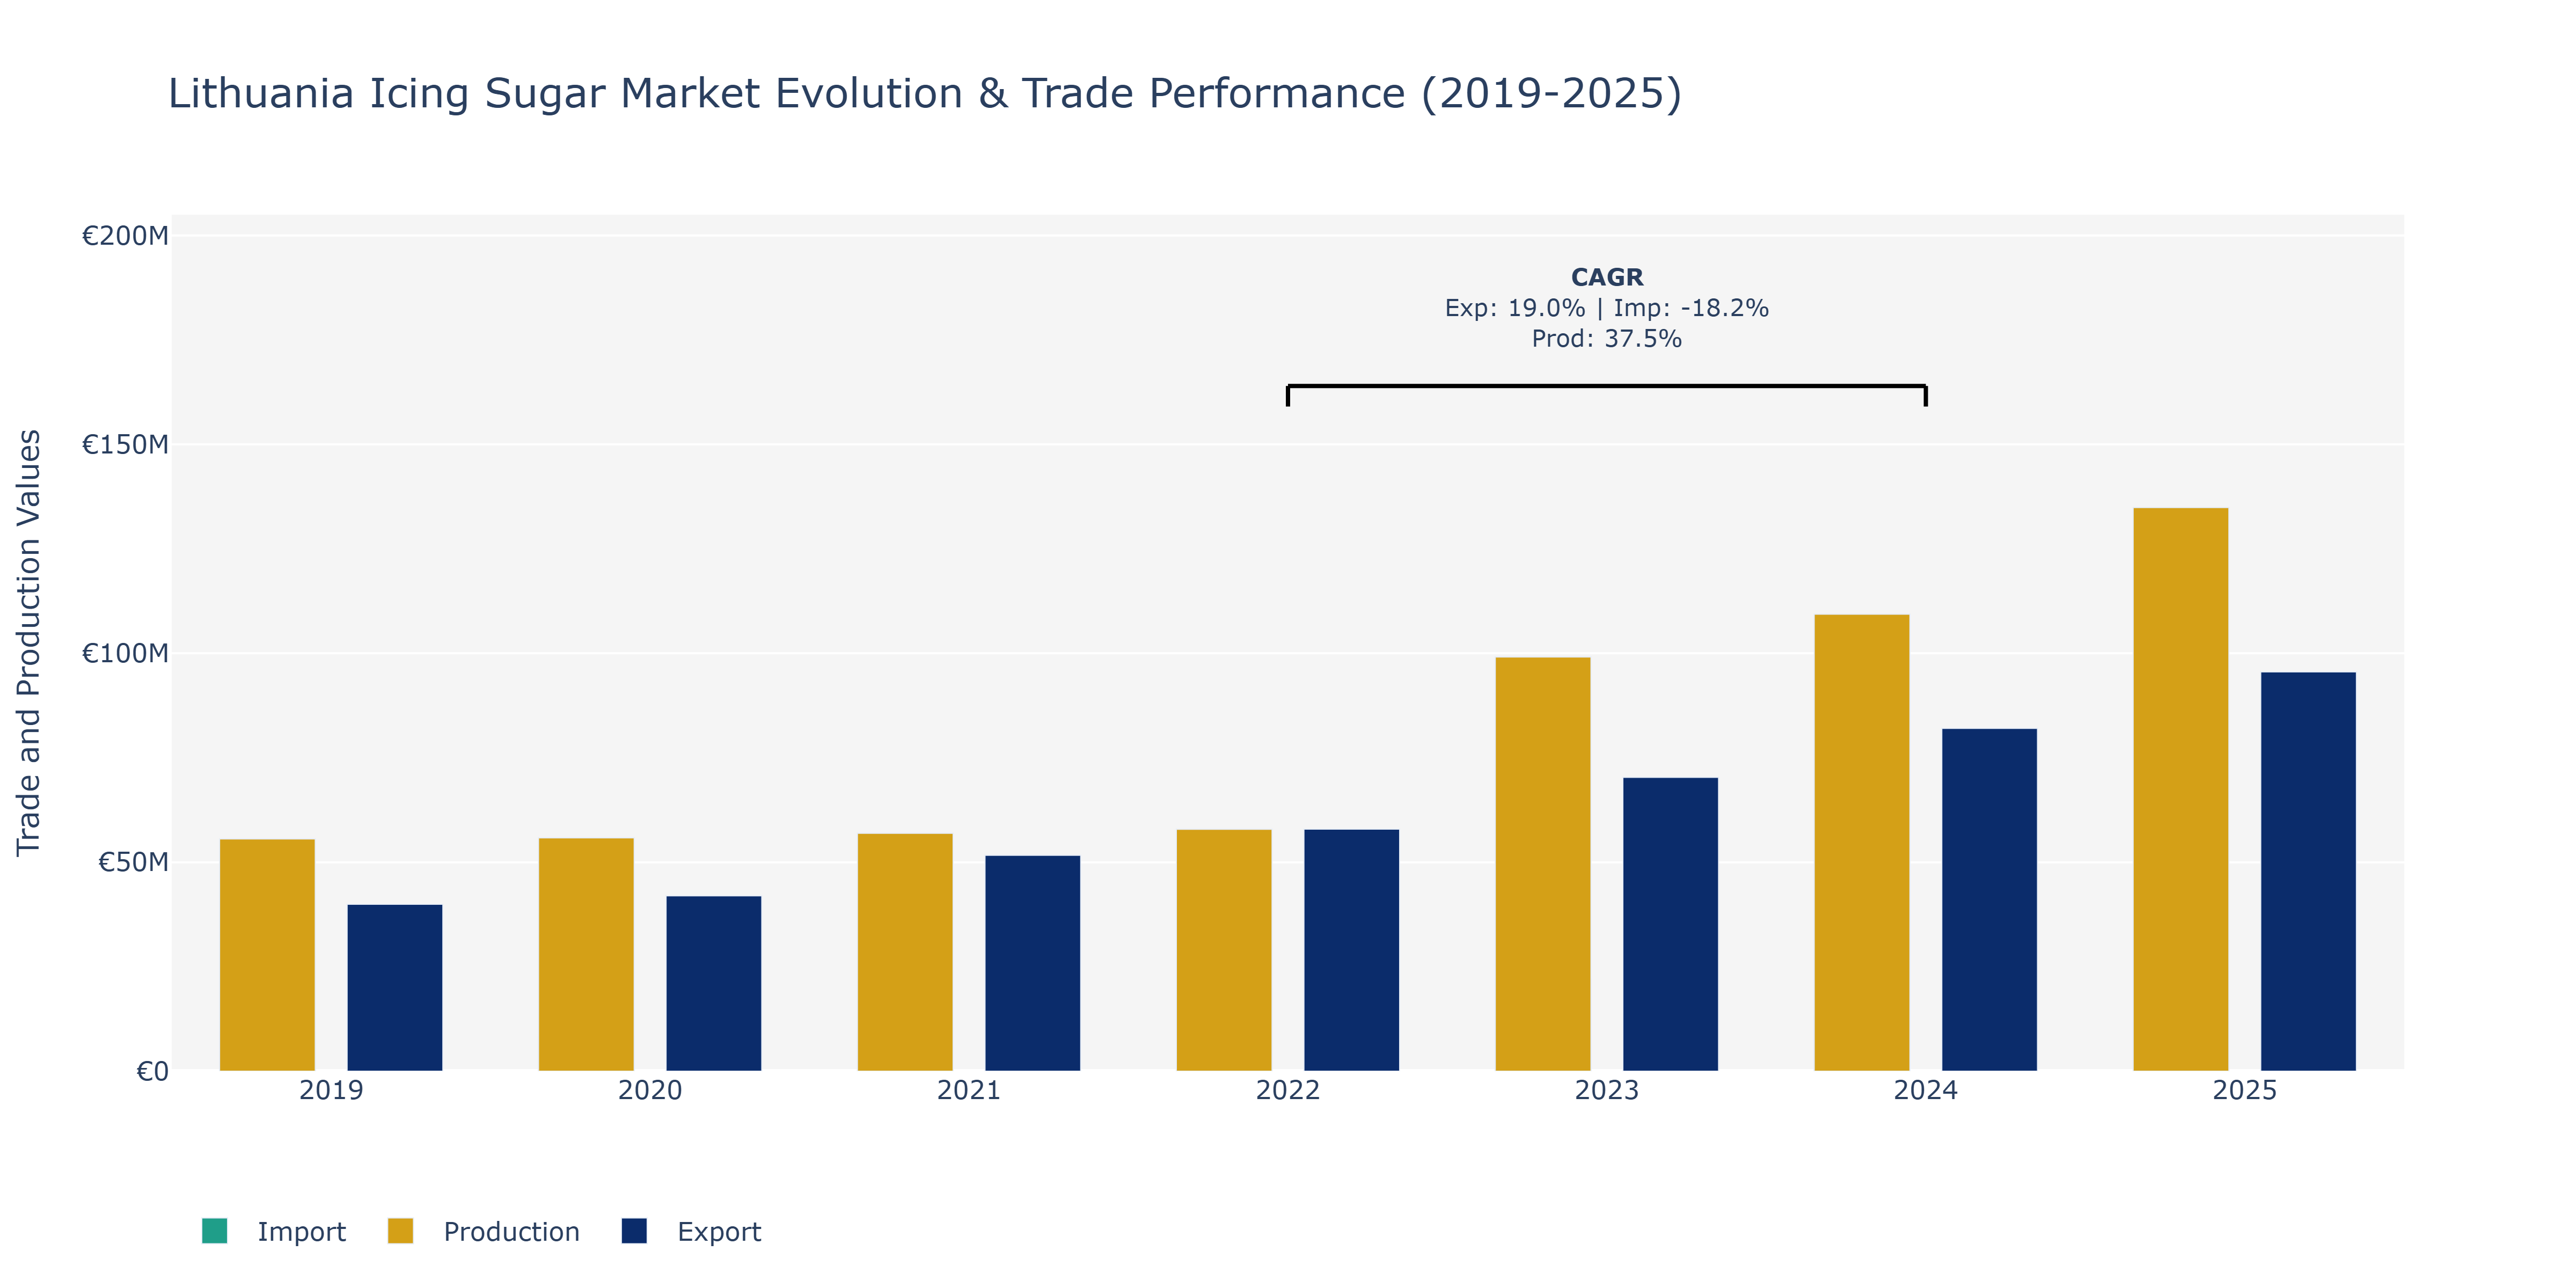
In the Lithuania Icing Sugar Market, exports, imports, and Production value showcase intriguing dynamics over the years. From 2019 to 2025, exports steadily climbed from €39.93 million to €95.55 million, marking a consistent upward trajectory. In contrast, imports fluctuated, reaching a peak in 2023 at €22.06 million before declining to €11.52 million in 2025. Production witnessed a remarkable surge, more than doubling from €55.56 million in 2019 to €134.89 million in 2025. These trends suggest a growing domestic production capacity catering to increasing export demands. The fluctuating Import value could be attributed to varying global sugar prices impacting import decisions. The consistent growth in exports could be driven by favorable trade agreements, increased demand for confectionery products, and potentially competitive pricing strategies in the international market. To sustain this growth, market players may focus on enhancing production efficiency and maintaining quality standards to meet export requirements effectively.
Key Highlights of the Report:
- Lithuania Icing Sugar Market Outlook
- Market Size of Lithuania Icing Sugar Market, 2025
- Forecast of Lithuania Icing Sugar Market, 2032
- Historical Data and Forecast of Lithuania Icing Sugar Revenues & Volume for the Period 2022 - 2032F
- Lithuania Icing Sugar Market Trend Evolution
- Lithuania Icing Sugar Market Drivers and Challenges
- Lithuania Icing Sugar Price Trends
- Lithuania Icing Sugar Porter's Five Forces
- Lithuania Icing Sugar Industry Life Cycle
- Historical Data and Forecast of Lithuania Icing Sugar Market Revenues & Volume By Type for the Period 2022 - 2032F
- Historical Data and Forecast of Lithuania Icing Sugar Market Revenues & Volume By Confectioners' Sugar for the Period 2022 - 2032F
- Historical Data and Forecast of Lithuania Icing Sugar Market Revenues & Volume By Powdered Sugar for the Period 2022 - 2032F
- Historical Data and Forecast of Lithuania Icing Sugar Market Revenues & Volume By Icing Mixtures for the Period 2022 - 2032F
- Historical Data and Forecast of Lithuania Icing Sugar Market Revenues & Volume By Organic Icing Sugar for the Period 2022 - 2032F
- Historical Data and Forecast of Lithuania Icing Sugar Market Revenues & Volume By Decorators' Sugar for the Period 2022 - 2032F
- Historical Data and Forecast of Lithuania Icing Sugar Market Revenues & Volume By Particle Size for the Period 2022 - 2032F
- Historical Data and Forecast of Lithuania Icing Sugar Market Revenues & Volume By Fine Powder for the Period 2022 - 2032F
- Historical Data and Forecast of Lithuania Icing Sugar Market Revenues & Volume By Extra Fine Powder for the Period 2022 - 2032F
- Historical Data and Forecast of Lithuania Icing Sugar Market Revenues & Volume By Ultra-Fine Powder for the Period 2022 - 2032F
- Historical Data and Forecast of Lithuania Icing Sugar Market Revenues & Volume By Coarse Powder for the Period 2022 - 2032F
- Historical Data and Forecast of Lithuania Icing Sugar Market Revenues & Volume By Micro-Powder for the Period 2022 - 2032F
- Historical Data and Forecast of Lithuania Icing Sugar Market Revenues & Volume By Application for the Period 2022 - 2032F
- Historical Data and Forecast of Lithuania Icing Sugar Market Revenues & Volume By Bakery for the Period 2022 - 2032F
- Historical Data and Forecast of Lithuania Icing Sugar Market Revenues & Volume By Desserts for the Period 2022 - 2032F
- Historical Data and Forecast of Lithuania Icing Sugar Market Revenues & Volume By Beverages for the Period 2022 - 2032F
- Historical Data and Forecast of Lithuania Icing Sugar Market Revenues & Volume By Confectionery for the Period 2022 - 2032F
- Historical Data and Forecast of Lithuania Icing Sugar Market Revenues & Volume By Industrial Baking for the Period 2022 - 2032F
- Historical Data and Forecast of Lithuania Icing Sugar Market Revenues & Volume By Sales Channel for the Period 2022 - 2032F
- Historical Data and Forecast of Lithuania Icing Sugar Market Revenues & Volume By Direct Sales for the Period 2022 - 2032F
- Historical Data and Forecast of Lithuania Icing Sugar Market Revenues & Volume By Distributors for the Period 2022 - 2032F
- Historical Data and Forecast of Lithuania Icing Sugar Market Revenues & Volume By Online for the Period 2022 - 2032F
- Historical Data and Forecast of Lithuania Icing Sugar Market Revenues & Volume By Bulk Procurement for the Period 2022 - 2032F
- Historical Data and Forecast of Lithuania Icing Sugar Market Revenues & Volume By Retail Stores for the Period 2022 - 2032F
- Historical Data and Forecast of Lithuania Icing Sugar Market Revenues & Volume By Sweetening Source for the Period 2022 - 2032F
- Historical Data and Forecast of Lithuania Icing Sugar Market Revenues & Volume By Cane Sugar for the Period 2022 - 2032F
- Historical Data and Forecast of Lithuania Icing Sugar Market Revenues & Volume By Beet Sugar for the Period 2022 - 2032F
- Historical Data and Forecast of Lithuania Icing Sugar Market Revenues & Volume By Artificial Sweetener for the Period 2022 - 2032F
- Historical Data and Forecast of Lithuania Icing Sugar Market Revenues & Volume By Honey-Based for the Period 2022 - 2032F
- Historical Data and Forecast of Lithuania Icing Sugar Market Revenues & Volume By Natural Sugars for the Period 2022 - 2032F
- Lithuania Icing Sugar Import Export Trade Statistics
- Market Opportunity Assessment By Type
- Market Opportunity Assessment By Particle Size
- Market Opportunity Assessment By Application
- Market Opportunity Assessment By Sales Channel
- Market Opportunity Assessment By Sweetening Source
- Lithuania Icing Sugar Top Companies Market Share
- Lithuania Icing Sugar Competitive Benchmarking By Technical and Operational Parameters
- Lithuania Icing Sugar Company Profiles
- Lithuania Icing Sugar Key Strategic Recommendations
Frequently Asked Questions About the Market Study (FAQs):
6Wresearch actively monitors the Lithuania Icing Sugar Market and publishes its comprehensive annual report, highlighting emerging trends, growth drivers, revenue analysis, and forecast outlook. Our insights help businesses to make data-backed strategic decisions with ongoing market dynamics. Our analysts track relevent industries related to the Lithuania Icing Sugar Market, allowing our clients with actionable intelligence and reliable forecasts tailored to emerging regional needs.
Yes, we provide customisation as per your requirements. To learn more, feel free to contact us on sales@6wresearch.com
1 Executive Summary |
2 Introduction |
2.1 Key Highlights of the Report |
2.2 Report Description |
2.3 Market Scope & Segmentation |
2.4 Research Methodology |
2.5 Assumptions |
3 Lithuania Icing Sugar Market Overview |
3.1 Lithuania Country Macro Economic Indicators |
3.2 Lithuania Icing Sugar Market Revenues & Volume, 2022 & 2032F |
3.3 Lithuania Icing Sugar Market - Industry Life Cycle |
3.4 Lithuania Icing Sugar Market - Porter's Five Forces |
3.5 Lithuania Icing Sugar Market Revenues & Volume Share, By Type, 2022 & 2032F |
3.6 Lithuania Icing Sugar Market Revenues & Volume Share, By Particle Size, 2022 & 2032F |
3.7 Lithuania Icing Sugar Market Revenues & Volume Share, By Application, 2022 & 2032F |
3.8 Lithuania Icing Sugar Market Revenues & Volume Share, By Sales Channel, 2022 & 2032F |
3.9 Lithuania Icing Sugar Market Revenues & Volume Share, By Sweetening Source, 2022 & 2032F |
4 Lithuania Icing Sugar Market Dynamics |
4.1 Impact Analysis |
4.2 Market Drivers |
4.2.1 Increasing consumer preference for convenience foods and baked goods |
4.2.2 Growing demand for natural and organic sweeteners |
4.2.3 Rising popularity of home baking and confectionery trends |
4.3 Market Restraints |
4.3.1 Fluctuating prices of raw materials such as sugar and packaging |
4.3.2 Stringent regulations and quality standards in the food industry |
4.3.3 Competition from alternative sweeteners like stevia and erythritol |
5 Lithuania Icing Sugar Market Trends |
6 Lithuania Icing Sugar Market, By Types |
6.1 Lithuania Icing Sugar Market, By Type |
6.1.1 Overview and Analysis |
6.1.2 Lithuania Icing Sugar Market Revenues & Volume, By Type, 2022 - 2032F |
6.1.3 Lithuania Icing Sugar Market Revenues & Volume, By Confectioners' Sugar, 2022 - 2032F |
6.1.4 Lithuania Icing Sugar Market Revenues & Volume, By Powdered Sugar, 2022 - 2032F |
6.1.5 Lithuania Icing Sugar Market Revenues & Volume, By Icing Mixtures, 2022 - 2032F |
6.1.6 Lithuania Icing Sugar Market Revenues & Volume, By Organic Icing Sugar, 2022 - 2032F |
6.1.7 Lithuania Icing Sugar Market Revenues & Volume, By Decorators' Sugar, 2022 - 2032F |
6.2 Lithuania Icing Sugar Market, By Particle Size |
6.2.1 Overview and Analysis |
6.2.2 Lithuania Icing Sugar Market Revenues & Volume, By Fine Powder, 2022 - 2032F |
6.2.3 Lithuania Icing Sugar Market Revenues & Volume, By Extra Fine Powder, 2022 - 2032F |
6.2.4 Lithuania Icing Sugar Market Revenues & Volume, By Ultra-Fine Powder, 2022 - 2032F |
6.2.5 Lithuania Icing Sugar Market Revenues & Volume, By Coarse Powder, 2022 - 2032F |
6.2.6 Lithuania Icing Sugar Market Revenues & Volume, By Micro-Powder, 2022 - 2032F |
6.3 Lithuania Icing Sugar Market, By Application |
6.3.1 Overview and Analysis |
6.3.2 Lithuania Icing Sugar Market Revenues & Volume, By Bakery, 2022 - 2032F |
6.3.3 Lithuania Icing Sugar Market Revenues & Volume, By Desserts, 2022 - 2032F |
6.3.4 Lithuania Icing Sugar Market Revenues & Volume, By Beverages, 2022 - 2032F |
6.3.5 Lithuania Icing Sugar Market Revenues & Volume, By Confectionery, 2022 - 2032F |
6.3.6 Lithuania Icing Sugar Market Revenues & Volume, By Industrial Baking, 2022 - 2032F |
6.4 Lithuania Icing Sugar Market, By Sales Channel |
6.4.1 Overview and Analysis |
6.4.2 Lithuania Icing Sugar Market Revenues & Volume, By Direct Sales, 2022 - 2032F |
6.4.3 Lithuania Icing Sugar Market Revenues & Volume, By Distributors, 2022 - 2032F |
6.4.4 Lithuania Icing Sugar Market Revenues & Volume, By Online, 2022 - 2032F |
6.4.5 Lithuania Icing Sugar Market Revenues & Volume, By Bulk Procurement, 2022 - 2032F |
6.4.6 Lithuania Icing Sugar Market Revenues & Volume, By Retail Stores, 2022 - 2032F |
6.5 Lithuania Icing Sugar Market, By Sweetening Source |
6.5.1 Overview and Analysis |
6.5.2 Lithuania Icing Sugar Market Revenues & Volume, By Cane Sugar, 2022 - 2032F |
6.5.3 Lithuania Icing Sugar Market Revenues & Volume, By Beet Sugar, 2022 - 2032F |
6.5.4 Lithuania Icing Sugar Market Revenues & Volume, By Artificial Sweetener, 2022 - 2032F |
6.5.5 Lithuania Icing Sugar Market Revenues & Volume, By Honey-Based, 2022 - 2032F |
6.5.6 Lithuania Icing Sugar Market Revenues & Volume, By Natural Sugars, 2022 - 2032F |
7 Lithuania Icing Sugar Market Import-Export Trade Statistics |
7.1 Lithuania Icing Sugar Market Export to Major Countries |
7.2 Lithuania Icing Sugar Market Imports from Major Countries |
8 Lithuania Icing Sugar Market Key Performance Indicators |
8.1 Average selling price of icing sugar |
8.2 Number of new product launches in the icing sugar market |
8.3 Consumer awareness and perception of icing sugar quality |
8.4 Market penetration of icing sugar in various food applications |
9 Lithuania Icing Sugar Market - Opportunity Assessment |
9.1 Lithuania Icing Sugar Market Opportunity Assessment, By Type, 2022 & 2032F |
9.2 Lithuania Icing Sugar Market Opportunity Assessment, By Particle Size, 2022 & 2032F |
9.3 Lithuania Icing Sugar Market Opportunity Assessment, By Application, 2022 & 2032F |
9.4 Lithuania Icing Sugar Market Opportunity Assessment, By Sales Channel, 2022 & 2032F |
9.5 Lithuania Icing Sugar Market Opportunity Assessment, By Sweetening Source, 2022 & 2032F |
10 Lithuania Icing Sugar Market - Competitive Landscape |
10.1 Lithuania Icing Sugar Market Revenue Share, By Companies, 2025 |
10.2 Lithuania Icing Sugar Market Competitive Benchmarking, By Operating and Technical Parameters |
11 Company Profiles |
12 Recommendations |
13 Disclaimer |
Global Go To Market Strategy - 2030
Export potential enables firms to identify high-growth global markets with greater confidence by combining advanced trade intelligence with a structured quantitative methodology. The framework analyzes emerging demand trends and country-level import patterns while integrating macroeconomic and trade datasets such as GDP and population forecasts, bilateral import–export flows, tariff structures, elasticity differentials between developed and developing economies, geographic distance, and import demand projections. Using weighted trade values from 2020–2024 as the base period to project country-to-country export potential for 2030, these inputs are operationalized through calculated drivers such as gravity model parameters, tariff impact factors, and projected GDP per-capita growth. Through an analysis of hidden potentials, demand hotspots, and market conditions that are most favorable to success, this method enables firms to focus on target countries, maximize returns, and global expansion with data, backed by accuracy.
By factoring in the projected importer demand gap that is currently unmet and could be potential opportunity, it identifies the potential for the Exporter (Country) among 190 countries, against the general trade analysis, which identifies the biggest importer or exporter.
To discover high-growth global markets and optimize your business strategy:
Click Here
Pricing
- Single User License$ 1,995
- Department License$ 2,400
- Site License$ 3,120
- Global License$ 3,795

Leadership Perspectives from Industry Events
Search
Thought Leadership and Analyst Meet


Our Clients
6WResearch In News
- Doha a strategic location for EV manufacturing hub: IPA Qatar
- Demand for luxury TVs surging in the GCC, says Samsung
- Empowering Growth: The Thriving Journey of Bangladesh’s Cable Industry
- Demand for luxury TVs surging in the GCC, says Samsung
- Video call with a traditional healer? Once unthinkable, it’s now common in South Africa
- Intelligent Buildings To Smooth GCC’s Path To Net Zero
Latest Reports
- Taiwan Airport Wireless Infrastructure Market (2026-2032)
- Vietnam Airport Wireless Infrastructure Market (2026-2032)
- Thailand Airport Wireless Infrastructure Market (2026-2032)
- South Korea Airport Wireless Infrastructure Market (2026-2032)
- Romania Airport Wireless Infrastructure Market (2026-2032)
- Qatar Airport Wireless Infrastructure Market (2026-2032)
- Philippines Airport Wireless Infrastructure Market (2026-2032)
- Japan Airport Wireless Infrastructure Market (2026-2032)
- Taiwan Airport Winter Services Market (2026-2032)
- Vietnam Airport Winter Services Market (2026-2032)
Industry Events and Analyst Meet

HIMTEX 2026

India Refining Summit 2026

India EV Show 2026

EV tech India Expo 2026

Auto Tech Asia 2026
Whitepaper
- Middle East & Africa Commercial Security Market Click here to view more.
- Middle East & Africa Fire Safety Systems & Equipment Market Click here to view more.
- GCC Drone Market Click here to view more.
- Middle East Lighting Fixture Market Click here to view more.
- GCC Physical & Perimeter Security Market Click here to view more.